ISSN(Online): 2319-8753 ISSN (Print): 2347-6710
I
nternational
J
ournal of
I
nnovative
R
esearch in
S
cience,
E
ngineering and
T
echnology
(An ISO 3297: 2007 Certified Organization)
Website: www.ijirset.com
Vol. 6, Issue 5, May 2017
Application for Rice Quality Assessment and
Classification Using Image Processing
Technique
Dr.Prashant Kumbharkar, Deepali, Padwal Asha, Priyanka Upale, Saste Megha.
Department of Computer Engineering, Pune University, Pune, India
ABSTRACT: This paper introduces a solution of grading and evaluation of rice grains on the basis of grain size and shape using image processing techniques. Especially edge detection algorithm is used to find out the region of boundaries of each grain. The existing system of rice portal consists of following features: 1. Market report 2. Finance 3.USDA information 4.Features.In our paper there are little more advancement like: 1. Farmers will capture the image of the harvested rice and that image will be uploaded on our web portal. 2. With the help of this image, consumer can easily classify and judge the quality of rice. 3. This application will help the entire stake holders who are responsible of making almost 60%of the food grains business in India.
KEYWORDS: Grain quality, rice characteristics, imageacquisition, image processing and analysis, grain evaluation.
I. INTRODUCTION
The agricultural industry is oldest and mostwidespread industry in the world. Rice is grown in many regions across India. For about 65% of the people living in India, rice is a staple food for them. Rice is essential food to life in India and it is grown on a majority of the rural farms. Rice is the most important grain with regard to human nutrition and calorie intake, providing more than one fifth of the calories consumed worldwide by the human species. Traditionally quality offood products is defined from its physical and chemicalcharacteristics by human sensory panel. Physicalparameter includes grain size and shape, moisture content,chalkiness, whiteness, milling degree and bulk density.Moisture content is nothing but the water content in thegrain. For better storage purpose moisture content shouldbe in between 12-14%. Different methods are used formoisture analysis like standard moisture meter and hot airoven method. Chalkiness is the white spot present in therice endosperm. Chalky grain is defined as half of the grainis white in color and brittle in nature. Because of its brittle nature chalky grains break during milling so it affect onmilling degree of rice. On the basis of chalkiness ricegrains are classified as white belly, white center and whiteback. Chalky rice reduces the palatability of cookingproducts so presence of chalkiness more than 20% is avoided in worlds market. Magnifying glass andphotographic enlarger used for chalkiness detection.
Thepaper focused on grain size and shape analysis using imageprocessing techniques. For the measurement of grain sizeand shape dial micrometer, graphical method and grainshape tester are used. But all these methods are timeconsuming and some of them are costly. To overcome theselimitation image processing techniques is an alternative and best solution.The main objective of the proposed method is toprovide an alternative solution for quality analysis whichminimizes the required time and cost. Image processing isvery important and advanced technological fields wheresignificant developments have been made. Efforts are beinggeared to replace the traditional human sensory panel.
II. RELATED WORK
ISSN(Online): 2319-8753 ISSN (Print): 2347-6710
I
nternational
J
ournal of
I
nnovative
R
esearch in
S
cience,
E
ngineering and
T
echnology
(An ISO 3297: 2007 Certified Organization)
Website: www.ijirset.com
Vol. 6, Issue 5, May 2017
can be taken by external influence such as fatigue, bias etc. with the help of image processing technique we can overcome that. By using various procedures to obtain the percentage quality of rice grain.we referred Grading of rice grains by image processing technology.
Chetana V.et al proposed image processing technique for non destructive Quality Analysis of Indian Gujarat-17 Oryza Sativa SSP Indica(Rice)[2].In this paper we give the solution of quality assessment through the computer vision, image analysis and processing we achieved high degree quality as compare to human inspection. This paper proposes a new method for counting the oryza sativa L(rice seeds) with long and small seeds by using image processing with high degree quality and then quantify the rice seeds based on combined measurement. We referred machine vision, computer vision, quality, image processing, image analysis, oryza sativa L.(Rice seeds) ISEF edge detection, combined measurement.
R.Kirutika,S.Muruganandet.al proposed matching of different rice grains using Digital Image Processing technique[3]. A digital image processing approach has been used to investigate different types of characteristics to identify the variety of rice. Two different variety of rice were used in test. These includes standards for rice length, area and aspect ratio and features of rice. It successfully shows the effectiveness of compactness as its features. The data base has been trained the data in number of time which recognize the rice. In these paper we referred technique of pre-processing, segmentation,blob analysis, feature matching.
S.Kanchana S. Lakshmi Bharati.et al proposed checked quality of selected rice varieties physically. [4]. In this paper we selected three districts to procurerice varieties .The selected districts are Madhurai, Virudhunagar and Tirunelveli and 41 varieties of rices were selected for this study. In this paper we referred materials and methods of physical quality of selected rice varieties and procure rice varieties.
BhupinderVerma proposed grading and classification of rice by using image processing[5]. For grading and classification of rice they used image analysis (IA) method using flatbed scanning(FBS). A flatbed scanner also called as desktop scanner is used to obtain images of the rice kernels. FBS are available at a lower cost. They are the most versatile and commonly used scanners and these are available in almost all offices. In this paper they referred Image analysis, Binarization Morphological Operations, Computer /Machine vision, NeuralNetworks, basic steps in the classification and grading of rice.
ISSN(Online): 2319-8753 ISSN (Print): 2347-6710
I
nternational
J
ournal of
I
nnovative
R
esearch in
S
cience,
E
ngineering and
T
echnology
(An ISO 3297: 2007 Certified Organization)
Website: www.ijirset.com
Vol. 6, Issue 5, May 2017
SheetalMahajan, SukhvirKauret,et al proposed solution of quality analysis of Indian Basmati rice grain using Top Hat Transformation. In this paper the problem of Non uniform, illumination for quality assessment is defined which show their effects in the process of extracting object from the background and cause segmentation errors. This proposed method achieves high degree of accuracy in correcting the effects of non uniform illumination than computer vision inspection. This proposed method is based on Morphological features is developed for counting
The number of Indian Basmati rice grain with Normal grains,Long grains and small grains.
Mrutyunjay M S, Lakshmikant T M, et al. proposed solution for quality evaluation and grading of rice grains using image processing techniques. According to the size of the grain (full, half or broken) the grading of rice is done. Quality of food grains are rapidly assessed through visual inspection be human inspectors.The decision making quality of human inspector are subjected to external influence such as fatigue, vengeance, bias etc .Through the help of image processing technique we can overcome that and which are also a non destructive and cost effective technique. The main procedures used in this paper are Input image, image preprocessing, grains extraction, counting of grains, analysis and grading.
Wan Putri N. W. M. Tahir, NorhaidaHussain et al. proposed about the method used for rice grading using image processing. Various approaches have been applied in the previous researchers to get rid of the difficulties for rice quality analysis. In most of the application machine vision has been used to differentiate rice grade based on special features such as shape, length, chalkiness, color and internal damageof rice. The ways which have been used to differentiate and analyze degree level of rice are RGB color model, histogram, edge detection etc. In this paper we are also discussing and suggesting another method in rice grading for Malaysia’s type of rice using image processing method based on several features.
III. PROPOSED SYSTEM APPROACH
Proposed work focused quality analysis on the basis ofthe measurement of physical parameter i.e. grain size andshape using image processing techniques. Basmati rice isused for quality analysis. Basmati rice is classified as extralong, long, medium and short. The image processing
Technique is used for counting the number of rice seeds andclassifies them on the basis of length, breadth and lengthbreadthratio. Length is the average length of rice grainwhile breadth is the average breadth of rice grain andlength-breadth ratio is calculated as;
L/B = [(Avg. length of rice) / (Avg. breadth of rice)]*100
ISSN(Online): 2319-8753 ISSN (Print): 2347-6710
I
nternational
J
ournal of
I
nnovative
R
esearch in
S
cience,
E
ngineering and
T
echnology
(An ISO 3297: 2007 Certified Organization)
Website: www.ijirset.com
Vol. 6, Issue 5, May 2017
Fig.1. Original Image
The flow of image processing algorithm is shownin fig. 2 which consists of some basic steps. Rice seeds arerandomly placed on black background for imageacquisition. Image is acquired and stored for furtheranalysis. In first pre-processing step image registrationtakes place and noise is removed from the image by usingfilter.In second step we perform thresholding algorithm to find out threshold value of rice. In third step weperform edge detection to find out the region ofboundaries. In forth step to we perform a bounding box to find out heightand width of rice properly. In fifth steps find rice seed measurement is doneand in the same step length, breadth and length-breadth is also measured. In the six step of the algorithm rice isclassified according to its size and shape.
IV. METHODOLOGY
Bounding Box Edge Detection
ISSN(Online): 2319-8753 ISSN (Print): 2347-6710
I
nternational
J
ournal of
I
nnovative
R
esearch in
S
cience,
E
ngineering and
T
echnology
(An ISO 3297: 2007 Certified Organization)
Website: www.ijirset.com
Vol. 6, Issue 5, May 2017
Image pre-processing
Farmer capture image using color camera which issaved in the three dimensional RGB (red, green, blue) color space. The captured image stored in web-portal database which is shown in fig 3. Filter is applied to removenoise which occurs during the acquisition of image. Filteralso sharpens the image. Threshold algorithm is used to segment the rice grains from the black background. Usingcolor extractor color image get converted into gray image which is shown in fig4.
Noise Removing
Gray Scale
Edge detection
Edge detection helps to find out the region ofboundaries of rice. There are sixmethods are available for edge detection in vision andmotion toolbox like differentiation, gradient, canny,
ISSN(Online): 2319-8753 ISSN (Print): 2347-6710
I
nternational
J
ournal of
I
nnovative
R
esearch in
S
cience,
E
ngineering and
T
echnology
(An ISO 3297: 2007 Certified Organization)
Website: www.ijirset.com
Vol. 6, Issue 5, May 2017
Edge Detection
Bounding Box
Bounding Box helps to find out the height and width of the rice.
ISSN(Online): 2319-8753 ISSN (Print): 2347-6710
I
nternational
J
ournal of
I
nnovative
R
esearch in
S
cience,
E
ngineering and
T
echnology
(An ISO 3297: 2007 Certified Organization)
Website: www.ijirset.com
Vol. 6, Issue 5, May 2017
Object Measurement
Object classification
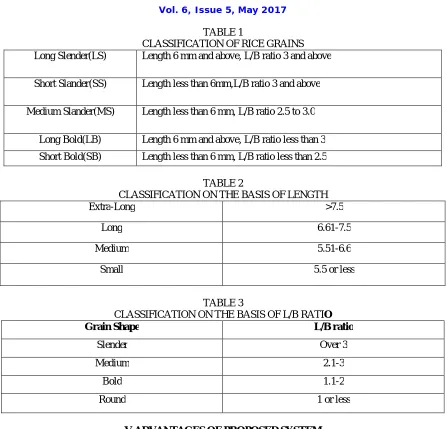
Classification requires all standard, measured andcalculated results. The standard database for rice size andshape measurement is referred from laboratory manual on rice grain quality, Directorate of Rice Research Rajendranagar, Hyderabad.
Object Classification
ISSN(Online): 2319-8753 ISSN (Print): 2347-6710
I
nternational
J
ournal of
I
nnovative
R
esearch in
S
cience,
E
ngineering and
T
echnology
(An ISO 3297: 2007 Certified Organization)
Website: www.ijirset.com
Vol. 6, Issue 5, May 2017
TABLE 1
CLASSIFICATION OF RICE GRAINS
Long Slender(LS) Length 6 mm and above, L/B ratio 3 and above
Short Slander(SS) Length less than 6mm,L/B ratio 3 and above
Medium Slander(MS) Length less than 6 mm, L/B ratio 2.5 to 3.0
Long Bold(LB) Length 6 mm and above, L/B ratio less than 3
Short Bold(SB) Length less than 6 mm, L/B ratio less than 2.5
TABLE 2
CLASSIFICATION ON THE BASIS OF LENGTH
Extra-Long >7.5
Long 6.61-7.5
Medium 5.51-6.6
Small 5.5 or less
TABLE 3
CLASSIFICATION ON THE BASIS OF L/B RATIO
Grain Shape L/B ratio
Slender Over 3
Medium 2.1-3
Bold 1.1-2
Round 1 or less
V.ADVANTAGES OF PROPOSED SYSTEM
ISSN(Online): 2319-8753 ISSN (Print): 2347-6710
I
nternational
J
ournal of
I
nnovative
R
esearch in
S
cience,
E
ngineering and
T
echnology
(An ISO 3297: 2007 Certified Organization)
Website: www.ijirset.com
Vol. 6, Issue 5, May 2017
VI. ALGORITHM
Input:
Rice sample input image.
Output:
Classified grain quality grade.
Steps of algorithm:
Step1: Pre-process the images of rice to remove background noise
Step2: Convert the pre processed image to binary image using threshold algorithm. Step3:Region label the binary image.
Step4: Segment/crop the individual grains present in the image.
Step5: Extract the geometric features major axis, minor axis and area of all the individual grains Step6: Perform analysis on the quality using the average values of the features extracted Step7: Classify the sample for the Type and grade based on the analysis
Stop.
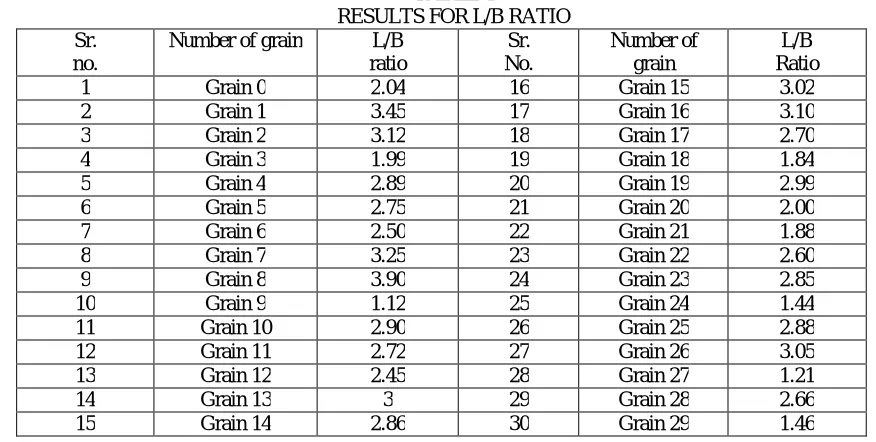
VII. RESULT AND DISCUSSION
The results which occurred by implementing image processing algorithms are shown in table 4. The results indicate length-breadth ratio of each grain.
TABLE 4
RESULTS FOR L/B RATIO Sr.
no.
Number of grain L/B
ratio Sr. No. Number of grain L/B Ratio
1 Grain 0 2.04 16 Grain 15 3.02
2 Grain 1 3.45 17 Grain 16 3.10
3 Grain 2 3.12 18 Grain 17 2.70
4 Grain 3 1.99 19 Grain 18 1.84
5 Grain 4 2.89 20 Grain 19 2.99
6 Grain 5 2.75 21 Grain 20 2.00
7 Grain 6 2.50 22 Grain 21 1.88
8 Grain 7 3.25 23 Grain 22 2.60
9 Grain 8 3.90 24 Grain 23 2.85
10 Grain 9 1.12 25 Grain 24 1.44
11 Grain 10 2.90 26 Grain 25 2.88
12 Grain 11 2.72 27 Grain 26 3.05
13 Grain 12 2.45 28 Grain 27 1.21
14 Grain 13 3 29 Grain 28 2.66
ISSN(Online): 2319-8753 ISSN (Print): 2347-6710
I
nternational
J
ournal of
I
nnovative
R
esearch in
S
cience,
E
ngineering and
T
echnology
(An ISO 3297: 2007 Certified Organization)
Website: www.ijirset.com
Vol. 6, Issue 5, May 2017
VIII. CONCLUSION
The image processing algorithms are developed to segment and identify rice grains. From the obtained results, it can be concluded that the use of image processing algorithm is an efficient method to analyze grains quality by its size. The main benefit of proposed method is it requires minimum time; cost is less and gives better results compared with manual results or traditional methods.
ACKNOWLEDGEMENT
I would like to take this chance to express my significant appreciation and profound respect to my Guide ProfPrashant Kumbharkar, for his excellent direction, significant criticism and steady consolation all through the length of time of the paper.We thanks to HOD comp, Prof. Prashant Kumbharkar and Director, Dr.S.S.Sonavane.
REFERENCES
[1] Jagdeep Singh Aulakh , Dr. V.K. Banga, “Grading ofrice grains by image processing”, International Journalof Engineering Research & Technology (IJERT), Vol. 1Issue 4, June 2012.
[2] Chetana V. Maheshwari, Kavindra R. Jain, ChintanK.Modi, “Non-destructive Quality Analysis of IndianGujarat-17 Oryza Sativa SSP Indica (Rice) UsingImage Processing”, International Journal of ComputerEngineering Science (IJCES) , Vol. 2 Issue 3, March2012.
[3] R.Kiruthika, S.Muruganand, AzhaPeriasamy, “Matching Of Different Rice Grains Using Digital Image Processing ”, International Journal of Advanced Research in Electrical, Electronics and Instrumentation Engineering Vol. 2, Issue 7, July 2013.
[4] S. Kanchana, S. Lakshmi Bharati, M. Ilamran and K.Singaravadivel, “Physical Quality of Selected RiceVerities”, World Journal of Agriculture Sciences, pp.468-472, 2012.
[5]BhupinderVerma, “Image Processing Techniques forGrading& Classification of Rice”, InternationalConference on Computer and CommunicationTechnology (ICCCT), pp. 220-223, 2012.
[6] Jagdeep Singh Aulakh, V. K. Banga, “Percentage Purity of Rice Samples by Image
Processing ”, International Conference on Trends in Electrical, Electronics and Power Engineering (ICTEEP'2012) July 15-16, 2012 Singapore. [7]VidyaPatil, V. S. Malemath, “Quality Analysis and Grading of Rice GrainImages ”, International Journal of Innovative Research in Computerand Communication Engineering(An ISO 3297: 2007 Certified Organization)Vol. 3, Issue 6, June 2015.
[8]SheetalMahajan, SukhvirKaur, “ Quality Analysis of Indian Basmati Rice Grains using Top-Hat Transformation ”, International Journal of Computer Applications (0975 – 8887) Volume 94 – No 15, May 2014.