ESTIMATION OF TRAPIDIL USING RP-HPLC
Atul T. Hemke*, Aparna A. Krupale and Krishna R. Gupta
Smt. Kishoritai Bhoyar College of Pharmacy, New Kamptee, Rashtrasant Tukdoji Maharaj
Nagpur University, Nagpur.
ABSTRCT
A simple validated stability indicating reverse phase high performance
liquid chromatographic method has been developed for the
determination of Trapidil. An isocratic separation was carried out using
Princeton SPHR-100 C18 (250 x 4.6mm, 5µ) column using mobile
phase comprises of Acetonitrile: Phosphate buffer pH 3.0 in ratio 50:
50 at flow rate 1mL/min using 221nm as detection wavelength. The
Retention time for drug was found to be 4.178 ± 0.050min. The
linearity was found to be in the concentration ranging 10-70µg/mL.
The percent mean estimation of drug was nearly equal to 100%. The
developed method was found to be more selective and rapid with
respective shorter time. The force degradation studies were conducted
and % of undegraded drug was calculated under various stress conditions via solution and
solid state analysis. The stability study indicated degradation (not showing any additional
peak) upon certain extend. The proposed new, simple validated stability indicating assay
method was found suitable for routine analysis of Trapidil in dosage form.
KEYWORDS: Trapidil, RP-HPLC, Stability indicating method, Stress degradation study.
INTRODUCTION
Trapidil is a platelet-derived growth factor antagonist, was originally developed as a
vasodilator and anti-platelet agent and has been used to treat patients with ischemic coronary
heart; liver and kidney disease.
Article Received on 21 October 2017,
Revised on 12 Nov. 2017, Accepted on 02 Dec. 2017
DOI: 10.20959/wjpr201716-10326
*Corresponding Author
Atul T. Hemke
Smt. Kishoritai Bhoyar
College of Pharmacy, New
Kamptee, Rashtrasant
Tukdoji Maharaj Nagpur
Fig 1: Structure of Trapidil.
Literature survey indicated that the drug has been estimated from bulk, marketed formulation
and human serum by using instrumental methods like UV-spectroscopy[5], RP-HPLC[6,7] and HPTLC.[6] But no report was found to indicate stability testing of Trapidil. This paper describes simple, precise, accurate and sensitive RP-HPLC method development, validation
and stability studies (hydrolysis, oxidation, photo-degradation and thermal degradation) as
per international conference of harmonization guidelines.
MATERIALS AND METHODS
Reagents and chemicals
Trapidil was procured as gift sample from Ajanta pharmaceuticals, Mumbai. Reagents
include Methanol and Acetonitrile of HPLC grade, Potassium dihydrogen phosphate, ortho
phosphoric acid, Hydrogen chloride and Hydrogen peroxide of GR grade were used. Also
Hydroxypropyl methylcellulose-K15, Methylcellulose, Microcrystalline cellulose, Talc and
Magnesium stearate of GR grade was used for formulation.
Instrumentation and Chromatographic condition
The HPLC system comprised Shimadzu HPLC 1100 series, PrincetonSPHR-100 C18 column
(250 x 4.6mm,5µ) and ACN: Phosphate buffer pH 3.0 (50:50 v/v) as mobile phase with
quantification carried out at wavelength of 221 nm and using flow rate of 1 mL/min.
Preparation of Standard stock solution
Standard stock solution of Trapidil was prepared by dissolving about 10mg of drug in 50mL
of volumetric flask and volume was made upto the mark with methanol to get concentration
of 200µg/mL.
Working Standard solution
A 0.5mL of standard stock solution was further transferred in 10.0mL volumetric flask and
through 0.45µm membrane filter paper and degassed.
Stress degradation studies
Stress degradation studies were carried out via solution and solid state analysis.
General procedure for Solution state analysis
10mg of standard drug and sample equivalent to 10mg was transfered in 50mL of volumetric
flask separately. To each flask 10mL of 0.1N NaOH/HCl/3%H2O2/H2O was added and kept
at room temperature, 600C and 800C for a period of 180min. After 180min neutralization was carried out of acidic and alkaline stress sample. The content of the each flask was sonicated
for 15min, volume was made upto the mark with methanol and filtered. The 2mL of these
stress solution was further diluted to 10mL with methanol (Conc.40µg/mL).
General procedure for Solid state analysis
Standard Trapidil and sample were spread on petridish separately and kept in the oven at
600C, humidity chamber (400C, 75%) and in sunlight. After 48 hours, accurately measured quantity of Trapidil standard 10mg and sample equivalent to 10mg were withdrawn and
transferred to series of 50mL volumetric flask and volume was made upto the mark with
methanol. The content was sonicated for 15min and filtered. 2mL of these stress samples was
further diluted to 10ml with diluents (40µg/mL).
RESULTS AND DISCUSSION
Selection of Detection Wavelength
From the standard stock solution further working standard solution of 10µg/mL was prepared
using methanol and scanned the over the range of 200-400 nm using UV spectrophotometer.
The recorded spectrum of Trapidil showed considerable absorbance at 221 nm selected as
Fig.2: UV Spectra of Trapidil.
Optimization of chromatographic condition
After several trials for selection of stationary and mobile phase, stationary phase C18 and
mobile phase comprised of Acetonitrile: Potassium dihydrogen phosphate in the ratio 50:50
v/v shows sharp and symmetrical peak. The tailing factor obtained was less than two and
retention time was about 4.178 min which would reduce the total run time and ultimately
increase the productivity thus reducing the cost of analysis per sample.
Fig.3: Chromatogram of standard Trapidil.
Method Validation
System suitability
System suitability was verified by replicate analysis of five injections of Trapidil working
standard solution and the chromatogram was recorded. The system suitability parameters
such as asymmetry, theoretical plate count and reproducibility (% RSD) of analyte retention
time (Rt) and area of the five replicates were calculated from the observed chromatogram.
The results indicated that optimized chromatographic conditions was found to be suitable and
4 201.701
5 206.479
Mean 204.920
% RSD 1.03
Theoretical plate 13458
Retention time 4.178
Asymmetry 0.952
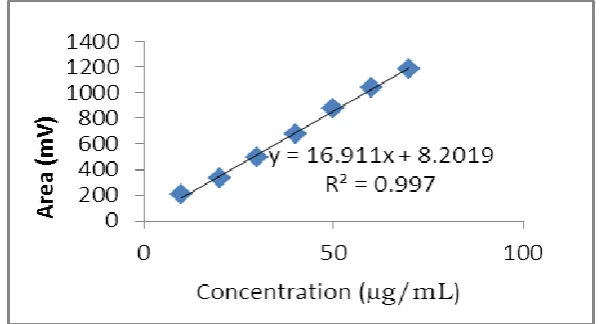
Linearity
From the stock solution (200µg/mL) of Trapidil, further dilutions were made with methanol
to get sample solutions of seven different concentrations. Each solution injected separately
and chromatogram was recorded. The linearity was determined by plotting graph between
peak area and concentration over the concentration range of 10-70µg/mL of Trapidil (Fig.4).
[image:5.595.172.422.83.254.2]The correlation coefficient was found to be 0.997.
Fig.4: Calibration curve of Trapidil.
Intermediate Precision
The intermediate precision of the proposed method was demonstrated by Intraday and
Intraday variation studies. In intraday studies, sample was analyzed for 0th, 3rd, 5th hour and percentage RSD was calculated. For the interday variation studies, sample was analyzed on 3
consecutive days and percentage RSD was calculated. For intraday and interday precision
[image:5.595.147.448.402.564.2]Table 2: Observation and results of intermediate presicion.
Intraday Interday
Sr. No.
Time (Hr)
Wt. of sample taken (mg)
AUC (mV)
% Labelled
claim Day
AUC (mV)
% Labelled claim 1. 0th
19.41
332.192 98.31 1st 339.028 100.35
2. 3rd 336.483 99.56 2nd 338.851 100.25
3. 5th 338.694 100.15 3rd 333.927 98.79
Mean 99.34 99.79
±SD 0.939 0.873
%RSD 0.95 0.88
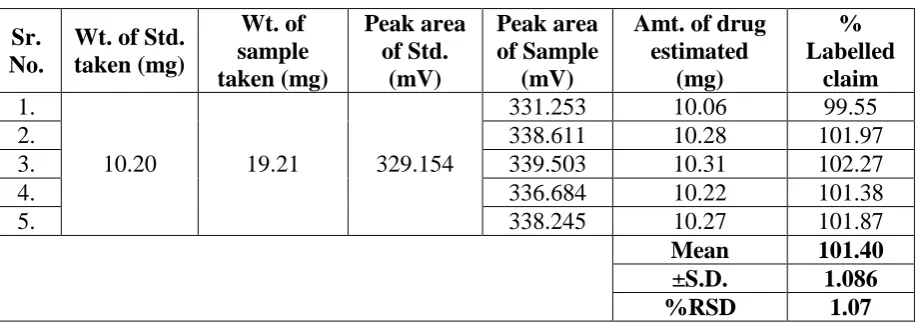
Precision
Accurately weighed quantity of laboratory mixture equivalent to 10.0mg of Trapidil was
transfer to 50.0mL of volumetric flask, sonicated for 15min with sufficient quantity of
diluents (methanol) and volume was made up to mark with methanol. The content of flask
was filtered through 0.45µm filter paper. A 1.0mL portion of the filtered was further diluted
to 10.0mL with diluents (20µg/mL). After equilibration of stationary phase, five such sample
solutions were injected separately and chromatogram were recorded. The content of Trapidil
in each sample was calculated by comparing the peak area of sample with the Std. using
[image:6.595.71.530.452.614.2]formula. The mean % assay of trapidil was 101.40 indicates proposed method is presice.
Table 3: Results for estimation of Trapidil.
Sr. No.
Wt. of Std. taken (mg) Wt. of sample taken (mg) Peak area of Std. (mV) Peak area of Sample (mV)
Amt. of drug estimated (mg) % Labelled claim 1.
10.20 19.21 329.154
331.253 10.06 99.55
2. 338.611 10.28 101.97
3. 339.503 10.31 102.27
4. 336.684 10.22 101.38
5. 338.245 10.27 101.87
Mean 101.40
±S.D. 1.086
%RSD 1.07
Linearity and range
Linearity and range was performed by weighing the sample at 80-120% of label claim and
dilution was made with methanol. Each solution was injected separately and
chromatographed. A plot of % label claim Vs area under curve (Fig.5) indicating linearity
Fig.5: Linearity curve of Trapidil.
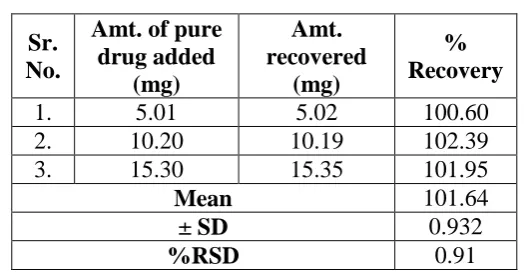
Accuracy (recovery study)
Accuracy of the method was studied by recovery experiments. The recovery experiments
were performed by adding known amounts of the drugs in the placebo. The recovery was
performed at three levels, 50, 100 and 150%. The recovery samples were prepared in the
aforementioned procedure; three samples were prepared for each recovery level and analyzed
using proposed method to calculate % recovery. The average recoveries of three levels for
Trapidil were found to be 101.64% with 0.91 as %RSD.
Table 4: Results of recovery study.
Robustness
The robustness of the method was evaluated by injecting the sample at deliberately varied
chromatographic conditions viz. change in composition of mobile phase (±5%), wavelength
(±5nm), pH(0.2) and flow rate (±0.2mL/min)and the effect on the area was noted. The
method is robust as mean % RSD was found to be 1.48.
Ruggedness
The ruggedness was performed by using two different analysts and %RSD was found to be
1.01 and 0.81.
Sr. No.
Amt. of pure
drug added (mg)
Amt. recovered
(mg)
% Recovery
1. 5.01 5.02 100.60
2. 10.20 10.19 102.39
3. 15.30 15.35 101.95
Mean 101.64
± SD 0.932
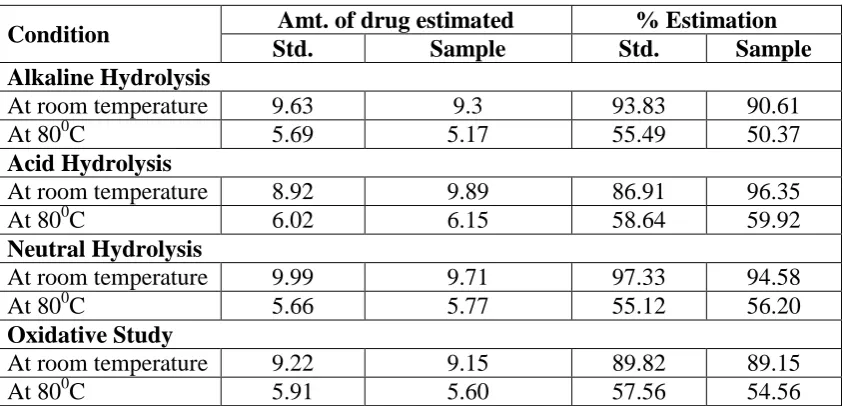
[image:7.595.217.480.434.570.2]Results of stress degradation study
The result obtained by hydrolysis and oxidative study are compared with the standard drug to
above mention conditions. This study explained that the rate of degradation of drug was more
as the temperature get increased. Around 40-50% degradation occurs at 800C as compared to room temperature. No additional peak was found under all stress conditions. It was observed
that excipients have no effect on the degradation of drug in laboratory mixture. At the same
[image:8.595.88.510.249.452.2]time drug and its laboratory mixture was considerably stable in specified stress conditions.
Table 5: Observation and results of solution state analysis.
Condition Amt. of drug estimated % Estimation
Std. Sample Std. Sample
Alkaline Hydrolysis
At room temperature 9.63 9.3 93.83 90.61
At 800C 5.69 5.17 55.49 50.37
Acid Hydrolysis
At room temperature 8.92 9.89 86.91 96.35
At 800C 6.02 6.15 58.64 59.92
Neutral Hydrolysis
At room temperature 9.99 9.71 97.33 94.58
At 800C 5.66 5.77 55.12 56.20
Oxidative Study
At room temperature 9.22 9.15 89.82 89.15
[image:8.595.116.493.479.731.2]At 800C 5.91 5.60 57.56 54.56
Table 6: Observations and results of solid state analysis.
Condition (2 days)
Amt. of drug
estimated (mg) % Estimation
Std. Sample Std. Sample
Thermal study (600C) 10.2 8.79 99.38 85.64 Humidity study (400C, 75%) 9.95 8.92 96.94 86.89 Photochemical study (sunlight) 9.66 9.58 94.10 93.33
Fig.6 (b): Chromatogram of sample at 800C in 0.1N HCl.
Fig.6(c): Chromatogram of sample at 800C in H2O.
Fig.6 (d): Chromatogram of sample at 800C in 3%H2O2
CONCLUSION
The proposed validated RP-HPLC method is sensitive, accurate, precise and robust.
Moreover, the developed method was found to be more selective and rapid with respect to
conditions. It shows degradation (not showing any additional peak) upon certain extend.
Hence, developed validated stability indicating method can be employed for the routine
quality control analysis of Trapidil in laboratory mixture.
ACKNOWLEGEMENT
The authors were thankful to Principal of Smt. Kishoritai Bhoyar College of Pharmacy,
Kamptee, Nagpur (MS), INDIA for providing necessary help for the work.
REFERENCES
1. Blessy M, Patel RD, Prajapati PN, Agrawal YK. Development of forced degradation and
stability indicating studies of drugs- A review. J Pharm Ana, 2014; 4(3): 159-165.
2. https://en.wikipedia.org/wiki/Trapidil, 26/7/2016, 11:15 a.m.
3. www.newdruginfo.com/pharmacopeia/bp2003/Trapidil.htm, 26/7/2016, 12:30 p.m.
4. Harrmann R. Automated high performance liquid chromatography assay for Trapidil in
human plasma. J Pharm and Biomed Ana, 1990; 8: 1045-1049.
5. Ragno G, Risoli A, Luca MD, Ioele G, Oliverio F. Determination of Trapidil in human
serum and urine by derivative UV spectroscopy after Selective Solid Phase Extraction.
Analytical and Bioana Chem, 2007: 923-929.
6. Sudha T, Vengadesh V, Ganesan V. Development and validation of UV, RP-HPLC and
HPTLC methods for estimation of Trapidil in bulk and pharmaceutical formulation.
American J Pharmatech Res, 2011; 1(3): 219-226.
7. Vijaya BS, Seshgiri Rao JN and Seetha RP. Development and validation of an RP-HPLC
method for the estimation of Trapidil in raw materials and tablet dosage forms. Res J
Pharm, Bio and Chem Sci, 2013; 4(4): 1385.
8. International Conference on Hormonization (ICH), Draft guidelines on validation of