Visualizing text similarities from a graph-based SOM
Khalid M. Kahloot
Islamic University of Gaza Gaza Strip, Palestine
Mohammad A. Mikki
Islamic University of GazaGaza Strip, Palestine
Akram A. ElKhatib
Suez Canal University,EgyptGaza Strip, Palestine [email protected]
ABSTRACT
Text in articles is based on expert opinion of a large number of people including the views of authors. These views are based on cultural or community aspects, which make extracting information from text very difficult. This paper introduced how to utilize the capabilities of a modified graph-based Self-Organizing Map (SOM) in showing text similarities. Text similarities are extracted from an article using Google's PageRank algorithm. Sentences from an input article are represented as graph model instead of vector space model. The resulted graph can be shown in a visual animation for eight famous graph algorithms execution with animation speed control.
The resulted graph is used as an input to SOM. SOM clustering algorithm is used to construct knowledge from text data. We used a visual animation for eight famous graph methods with animation speed control and according to similarity measure; an adjustable number of most similar sentences are arranged in visual form. In addition, this paper presents a wide variety of text searching. We had compared our project with famous clustering and visualization project in term of purity, entropy and F measure. Our project showed accepted results and mostly superiority over other projects.
Indexing terms/Keywords
Clustering, visualization, self-organizing map, text similarity, Google's PageRank
Academic Discipline And Sub-Disciplines
Computer Science, Engineering, Information Technology.
SUBJECT CLASSIFICATION
Data Mining, Visualization.TYPE (METHOD/APPROACH)
Analysis and ModelingCouncil for Innovative Research
Peer Review Research Publishing System
Journal:
INTERNATIONAL JOURNAL OF COMPUTERS & TECHNOLOGY
Vol.14, No.7
5878 |
P a g e M a y 1 2 , 2 0 1 5
1. INTRODUCTION
A context can be composed with variant sets of vocabularies and still express the same meaning. Sets of vocabularies in a text documented in an article or a webpage is subjected to opinion of a large number of people including the views of authors. It has different cultural or community aspects, which make extracting information from it very difficult. Search in text is to find text similarities between the sentences, paragraphs, and articles.
In the past few years, the importance of research in the field of search in textual information has become very important. A lot of research in text information retrieval has been carried out recently with the main concern in extraction and analysis of the text to describe the different aspects of the view of information. This information is contained mainly in three types of sources: First, reference text file from digital documents. Second, metadata provided by the distributors of web sites. Third, information extracted from the Internet. Text analysis is based on the descriptive function at a high level of the context, like the matrix structure presented in [10] or graphical representation based on the text of the attributes of the metadata described in [20]. This descriptive content can be clearly found in encyclopedias website such as Wikipedia, Encyclopedia.com, and Webopedia etc.
The aim of this paper is to build a graph-based unsupervised clustering based on Self-Organizing Map (SOM) for context extracted from text for semantics representation. We addressed problems like vocabulary ambiguity and variability, the substitutability and clarifying of words, correct rephrasing, and text parsing and analysis.
We adapted Google's PageRank algorithm as feature extractor and graph input generator for SOM. Sentences from an input article are represented as graph model instead of vector space model. A modified version of SOM based on graph input can carry out unsupervised clustering. We support one of the most important tasks in text information retrieval that is extracting similarities and building a structure for data representation named Similarity Graph.
Similarity Graph can be viewed in three forms. First, in view logical in which graph is drown as vertices and edges. Another way to represent similarity graph is adjacency List. The last representation for similarity graph is adjacency matrix. We provide a visual animation for algorithms execution with animation speed control and a slide bar starting with slow to fast to control animation speed.
For navigation, we provide an animated execution control over similarity Graph in eight number of well-known algorithms. Those algorithms are Dijksrta's, Breath First, Depth First Search, Connected Components, Topological sort, Floyd-Warsall, kruskal's and prim's algorithm.
Experiments on our project showed accepted results and mostly superiority over other projects. We had compared our project with famous clustering and visualization project in term of purity, entropy and F measure. The rest of the paper is organized as follows: Section II presents related work of the weakness of vector representation, graph-based modelling over SOM and SOM visualization. Section III presents our contributions. We describe how to use Google's PageRank algorithm in feature extraction and graph-based clustering. Visualization is discussed in Section IV in which we explained similarity graph visualization and clustering visualization. Section V shows experimental results. In Section VI, Metrics of evaluations between our project and similar project Finally, Section VI concludes the paper.
2. RELATED WORK
2.1 The weakness of vector representation
A drawback in all varieties of SOM is working directly on the observation vector. Observation vector does not take the order of coordinates into account. In some cases, such as processing a time series, it might prove inappropriate to the specific nature of data. The original SOM did not define visual distribution on the input space. However, the advantages of introducing graphical methodologies into SOM models were soon evident. This has led to a wide range of proposals, which reflect the importance of graphical approaches to data clustering.
Some proposed studies tried to solve the weaknesses of VSM by graph-based models. Most of these studies improved successfully the quality of the resultant clusters. Semantic graph is used for document clustering as in [23], [3] and [2]. I n this algorithm, a semantic graph is used to represent semantic relationships in documents then convert those graphs into vectors. Vectors are then used in classical SOM algorithm as input. An improvement in the quality of document clustering is shown in this algorithm but it did not propose a direct technique to use the semantic graphs directly with SOM.
2.2 Graph-based modeling over SOM
Do Phuc and Mai Xuan Hung have developed a system for clustering the graphs [3]. They use SOM neural network for clustering the graphs and extracting the main ideas from the documents. They make SOM put the documents on a document map and help to access the content of similar documents.
Distance-based similarities in neighborhoods are the represented in Most of the proposed visualization schemes. Some of those schemes are U-matrix [33] and its variants [1], [34]. The size and shape of the cells to represent the prototypes are adapted in [32], [17]. Alternatively, some methods use Euclidean distances to update the grid positions of the prototypes for visual inspection as adapted lately in [30] and double SOM [22] and visualization-induced SOM (ViSOM) [16]. Size of receptive fields [17] and smoothed histograms [18] are other methods that uses density-based visualizations. However, density-based representations are less helpful compared to the distance-based visualizations unless density representation has a higher resolution than the receptive field size.
2.3 SOM visualization
Several studies that relate to using SOM for generation of topological maps of textual documents have been published. A. Becks, S. Sklorz and M. Jarke [25] use SOM as visualization method, which allows easy access to enterprise document collection. They suggested a modularization of similarity definition.
K. Lagus, T. Honkela, S. Kaski and T. Kohonen [30] developed WebSOM, visualization system for exploration of large collection of Internet Newsgroup e-mails. Documents were mapped from their n-dimensional document content space to two-dimensional map of neurons with topology preservation. After this, each neuron is labelled with Newsgroup name that most documents mapped to this neuron belong to.
2.4 Graph-based Feature Extraction
Much early work on document graph representations for text classification was directed at documents. Geibel et al. in [6] demonstrated that it is possible to classify documents using document structure alone and demonstrate that a much more powerful approach is to combine structure with linguistic and semantic information. For example, Schenker [13] proposed a number of methods to represent documents as graphs to include the structural information of the documents. The typical approach is to conduct classification using some similarity-based algorithm. However, approaches that operate using graph similarity measures are computationally expensive. For example computing the “maximum common subgraph” between two graphs is a NP hard problem [36].
Previous work [8] and [10] has looked at the collocation of terms and their frequencies as graphs, rather than the linguistic structure of the sentence. One other study [11] has represented linguistic information as well as word order in a graph for text classification; however, the work was limited to very small texts of between 8 to 13 tokens such as the titles of works. As such, adopting the usage of linguistic information, structure and semantics in a graph for text classification at a full text scale.
In order to achieve this scale of processing, the use of frequent subgraph mining is essential. Frequent subgraph (and sub-tree) mining, using various approaches, has been extensively studied [24], [21], [15] and [12]. However, the main bottleneck is the number of unnecessary candidate frequent subgraphs generated. A substantial amount of work has been undertaken focusing on developing efficient graph mining algorithms using elegant search strategies, data structures or their combinations. Some authors have suggested the use of constraint based frequent subgraph mining to remove unwanted patterns.
Tao et al. [14] proposed a model of weighted support, which satisfies a weighted DC property. Yun et al. [4], [27] and [5] introduced a series of concepts such as “weight range”, “weight confidence”, and “support confidence” for WARMin order to maintain the DC property and push the weight constraint into the mining process. Although the ideas e spoused by WARM cannot be applied directly to weight frequent subgraph mining; this body of work at least in part, influences the research described here.
3. CONTRIBUTION
3.1 Project Overview
The underlying combinative theories behind them derive from two main ideas: the transforming SOM to accept graph as an input and capturing the output topology as an output. We had studied and presented a comprehensive view of the state of the art, with a perspective of the involved theatrical frameworks.
This paper examines the most commonly used graph model representation. Build a text information retrieval application from the scratch takes a very long time. The current available applications based on clustering systems or data features visualizations that may present text sentences to the document currently visualized. Subsequently, all of this gave us a great motivation to build a toolkit easy to extend project. We had developed a project, which is produces as an object -oriented design concept and implemented in Java, which also facilitates its extensibility. Intended to be as a tool to build and customize applications as a basis can be used to cluster and visualize text to provide a system to operate at full capacity.
3.2 Feature extraction using Google's PageRank
Feature Extraction is a branch of pattern recognition and image processing. Dimensionality reduction is the main purpose of feature extraction. For large input data set, there will be redundant suspected to an algorithm. Therefore, the input data will be transformed into a reduced representation set of features [7]. The transformation of input data into the set of features is called feature extraction. In this paper, we select Google's PageRank algorithm for feature extraction.
Over the past few years, Google is so far the most widely, used search engine in the world. PageRank is an algorithm used by Google Search to rank websites in their search engine results. PageRank was named after Larry Page, one of the founders of Google. PageRank is a way of measuring the importance of website pages.
It is not the only algorithm used by Google to order search engine results, but it is the first algorithm that was used by th e company, and it is the best known. Google uses an automated web spider called Google bot to actually count links and gather other information on web pages [7].
5880 |
P a g e M a y 1 2 , 2 0 1 5
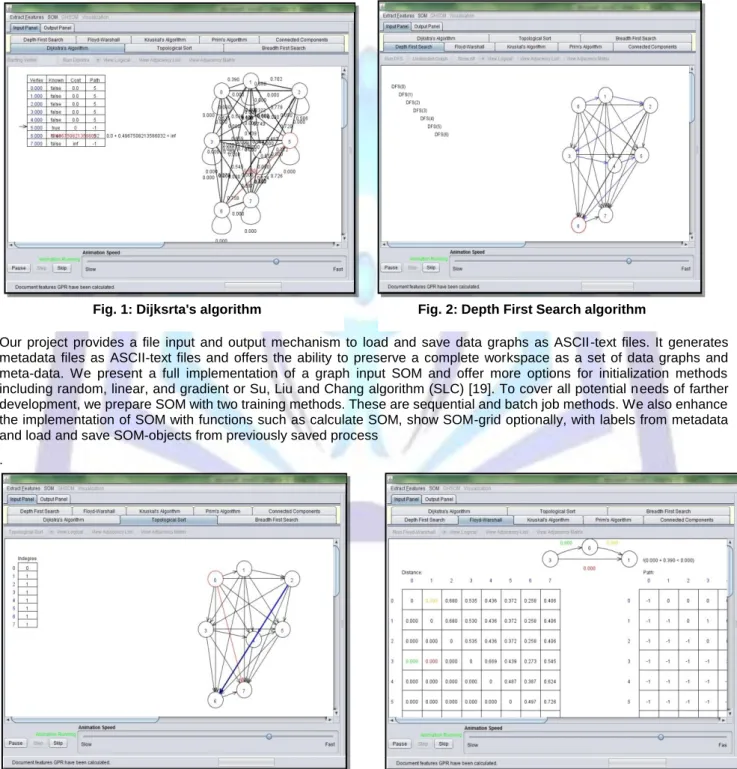
Fig. 1: Dijksrta's algorithm Fig. 2: Depth First Search algorithmFig. 3: Topological sort algorithm Fig. 4: Floyd-Warsall algorithm
3.3 Clustering using graph-based SOM
We use SOM for clustering of the text similarity features. A modified version of SOM, which accepts graph as an input an also able to present similarity graph visualization. In addition, it provides the integration with five famous clustering visualization algorithms. Our project produces an automated graph generation due to the modification of SOM and the hieratical advantage of Google's PageRank similarity graph. The project is able to capture different types of clusters by using appropriate similarity criterion. The number of clusters is determined by prior knowledge on data sets using a recent cluster validity index derived from Google's PageRank. We show that a graph input-output clustering can produce better partitioning than other types of clustering.
Our project is based on graph visualization of the topology of the neutral network resulting documents clustering using a modified version of SOM. This method combines the advantages of graph representation in both inputting and outputting to the clustering process. Well illustrated relationships representing the semantic in documents as a graph is the input and illustrated visual representation of topology of the resulting clustering is the output.
Our project provides a file input and output mechanism to load and save data graphs as ASCII-text files. It generates metadata files as ASCII-text files and offers the ability to preserve a complete workspace as a set of data graphs and meta-data. We present a full implementation of a graph input SOM and offer more options for initialization methods including random, linear, and gradient or Su, Liu and Chang algorithm (SLC) [19]. To cover all potential n eeds of farther development, we prepare SOM with two training methods. These are sequential and batch job methods. We also enhance the implementation of SOM with functions such as calculate SOM, show SOM-grid optionally, with labels from metadata and load and save SOM-objects from previously saved process
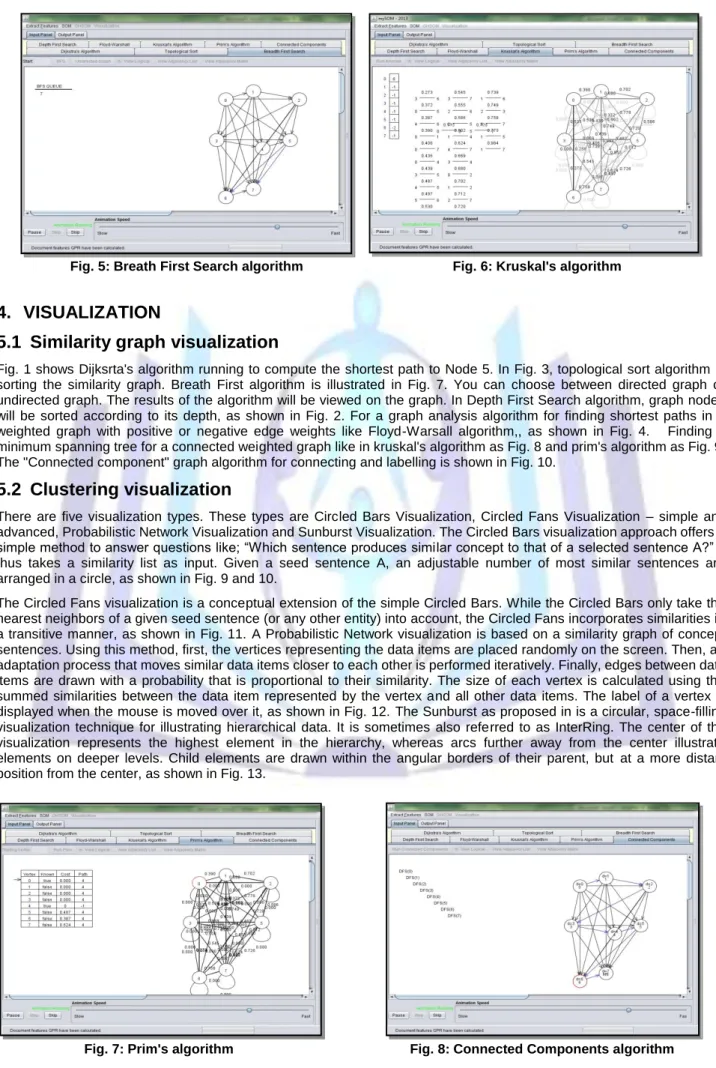
Fig. 6: Kruskal's algorithm Fig. 5: Breath First Searchalgorithm
Fig. 7: Prim's algorithm Fig. 8: Connected Components algorithm
4. VISUALIZATION
5.1 Similarity graph visualization
Fig. 1 shows Dijksrta's algorithm running to compute the shortest path to Node 5. In Fig. 3, topological sort algorithm is sorting the similarity graph. Breath First algorithm is illustrated in Fig. 7. You can choose between directed graph or undirected graph. The results of the algorithm will be viewed on the graph. In Depth First Search algorithm, graph nodes will be sorted according to its depth, as shown in Fig. 2. For a graph analysis algorithm for finding shortest paths in a weighted graph with positive or negative edge weights like Floyd-Warsall algorithm,, as shown in Fig. 4. Finding a minimum spanning tree for a connected weighted graph like in kruskal's algorithm as Fig. 8 and prim's algorithm as Fig. 9. The "Connected component" graph algorithm for connecting and labelling is shown in Fig. 10.
5.2 Clustering visualization
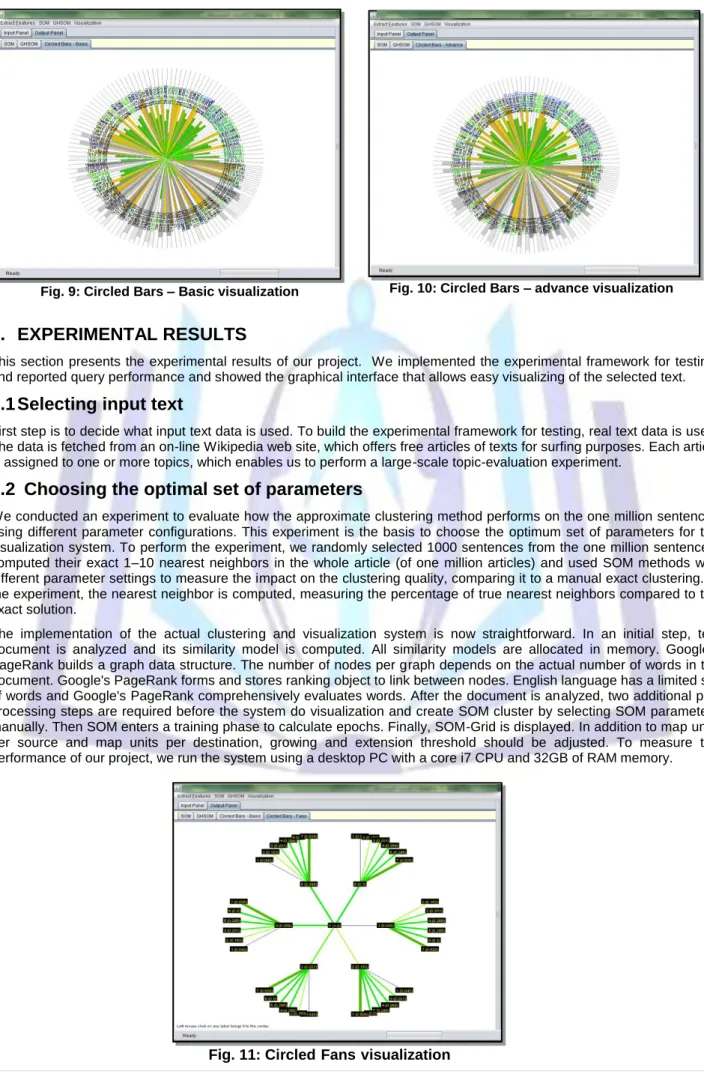
There are five visualization types. These types are Circled Bars Visualization, Circled Fans Visualization – simple and advanced, Probabilistic Network Visualization and Sunburst Visualization. The Circled Bars visualization approach offers a simple method to answer questions like; “Which sentence produces similar concept to that of a selected sentence A?” It thus takes a similarity list as input. Given a seed sentence A, an adjustable number of most similar sentences are arranged in a circle, as shown in Fig. 9 and 10.
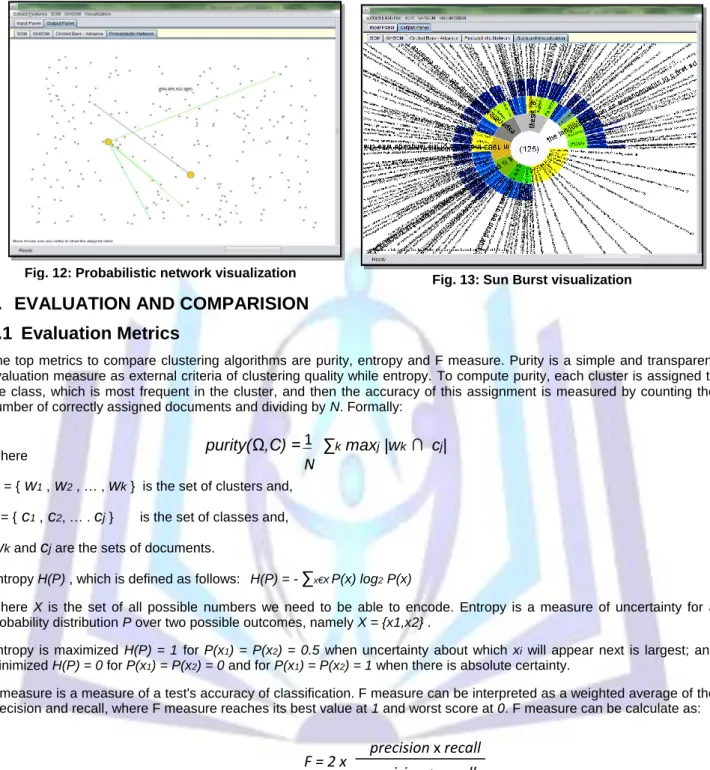
The Circled Fans visualization is a conceptual extension of the simple Circled Bars. While the Circled Bars only take the nearest neighbors of a given seed sentence (or any other entity) into account, the Circled Fans incorporates similarities in a transitive manner, as shown in Fig. 11. A Probabilistic Network visualization is based on a similarity graph of concept sentences. Using this method, first, the vertices representing the data items are placed randomly on the screen. Then, an adaptation process that moves similar data items closer to each other is performed iteratively. Finally, edges between data items are drawn with a probability that is proportional to their similarity. The size of each vertex is calculated using the summed similarities between the data item represented by the vertex and all other data items. The label of a vertex is displayed when the mouse is moved over it, as shown in Fig. 12. The Sunburst as proposed in is a circular, space-filling visualization technique for illustrating hierarchical data. It is sometimes also referred to as InterRing. The center of the visualization represents the highest element in the hierarchy, whereas arcs further away from the center illustrate elements on deeper levels. Child elements are drawn within the angular borders of their parent, but at a more distant position from the center, as shown in Fig. 13.
5882 |
P a g e M a y 1 2 , 2 0 1 5
Fig. 9: Circled Bars – Basic visualization Fig. 10: Circled Bars – advance visualizationFig. 11: CircledFansvisualization
5. EXPERIMENTAL RESULTS
This section presents the experimental results of our project. We implemented the experimental framework for testing, and reported query performance and showed the graphical interface that allows easy visualizing of the selected text.
6.1 Selecting input text
First step is to decide what input text data is used. To build the experimental framework for testing, real text data is used . The data is fetched from an on-line Wikipedia web site, which offers free articles of texts for surfing purposes. Each article is assigned to one or more topics, which enables us to perform a large-scale topic-evaluation experiment.
6.2 Choosing the optimal set of parameters
We conducted an experiment to evaluate how the approximate clustering method performs on the one million sentences using different parameter configurations. This experiment is the basis to choose the optimum set of parameters for the visualization system. To perform the experiment, we randomly selected 1000 sentences from the one million sentences, computed their exact 1–10 nearest neighbors in the whole article (of one million articles) and used SOM methods with different parameter settings to measure the impact on the clustering quality, comparing it to a manual exact clustering. In the experiment, the nearest neighbor is computed, measuring the percentage of true nearest neighbors compared to the exact solution.
The implementation of the actual clustering and visualization system is now straightforward. In an initial step, text document is analyzed and its similarity model is computed. All similarity models are allocated in memory. Google's PageRank builds a graph data structure. The number of nodes per graph depends on the actual number of words in the document. Google's PageRank forms and stores ranking object to link between nodes. English language has a limited set of words and Google's PageRank comprehensively evaluates words. After the document is analyzed, two additional pre-processing steps are required before the system do visualization and create SOM cluster by selecting SOM parameters manually. Then SOM enters a training phase to calculate epochs. Finally, SOM-Grid is displayed. In addition to map units per source and map units per destination, growing and extension threshold should be adjusted. To measure the performance of our project, we run the system using a desktop PC with a core i7 CPU and 32GB of RAM memory.
Fig. 12: Probabilistic network visualization Fig. 13: Sun Burst visualization
6. EVALUATION AND COMPARISION
6.1 Evaluation Metrics
The top metrics to compare clustering algorithms are purity, entropy and F measure. Purity is a simple and transparent evaluation measure as external criteria of clustering quality while entropy. To compute purity, each cluster is assigned to the class, which is most frequent in the cluster, and then the accuracy of this assignment is measured by counting the number of correctly assigned documents and dividing by N. Formally:
Where
Ω
= {w
1 ,w
2 , … ,w
k } is the set of clusters and, C = {c
1 ,c
2, … .c
j } is the set of classes and,w
k andc
j are the sets of documents.Entropy H(P) , which is defined as follows: H(P) = -
∑
x€X P(x) log2 P(x)Where X is the set of all possible numbers we need to be able to encode. Entropy is a measure of uncertainty for a probability distribution P over two possible outcomes, namely X = {x1,x2} .
Entropy is maximized H(P) = 1 for P(x1) = P(x2) = 0.5 when uncertainty about which xi will appear next is largest; and minimized H(P) = 0 for P(x1) = P(x2) = 0 and for P(x1) = P(x2) = 1 when there is absolute certainty.
F measure is a measure of a test's accuracy of classification. F measure can be interpreted as a weighted average of the precision and recall, where F measure reaches its best value at 1 and worst score at 0. F measure can be calculate as:
Where precision of classification is the fraction of retrieved documents that are relevant to the query as:
Recall in information retrieval is the fraction of the documents that are relevant to the query that are successfully retrieved as:
N
purity(Ω,C) = ∑
−
1
kmax
j|w
k∩ c
j|
precision
x
recall
precision
+
recall
F = 2 x
|{relevant docs}
∩
{retrived docs}|
|{ retrived docs}|
precision
=
|{relevant docs}
∩
{retrived docs}|
|{ relevant docs}|
recall
=
5884 |
P a g e M a y 1 2 , 2 0 1 5
Table 1 Five variant SOM configurations
Table 1 shows five variant SOM configurations for one million sentences article. Fig. 4 shows clustering execution time of these five SOM configurations. From the Fig., we see that the final system is capable of visualizing text clustering in maximum of 0.29 seconds for a one million sentences article while returns about 94% of the correct nearest neighbors. The application built similarity graph. Nodes construction will be displayed in the black messaging area. The text document that you choose will be displayed at right side text viewer area.
6.2 Evaluation Discussion
For our project, the actual features are not visualized; instead, Sentences interrelationships, which are the relevant aspects for clustering, are displayed. To evaluate our work we should look for similar methods, which compound clustering, and visualization at the same time. The closest published projects are Clusion [28], CViz [28] and the other graph-based SOMs.The main obstacle is that each project is carried out over different dataset with different scale of document. The published results of each project needed to processed and scaled up or down to make suitable for comparison with each other. Some resources reported only one metric while others mentioned two. Thus, we aggregated results from multiple papers to cover the whole metrics.
Table 2 Metric comparison between famous clustering and visualization projects. Our project shows good results.
Project Purity Entropy F measure Our project 82 % 0.33 0.76 Clusion 84 % 0.26 0.61 CViz 82 % 0.46 0.43 T-GHSOM [2] 79 % 0.62 0.39 G-GHSOM [2] 80 % 0.48 0.46 Phuc SOM [3] 82 % 0.56 0.36
Aggregated results show accepted values of metrics compared to similar SOM project of clustering and visualization. Our results is close to Clusion project. The average purity was 82 %, which is quite similar to all famous project. In the other hand, our project improved the average F-measure by 10 %, over the best value and 40 % over the lowest value in corresponding project. In Entropy comparison, Clusion shows superiority over our project by 7 %. The reduction of the Entropy compared to other project was 29 % and 13 % over the highest and lowest values in corresponding project, respectively.
7. CONCLUSION
We have designed and implemented a new framework for clustering sets of sentences of full-text article that is available in electronic form. Our project is suitable for visualization of tasks in which the user has a vague idea of the contents of the text article being examined. With our project, the sentences are ordered meaningfully on a graph map according to their contents. Graph representation helped visualization by giving an overall view of what the information space looks like. We showed how to use the text similarity features natively and correctly in SOM clustering algorithm by merging Google's PageRank algorithm into it, developed a method to alleviate the hub problem and created a visualizing solution for the reviewed class of text similarity algorithms. We used Google's PageRank algorithm as feature extractor and graph generator for graph-based SOM.
Config 1 Config 2 Config 3 Config 4 Cofig5
map units per
source 2 4 6 8 10
map units per
destination 2 4 6 8 10
Growing threshold 0.2 0.4 0.6 0.8 1.0 expanding threshold 0.2 0.4 0.6 0.8 1.0 max size of single
map 20 40 60 80 100
max depth 20 40 60 80 100
Our project provided a visual animation for eight famous graph algorithms, which can be executed with animated with speed control to illustrate graph of features.in addition, our project provided a visual animation for five famous c lustering visualization algorithms, which can be executed with animated with speed control. We had compared our project with famous clustering and visualization project in term of purity, entropy and F measure. Our project showed accepted results and mostly superiority over other projects. We intend to extend the SOM algorithm and examine other versions of SOM such as GHSOM [26], WebSOM [30] and ViSOM [16]. We this those version may enhance the quality over our project.
REFERENCES
[1] Shklovets and N. Axak, "Visualization of high-dimensional data using two-dimensional self-organizing piecewise-smooth Kohonen maps", Optical Memory and Neural Networks Journal, vol. 21, page(s) 227-232, October 2012. [2] F. Hussin, M. Farra and Y. Sonbaty, "Extending the Growing Hierarchal SOM for Clustering Documents in Graphs
domain", International Joint Conference on Neural Networks, Pp. 4028–4035,June 2008.
[3] D. Phuc and M. X. Hung, "Using SOM based Graph Clustering for Extracting Main Ideas from Documents", Research, Innovation and Vision for the Future International IEEE Conference Page(s) 209 - 214, July 2008.
[4] H. Chim and X. Deng, "A New Suffix Tree Similarity Measure for Document Clustering", The 16th international conference on World Wide Web, Page(s) 121-130, May 2007.
[5] U. Yun, "WIS: Weighted Interesting Sequential Pattern Mining with a Similar Level of Support and/or Weight". ETRI Journal, vol. 29, No. 3, page(s): 336-352, June 2007.
[6] P. Geibel, U. Krumnack, O. Pustylnikov, A. Mehler, H. Gust and K. Kühnberger, "Structure-Sensitive Learning of Text Types", vol. 4830, page(s) 642-646, December 2007.
A. Langville and C. Meyer,"Google's PageRank and Beyond: The Science of Search Engine Rankings", Princeton University Press Princeton, ISBN: 0691122024, July 2006.
[7] Markov, M. Last, and A. Kandel, "Fast Categorization of Web Documents represented by Graphs", the Advances in Web Mining and Web Usage Analysis, vol 4811, Page(s): 56-71, August 2006.
[8] Schenker, H. Bunke, A. Kandel and M. Last, "Graph Theorectic Techniques for Web Content Mining", Series in Machine Perception and Artificial Intelligence, ISBN: 978-981-256-339-2, May 2005.
[9] M. Schedl, P. Knees, and G. Widmer." Using CoMIRVA for Visualizing Similarities between Music Artists". The 16th IEEE Visualization 2005 Conference, October 2005.
[10] E. Koutsomitopoulou and D. Loritz, "A neural network model for the representation of natural language", Doctoral Dissertation - Georgetown University, January 2004.
[11] Y. Chi, S. Nijssen, R. Muntz, and J. Kok, "Frequent Subgree Mining an Overview", Fundamenta Informaticae, Special Issue on Graph and Tree Mining, vol. 66, Page(s):161-198, November 2004.
A. Rauber, E. Pampalk, and D. Merkl. "The SOM enhanced JukeBox: Organization and visualization of music collections based on perceptual models", Journal of New Music Research, vol. 32, pages: 193–210, May 2003. [12] F. Tao, F. Murtagh, and M. Farid,"Weighted Association RuleMining using Weighted Support and Significance
Framework". The ACM SIGKDD International Conference on Knowledge Discovery and Data Mining, August 2003. [13] J. Huan, W. Wang, and J. Prins, "Efficient Mining of Frequent Subgraph in the Presence of Isomorphism". The 3th
IEEE International Conference on Data Mining, page(s): 549 - 552, November 2003.
[14] H. Yin, "ViSOM- a novel method for multivariate data projection and structure visualization", IEEE Transactions on Neural Networks, vol. 13, Page(s). 237–243, January 2002.
[15] R. Gruen and T. Kubota, "A neural network approach to system performance analysis", IEEE Digital Object Identifier, Page(s) 349 - 354, April 2002.
[16] E. Pampalk, A. Rauber, and D. Merkl, "Using smoothed data histograms for cluster visualization in self-organizing maps", International Work-Conference of Artificial Neural Networks, Page(s) 871–876, August 2002.
[17] Mu-Chun Su1, Ta-Kang Liu and Hsiao-Te Chang, " improving the Self-Organizing Feature Map Algorithm Using an Efficient Initialization Scheme ", Tamkang Journal of Science and Engineering, Vol. 5, No. 1, pp. 35-48, August 2002. [18] J. Aucouturier and F. Pachet. "Music Similarity Measures: What’s the Use?". The 3rd International Symposium on
Music Information Retrieval, pages 157-163, October 2002.
[19] X. Yan and J. Han, "gSpan: Graph-based Substructure Pattern Mining". The 2nd IEEE International Conference on Data Mining, Page(s): 721 - 724, December 2002.
[20] M.-C. Su and H.-T. Chang, "A new model of self-organizing neural networks and its applications", IEEE Transactions on Neural Networks, vol. 12, Page(s) 153–158, January 2001.
[21] Choudhary and P. Bhattacharyya, "Text Clustering Using Universal Networking Language", Universal Networking Language Conference, vol. 16, Page(s) 22-36, November 2001.
5886 |
P a g e M a y 1 2 , 2 0 1 5
[22] M. Kuramochi, and G. Karypis, "Frequent Subgraph Discovery", IEEE International Conference on Data Mining,Page(s): 313-320, November 2001.
A. Becks, S. Sklorz and M. Jarke, "A Modular Approach for Exploring the Semantic Structure of Technical Document Collection", the International Working Conference on Advanced Visual Interfaces, Page(s): 298-301, May 2000. [23] M. Dittenbach, D. Merkl, A. Rauber, "The Growing Hierarchical Self-Organizing Map", Proceedings of the Int’l Joint
Conference on Neural Networks (IJCNN’2000), Como, Italy,Page(s) VI-15 - VI-19., July 24-27, 2000.
[24] W. Wang, J. Yang, and P. Yu, "Efficient Mining of Weighted Association Rules(WAR)".the ACM SIGKDD International Conference on Knowledge Discovery and Data Mining, August 2000.
A. Strehl and J. Ghosh, "Clustering Guidance and Quality Evaluation Using Relationship-based Visualization", ASME Proc. ANNIE 2000, St. Louis,Page(s) 483--488 , November 2000
[25] S. Dhillon, D. S. Modha, and W. S. Spangler. "Visualizing class structure of high-dimensional data". In Proc. of 30th Symp. Interface: Computer Science and Statistics, Jan. 1998.
[26] S. Kaski, T. Honkela, K. Lagus, and L. Kohonen, "WEBSOM self-organizing maps of document collections", Neurocomputing, vol. 21, May 1998.
[27] M. Cottrell and E. de Bodt, "A Kohonen map representation to avoid misleading interpretations", 4th Europe Symposium on Artificial Neural Networks, Bruges, Belgium, Page(s) 103–110, April 1996.
[28] K. Lagus, T. Honkela, S. Kaski and T. Kohonen, "Self-organizing map of Document Collection, A New Approach to Interaktive Exploration", the 2nd International Conference on Knowledge Discovery and Data Mining, Page(s) 238-243, August 1996.
[29] M. Kraaijveld, J. Mao and A. Jain, "A nonlinear projection method based on Kohonen’s topology preserving maps", IEEE Transactions on Neural Networks, vol. 6, Page(s) 548–559, May 1995.
A. Ultsch, "Self-organizing neural networks for visualization and classification", Information and Classification-Concepts Methods and Applications, Page(s) 307–313, September 1993.
[30] X. Lin, D. Soergel and G. Marchionini, "A self-organizing Semantic Map for Information Retrieval", the 14th annual international ACM SIGIR conference on Research and development in information retrieval, Illinois, United States, page(s) 262-269,September 1991.
[31] M. Garey and D. Johnson, "Computers and Intractability: A Guide to the Theory of NP-Completeness", W. H. Freeman ISBN: 0716710447, January 1979.