A NEW HPLC METHOD DEVELOPMENT AND VALIDATION FOR
THE DETERMINATION OF DAPAGLIFLOZIN IN TABLET DOSAGE
FORM
Narottam Pal1*, Tayyaba Mahtab2, P. Pravalika Reddy3 and A. Srinivasa Rao4
1
Associate Professor, Department of Pharmaceutical Analysis, Bhaskar Pharmacy College,
Yenkapally (V), Moinabad (M), R.R. District, Hyderabad-500075.
2
Assistant Professor, Department of Pharmaceutical Analysis, Bhaskar Pharmacy College,
Yenkapally (V), Moinabad (M), R.R. District, Hyderabad-500075.
3
Associate Professor, Department of Pharmaceutical Analysis, Malla Reddy Pharmacy
College, Dhulapally, Maisammaguda, Secunderabad-500100.
4
Principal and Professor, Bhaskar Pharmacy College, Yenkapally (V), Moinabad (M), R.R.
District, Hyderabad-500075.
ABSTRACT
A simple, accurate, rapid and precise isocratic reverse phase high
performance liquid chromatographic method has been developed and
validated for the determination of Dapagliflozin in tablet dosage form.
The chromatographic separation was carried out with a Develosil ODS
HG-5 (C18) 15mm x 4.6 mm, 5µm analytical column, a mixture of
phosphate buffer : acetonitrile in the ratio of 80:20 as mobile phase, at
a flow rate of 1.0 ml/minute maintaining the temperature at 30ºc. UV
detection was performed at 292 nm. The retention time was 3.545
minutes for Dapagliflozin. The method was validated according to ICH
guidelines and the acceptance criteria of results for accuracy, precision,
linearity, robustness, limit of detection, limit of quantification and
ruggedness were met in all cases. The % RSD values for Dapagliflozin
in precision study was found to be 0.86%. The linearity of the
calibration curve for each analyte in the desired concentration range was good (r2>0.999).
The high recovery and value of low relative standard deviation confirm the suitability of the
method for routine evaluation of Dapagliflozin in pharmaceutical dosage forms.
Volume 8, Issue 9, 1156-1165. Research Article ISSN 2277– 7105
Article Received on 06 June 2019,
Revised on 26 June 2019, Accepted on 16 July 2019,
DOI: 10.20959/wjpr20199-15503 *Corresponding Author Narottam Pal Associate Professor, Department of Pharmaceutical Analysis,
Bhaskar Pharmacy College,
Yenkapally (V), Moinabad
(M), R.R. District,
KEYWORDS: Dapagliflozin, HPLC, Method development, validation.
INTRODUCTION
Dapagliflozin[1-6] (DGF)is specifically indicated for the management of type 2 diabetes
mellitus. It is proved to function for improving glycemic control in affected adults when
combined with diet and exercise in optimum level. DGFis known as a sodium-glucose
cotransporter 2 inhibitor. It prevents glucose re-absorption in the kidney. Using DGF
continuously leads to heavy glycosuria which can lead to weight loss and tiredness. This
compound was approved by the USFDA on Jan 08, 2014. Chemically the compound is
known as (1S)-1,5-anhydro-1-C-{4-chloro-3-[(4-ethoxyphenyl)methyl]phenyl}-D-glucitol.
[image:2.595.174.420.311.456.2]Figure 1 represents the chemical structure of Dapagliflozin.
Fig 1: Chemical structure of Dapagliflozin.
Literature survey[7-11] helps us to get motivated and go for the present research work. There
are certain assay methods available for this compound. Deepan Thiyagarajan and Magharla
Dasaratha Dhanaraju developed an HPLC method for the simultaneous determination of
dapagliflozin and saxagliptin in bulk and tablet dosage form, G. V. Mante, A. T. Hemke and
M. J. Umekar developed RP-HPLC method for estimation of dapagliflozin from its tablet.
Anne-Françoise Aubry, Huidong Gu, Reynald Magnier, Ling Morgan, Xiaohui Xu, Mark
Tirmenstein, Bonnie Wang, Yuzhong Deng, Jinnan Cai, Philippe Couerbe and Mark Arnold
developed LC–MS/MS methods for the determination of dapagliflozin, a sodium-glucose
co-transporter 2 inhibitor in normal and ZDF rat plasma. Swapna Goday, Abdul Rahaman Shaik,
Prameelarani Avula developed LC-ESI-MS/MS Based Bioanalytical Method for
Dapagliflozin and Saxagliptin in Human Plasma. Sharmila Donepudi and Suneetha Achanta
validated hplc-uv method. But the extensive use of this compound makes a scope to work
further so that a more simple method will be available for the regular estimation purpose.
MATERIALS AND METHODS
Instruments: HPLC Develosil ODS HG-5 (C18) 15mm x 4.6 mm, 5µm analytical column,
Balance analytical- ER-180A, Sartorius Microbalance-M500P, Thermo scientific pH Meter,
Sar torius sonicator, Empower V 1.2.2.1 Software.
Chemicals: Doubled distilled water, HPLC Grade Water, Methanol, Ethanol, DMSO, DMF,
Sodium phosphate dibasic heptahydrate.
Preparation of mobile phase
Preparation of buffer: Weighed accurately 3.49 gm of Sodium phosphate dibasic
heptahydrate and made a solution of 1 Liter using HPLC grade water. pH was adjusted at 4
using ortho phosphoric acid.
80 parts ofb Buffer and 20 parts of acetonitrile was mixed, subjected for sonication for 30
minutes.
Preparation of working stock solution (1000µg/ml): 10 mg of DGF was weighed and finely
powdered and transferred into 10 ml volumetric flask, diluted up to the mark with 7 ml
mobile phase, sonicated for 30 minutes and made up the final volume with mobile phase.
Preparation of working standard solution: (100µg/ml): From the above stock solution, 1
ml was pipeted out in to a 10ml volumetric flask and then made up to the final volume with
mobile phase to get the concentration of 100 μg/ml DGF and considered it as a standard 100 %. This solution was filtered through 0.45 μm membrane filter.
Label Claim: 10 mg of Dapagliflozin.
Method development
To develop a new method[12-14] for estimation work several trials were conducted so that we
can achieve most suitable chromatographic condition and the best results. The initial attempt
was to use as much low part of organic solvents for the purpose of elution. But increased part
of aqueous solvents in our mobile phase resulted in extending of retention time for all the
plates and all were found to be within the validation limit while using optimized
chromatographic condition.
Methodvalidation
The method was evaluated[15,16] as per protocol designed by ICH. The evaluation parameters
took into consideration were system suitability parameters, precision accuracy, intermediate
precision, linearity, limit of quantification, limit of detection, robustness studies etc.
System suitability parameters: For one analytical method validation system suitability
parameters to be determined by preparing standard solutions of the compounds of specific
concentration and the solutions to be injected six times and the parameters like peak tailing,
theoretical plate count, retention time etc to be determined.
Specificity: Checking of interference if any in the optimized method. We should not find any
interfering peak in blank in this method so that the method can be considered as specific.
Accuracy: The accuracy for a developed HPLC method is to be examined by calculating the
extant of recoveries of all the compounds by a procedure called standard addition. Correct
amount of drug solutions (standard) of that particular project (each drug 50%, 100%, and
150%) to be added and injected to pre-quantified solution of sample. The quantity of each
substance recovered to be determined.
Precision: The experimental repeatability as well as intermediate precision to be examined
by repeatedly applying six injections containing the compounds with specific concentration at
two subsequent days. Number of theoretical plates, retention time, peaks resolution, peak
symmetry etc must be the subject of observation.
Linearity: A series of gradually increased concentration for the entire range of compounds to
be designed to conduct linearity test. To build up calibration curve, concentration and area
should be considered at X and Y axis respectively.
LOD and LOQ: Calculation for Limit of detection as well as Limit of quantification to be
been done by using standard Equations. LOD = 3.3×σ/S, LOQ = 10×σ/S. Here σ denotes for
Robustness: Evaluation for robustness to be conducted by making alteration in different
chromatographic parameters. These parameters included flow rate, temperature, mobile phase
composition etc.
Assay of marketed formulation: Assay of marketed product must be carried by injecting
sample corresponding to equivalent weight into HPLC system, percentage purity to be found
out by the following formula,
RESULTS AND DISCUSSION
Method development: A unique method of assay was innovated by using columns of
different length and make. Mobile phases containing various compositions with different
proportions were tried by taking standard as well as sample in individual. Column or oven
temperature, flow rate, different buffers (salt and acid combination) with slightly varying pH
value and solvents were applied. Whichever the different mobile phases were prepared,
subjected for filtration through membrane filters prior of their use. The mobile phase
containing a mixture of 0.2M phosphate buffer and acetonitrilein the ratio of 80:20 was
[image:5.595.121.465.465.614.2]considered as the best to obtain peaks of DGF at 3.537 minutes.
Figure 2: Optimized chromatogram of Dapagliflozin.
Validation Results
Results of system suitability: The optimized chromatographic procedure as developed
resulted in the elution of DGF at 3.537 minutes. Figure 2 is the representative chromatogram
replicates of standard solution at 50μg/ml for the compound as mentioned respectively. Table
1 narrates about the results of system suitability parameters.
Table 1: Results of system suitability parameters.
Compound Rt(Minutes) Area USPplate count Tailing factor
Dapagliflozin 3.537 3768235 2845 0.95
Results of accuracy studies: Accuracy of the method was well established from the results
of percentage recovery. It was calculated from the amount of compounds recovered by
comparing the peak average areas observed for standard and sample solutions. The
percentage was found in the range of 97.96-100.00% for SBR as given in table 2.
Table 2: Results of Accuracy studies.
% Lavel Amount spiked Amount recovered % Recovery Mean recovery
50%
25 24.88 99.52
98.86% 25 24.72 98.88
25 25.01 100.00
100%
50 49.23 98.46 50 49.00 98.00 50 48.98 97.96
150%
75 74.00 98.66 75 73.75 98.33 75 75.02 100.00 N = 3 for each spiked standard.
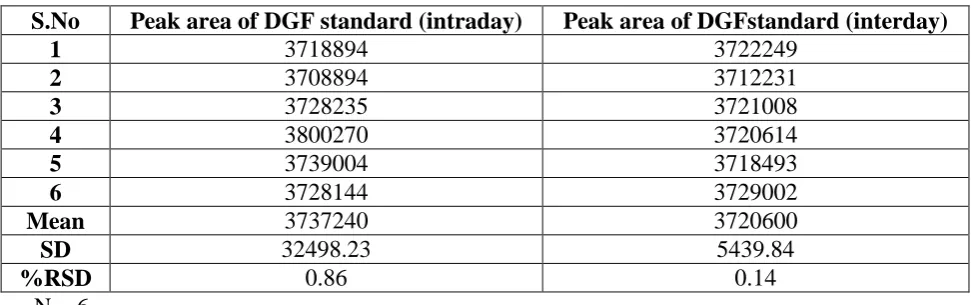
Results of precision studies: The repeatability (intra-day trials) and intermediate precision
(inter-day trials) studies for SBR revealed slight variations in the repetitive trial values (%
[image:6.595.55.541.580.732.2]RSD < 1.5) as narrated in table 3 indicating actual precision of the method.
Table 3: Results of precision studies.
S.No Peak area of DGF standard (intraday) Peak area of DGFstandard (interday)
1 3718894 3722249
2 3708894 3712231
3 3728235 3721008
4 3800270 3720614
5 3739004 3718493
6 3728144 3729002
Mean 3737240 3720600
SD 32498.23 5439.84
%RSD 0.86 0.14
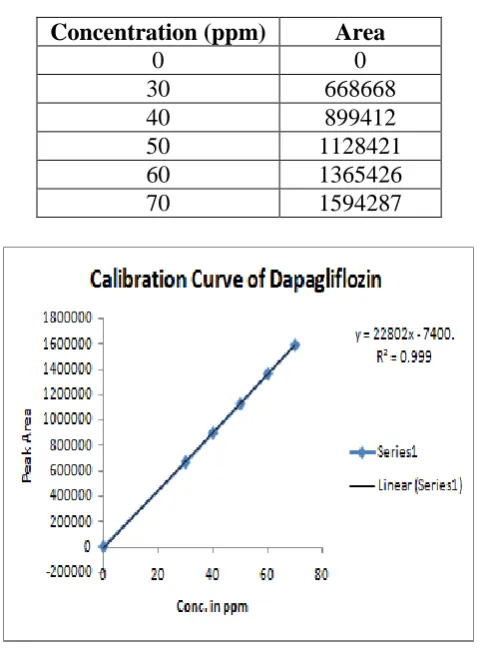
Linearity and regression analysis: Concentration range of 25 μg/ml -150 μg/ml for DGF
was designed for linearity test. Table 4 and table 5, figure 3 explains about appropriateness of
the developed method. Sensitivity of the new method was good enough. With very low
concentration the response in graph was sufficient to read and calculate all the results of
regression analysis. Results of linearity test revealed that the RSD of Y intercept value was
0.27, value of correlation coefficient and SD of slope value 0.36, LOD 0.295µg/ml and LOQ
0.895µg/ml for SBR was respectively.
Table 4: Linearity results.
Concentration (ppm) Area
0 0
[image:7.595.178.420.243.571.2]30 668668 40 899412 50 1128421 60 1365426 70 1594287
Figure 3: Linear plot of Dapagliflozin.
Table 5: Sensitivity and regression analysis.
Parameters Dapagliflozin
Results of robustness studies: This exercise had been done by bringing marginal variation in
certain chromatographic parameters namely increasing and reducing flow rate, variation in
the ratio or proportion of aqueous phase and organic one, temperature status of column etc.
Retention time, plate counts as well as asymmetric or tailing factor etc was obtained with
very marginal variation. All the observed analytical values are given in table 6 as tabular
form.
Table 6: Results of robustness studies.
Dapagliflozin
Chromatographic condition
Retention time
USP plate count
Tailing
factor % Assay
Flowrate1.2ml/min 3.522 2811 0.95 98.46 Flowrate0.8ml/min 3.534 2836 0.95 98.68 Buffer 85 parts 3.540 2852 0.95 97.99 Buffer 75 parts 3.530 2840 0.95 99.82 Temperature(35ºc) 3.531 2838 0.95 99.40 Temperature(25ºc) 3.539 2857 0.95 100.10 Mean 3.532 2839 0.95 99.07 N = 3
Assay of marketed formulation: The formulation (Tablet- Forxiga 10 Astra zenica) was
procured from local medical store. Ten tablets had been chosen, weighed and collected in a
clean and dry mortar. Tablets were triturated into powder form and then collected an
equivalent quantity of 10mg of DGF in a dry volumetric flask (100 ml). Entire quantity of
powder was treated with diluent and then subjected for sonication. The volume was made
with diluent. 5 ml of the solution was pipetted out into a volumetric flask (10 ml) and the volume was made with diluent. 10 μl of resultant solution was injected to the
Chromatographic system and analytical result was studied as compared to that of standard
preparation. Peak area response was taken into consideration. Mean assay value for six
sample trial was found to be 99.46%.
CONCLUSION
The present HPLC method for the determination of sofosbuvir was found to be one of the
least time consuming, simple, highly accurate technique as all the validation results of all
parameters were with very low value of %RSD. At the same time it also proved that the
innovated technique is a precise and robust method. Therefore the above narrated novel
analytical technique is a prefered and suitable one for evaluation of bulk and tablet
ACKNOWLEDGEMENTS
We are very much thankful to Dr. A. Srinivasa Rao, Professor and Principal Bhaskar
Pharmacy College, Hyderabad for his guidance, kind help and constant encouragement at
every step during the progress of this research work. We also express our gratitude to Dr.
V.V. Rao, CEO, and Mr. J.V. Krishna Rao, secretary, J.B. Group of Educational Institution
for providing a healthy working environment which is an essence in research field.
REFERENCES
1. Richard A. Harvey, Pamela C. Champe. Lippincott’s Illustrated Reviews, Pharmacology,
4th edition, 2009; 285.
2. Laurence L Brunton, John S LGZO, Keith L Parker. Goodman and Gilman's The
Pharmacological Basis of therapeutics. 11th ed. New York: McGraw-Hill, 2006; 1619.
3. HP Rang, MM Dale, JM Ritter, RJ Flower. Rang and dale pharmacology. 6th ed.
Churchill Livingstone; 2008; 403.
4. https://www.drugbank.ca/drugs/DB06292.
5. https://www.faaxiga-hcp.com/mechanism-of-action.html.
6. https://www.medilineplus.gov/druginfo/meds/a614015.html.
7. Deepan Thiyagarajan and Magharla Dasaratha Dhanaraju, HPLC method for the
simultaneous determination of dapagliflozin and saxagliptin in bulk and tablet dosage
form. Current Issues in Pharmacy and Medical Sciences, 2018; 31(1): 39-43.
8. G. V. Mante, A. T. Hemke and M. J. Umekar, RP-HPLC Method for Estimation of
Dapagliflozin from its Tablet. International Journal of Chem Tech Research, 2018; 11(1):
242-248.
9. Anne-Françoise Aubry, Huidong Gu, Reynald Magnier, Ling Morgan, Xiaohui Xu, Mark
Tirmenstein, Bonnie Wang, Yuzhong Deng, Jinnan Cai, Philippe Couerbe and Mark
Arnold, Validated LC–MS/MS methods for the determination of dapagliflozin, a
sodium-glucose co-transporter 2 inhibitor in normal and ZDF rat plasma, Bioanalysis, 2010;
2(12): 122-132.
10.Swapna Goday, Abdul Rahaman Shaik, Prameelarani Avula, Development and
Validation of a LC-ESI-MS/MS Based Bioanalytical Method for Dapagliflozin and
Saxagliptin in Human Plasma. Indian Journal of Pharmaceutical Education and Research,
2018; 52(4 [Suppl 2]).
dosage form. International journal of pharmaceutical sciences and research, 2018; 9(12):
5161-5167.
12.Basic Education in Analytical Chemistry. Analytical Science, 2001; 17(1).
13.Willard HH, Merritt LL, Dean JJA, Frank AS. Instrumental method of analysis 1986:
CBS Publishers and Distributors, New Delhi, 7th Edition.
14.Michael E, Schartz IS, Krull. Analytical method development and Validation, 2004;
25-46.
15.Berry RI, Nash AR. Pharmaceutical Process Validation; Analytical method validation,
Marcel Dekker Inc. New work, 1993; 57: 411-28.
16.International Conference on Harmonization of Technical Requirements for Registration
of Pharmaceuticals for Human Use. ICH harmonised tripartite guideline: validation of