Age Group Classification System Using Shape
Features
Dr.Uppu Ravi Babu
Professor, Dept. of Computer Science and Engineering. Narsimha Reddy Engineering College, Secendrabad, TS, India
ABSTRACT: Human Age group classification can automatically done by using facial image analysis. Facial image analysis has lots of applications, such as human computer interaction (HCI), multimedia communication. However, for existing systems it is still a challenging problem to estimate the human age group effectively. An effective and efficient age group classification system is proposed in this paper. The proposed method extract the five shape features i.e. Axis of least inertia, Average bending energy, Eccentricity, Rectangularity, solidity from Center Concentrated Matrix (CCM). The FCCM is generated from each 3×3 sub image. Based on the feature set values the present paper derives a user defined algorithm for classify the facial image into one of the 5 categories i.e., Child-Aged (0-12), Young-Adult(13-25), Middle-Aged (26-40), Senior-Aged(41-60), and senior citizen (>60). The proposed method is also tested by using the Nearest Neighbour Classification algorithm. To prove the efficiency of the proposed method, the proposed method is tested on different facial image databases. The proposed method shows high rate of classification when compared with the other existing methods.
KEYWORDS: Shape features; Age Group Classification; Center Concentrated Matrix; K-NN classifier; facial image
I. INTRODUCTION
Mobile The identification, recognition and classification of human faces are widely used in various fields in which namely, Machine Learning, Computer vision, Human Computer Interaction, Artificial Intelligence, Forensic Sciences etc. there are many challenges in the estimation of the human based on the facial image of the human. The important point for age estimation is that the feature of the human face changes with respect to the time. The main changes observed on the faces are formation of white hair, formation of wrinkles in the fore-head, coagulation of the skin, development of nasal lines, formation of black spots and dark circles under the eyes, etc. The estimation of human age has many applications in the areas of identifying the criminals and missing individual, alcohol selling agencies identifying the age of the buyer, identifying the age of the person when buying cigarettes and so on.
Pattern(LBP) [12] features, Yangetal. [13] Identified a sequence of local features which when combined into a strong classifier performs the task of age classification successfully.
Most of the conventional methods for age estimation are intended for accurate estimation of the actual age. However, it is difficult to accurately estimate an actual age from a face image because facial age progression is subject-dependent. Fortunately, it is not necessary to obtain the precise estimates of the actual age for some applications. Most of the age estimation approaches adopted the regression method to predicate exact age from face image. It is difficult to predicate age by using the limited training samples with discrete age values (sparse, not continuous).
II. RELATED WORK
J SasiKiran et al., [14] Proposed Second order image compressed and fuzzy reduced grey level (SICFRG) model, which reduces the dimensionality of the image and also reduces the grey level range without any loss of important feature information. This method also classifies the facial image into 5 classes and method applied ion only 1502 sample facial images. The average efficiency of proposed method is about 96.12%.
G S N Murthy et al., [15] derived “Transition based Fuzzy LBP” (TFLBP) method for the classification of facial image into five categories such as child, young adults, middle-aged, senior age and Senior citizens. The proposed method is applied on 1602 image and got the efficiency about 96.12%. This method is also classifying the images into five categories.
V V Kumar et al., [16] proposed Topological Texture Features (TTF). Based on the TTF facial image is classified into five categories i.e., child, young adults, middle-aged, senior age and Senior citizens. The authors derived TTF’s on Second Order image Compressed and Fuzzy Reduced Grey level (SICFRG) approach. The proposed method is applied on 1602 image and got the average efficiency about 96.17%.
The main objective of the proposed system is that without using any standard classification algorithms for classifying the human age group. In literature, proposed approaches are used the standard classification system for classifying the human age group so that it will take time for both extraction of the features from human facial image and also for classification system. In some proposed approaches in literature, uses user defined algorithms for classifying the human age group by using human facial image but not used the standard classification algorithm. The main objective of the proposed method is to fit for both the approaches i.e. for user defined and algorithm and also for standard classification algorithms. No such method is available up to now. If correct features are extracted then it is fit for both standard classification and also for user define algorithm. So, the present paper concentrate on this point and develops a method called Shape feature based Age group classification system for classifying the human age group of facial images.
The rest of the papers is organized as follows. In section 2, describes the proposed method and results and derived user defined algorithm are explained in section 3. Finally, conclusion are given in section 4
III.PROPOSED METHODOLOGY
Figure 1: block diagram of the proposed Age-group Classification System
A. Crop the facial image:
The proposed method extract the shape features from skin region of the facial image. Cropping is necessary for eliminating the unnecessary parts of the skin region of facial image such as neck, hair and so on. It is frequently the case that the input image has more information than just the face, so the background and part of the body also appear in the image. Since we will only use facial information we need the image to be fitted to the face due to avoid this extra information than will only affect the system performance. Then convert the cropped facial image into grayscale image. The input image and resultant cropped image is shown in figure 2.
(a) (b)
Figure 2: Image Cropping of facial image. a) Original image b) cropped image
B. Convert RGB to Gray level image:
To extract the shape features from the facial image, first need to convert the input RGB colour image into gray level image. The proposed method utilizes the Weighted RGB conversion method. Generally, the RGB image is composed by 3 dominated colours i.e. Red (R), Green (G) and Blue (B). In Weighted RGB conversion process, different weights are assigned to each colour component and these three components are utilized for converting the colour image into grey level image the conversion process is represented by using the equation (1). The resultant image is shown in figure 3.
( , ) = 0.3∗ ( , ) + 0.59∗ ( , ) + 0.11∗ ( , ) . (1)
Where G is gray value at location (x,y) and R G B are the colour component values and x,y are the pixel positions.
Figure 3: resultant grey level image C. Generate Centre Concentrated Matrix(CCM):
To extract the feature set values from a facial image, we are going to generate the CCM. For generating the CCM the following procedure is adopted. For 3×3 window, the centre pixel value is treated as thresh hold (Th) value. Based on Th value, it’s neighbouring values are changed to either zero(0) or one(1) by using the following equation 2. Repeat the same process for rest of facial image.
( , ) = 0 ( , ) < ℎ
1 ℎ = 1,2,3 . (2) Input Facial
image
Cropped Image
Croppi
ng
Use ThresholdingConvert RGB to Gray level image
Generate CCM
Extract shape Features
Derive the User defined Algorithm
Where Img is the gray level image and x and y are pixel coordinators. The sample conversion of the Grey level matrix to CCM is shown in figure 4.
154 167 163 0 1 0
167 167 162 1 1 0
167 163 163 1 0 0
Figure 4: Grey to CCM conversion procedure (a) 3×3 window gray level values (b) the corresponding CCC matrix values
D. Extract the shape features from CCM
From the generated CCM, the shape features can be extracted. The shape features gives more information about the surface of the face. The present papers uses the shape features only because of continues changes occurs on face when age grows. These changes are identified by using shape features. The shape features used in the present approach is Axis of Least Inertia, Average Bending Energy, Eccentricity, Rectangularity, and Solidity. Based on these shape features, the age group of a person can be calculated.
IV.RESULTS AND DISCUSSIONS
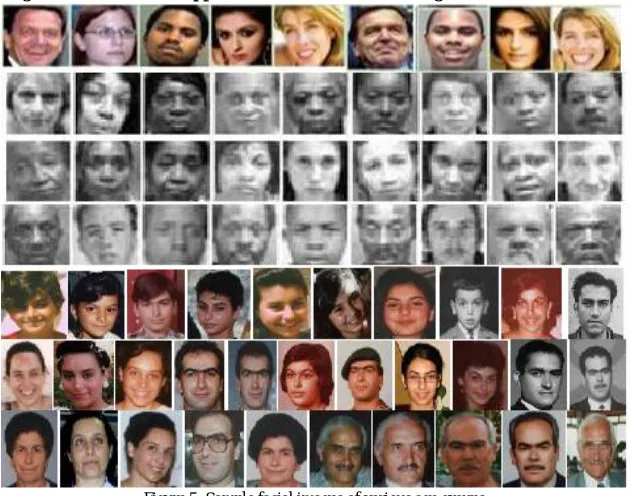
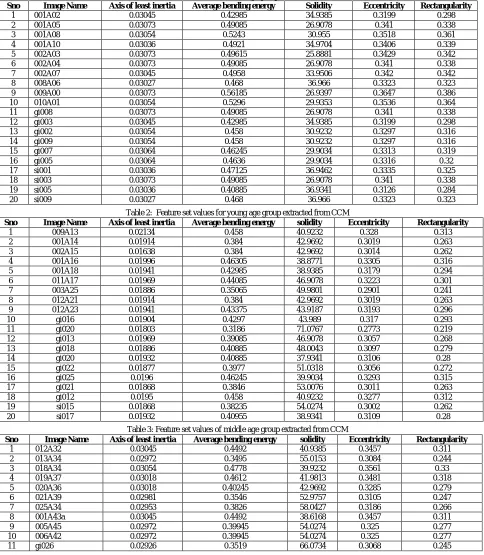
To test the proposed method, among numerous available face databases around the globe, four of them are considered which incorporates huge set of images. The MORPH Database is made out of 17,000 images of about 4,000 people, between 15-68 age of males and females. The second considered database is FG-NET (Face and Gesture Recognition Research Network) ageing database. FG-NET database is made out of 1002 images of more than 80 people, from the ages of 0 - 69 years and 500 images of 50 people from Google database. 600 images gathered from the scanned photos in the age range from 0 to 80. This leads a sum of 19102 example facial images. In the proposed system the test images age group estimate into five age groups of Child (0 to 12years), Young Adult (13-25), middle age group (26 to 40 years) and Senior Aged (41-60 years),senior citizen group(>60). Some of the images from different data bases are shown in figure 5. The feature set values of the each category is listed out in tables from 1 to 5. Based on these feature set values the tested image is classified by using one of the two approaches. The approach uses the standard classification algorithm and second approach uses a user defined algorithm.
Figure 5: Sample facial images of various age groups
A. By using Standard classification Algorithm
MatLab 10.0 platform. 30 percentage of the each database is used for training and reaming 70 percentage images are used for testing purpose i.e. 5730 images are used for training purpose and 13372 images are used for testing purpose. The percentage of classification of the proposed method when NNC is applied is listed out in tables 6.
Table 1 : Feature set values for child age group extracted from CCM
Sno Image Name Axis of least inertia Average bending energy Solidity Eccentricity Rectangularity
1 001A02 0.03045 0.42985 34.9385 0.3199 0.298
2 001A05 0.03073 0.49085 26.9078 0.341 0.338
3 001A08 0.03054 0.5243 30.955 0.3518 0.361
4 001A10 0.03036 0.4921 34.9704 0.3406 0.339
5 002A03 0.03073 0.49615 25.8881 0.3429 0.342
6 002A04 0.03073 0.49085 26.9078 0.341 0.338
7 002A07 0.03045 0.4958 33.9506 0.342 0.342
8 008A06 0.03027 0.468 36.966 0.3323 0.323
9 009A00 0.03073 0.56185 26.9397 0.3647 0.386
10 010A01 0.03054 0.5296 29.9353 0.3536 0.364
11 gi008 0.03073 0.49085 26.9078 0.341 0.338
12 gi003 0.03045 0.42985 34.9385 0.3199 0.298
13 gi002 0.03054 0.458 30.9232 0.3297 0.316
14 gi009 0.03054 0.458 30.9232 0.3297 0.316
15 gi007 0.03064 0.46245 29.9034 0.3313 0.319
16 gi005 0.03064 0.4636 29.9034 0.3316 0.32
17 si001 0.03036 0.47125 36.9462 0.3335 0.325
18 si003 0.03073 0.49085 26.9078 0.341 0.338
19 si005 0.03036 0.40885 36.9341 0.3126 0.284
20 si009 0.03027 0.468 36.966 0.3323 0.323
Table 2: Feature set values for young age group extracted from CCM
Sno Image Name Axis of least inertia Average bending energy solidity Eccentricity Rectangularity
1 009A13 0.02134 0.458 40.9232 0.328 0.313
2 001A14 0.01914 0.384 42.9692 0.3019 0.263
3 002A15 0.01638 0.384 42.9692 0.3014 0.262
4 001A16 0.01996 0.46305 38.8771 0.3305 0.316
5 001A18 0.01941 0.42985 38.9385 0.3179 0.294
6 011A17 0.01969 0.44085 46.9078 0.3223 0.301
7 003A25 0.01886 0.35065 49.9801 0.2901 0.241
8 012A21 0.01914 0.384 42.9692 0.3019 0.263
9 012A23 0.01941 0.43375 43.9187 0.3193 0.296
10 gi016 0.01904 0.4297 43.989 0.317 0.293
11 gi020 0.01803 0.3186 71.0767 0.2773 0.219
12 gi013 0.01969 0.39085 46.9078 0.3057 0.268
13 gi018 0.01886 0.40885 48.0043 0.3097 0.279
14 gi020 0.01932 0.40885 37.9341 0.3106 0.28
15 gi022 0.01877 0.3977 51.0318 0.3056 0.272
16 gi025 0.0196 0.46245 39.9034 0.3293 0.315
17 gi021 0.01868 0.3846 53.0076 0.3011 0.263
18 gi012 0.0195 0.458 40.9232 0.3277 0.312
19 si015 0.01868 0.38235 54.0274 0.3002 0.262
20 si017 0.01932 0.40955 38.9341 0.3109 0.28
Table 3: Feature set values of middle age group extracted from CCM
Sno Image Name Axis of least inertia Average bending energy solidity Eccentricity Rectangularity
1 012A32 0.03045 0.4492 40.9385 0.3457 0.311
2 013A34 0.02972 0.3495 55.0153 0.3084 0.244
3 018A34 0.03054 0.4778 39.9232 0.3561 0.33
4 019A37 0.03018 0.4612 41.9813 0.3481 0.318
5 020A36 0.03018 0.40245 42.9692 0.3285 0.279
6 021A39 0.02981 0.3546 52.9757 0.3105 0.247
7 025A34 0.02953 0.3826 58.0427 0.3186 0.266
8 001A43a 0.03045 0.4492 38.6168 0.3457 0.311
9 005A45 0.02972 0.39945 54.0274 0.325 0.277
10 006A42 0.02972 0.39945 54.0274 0.325 0.277
12 gi028 0.03008 0.3863 45.9648 0.3225 0.268
13 gi040 0.02962 0.3796 57.501 0.3178 0.264
14 gi042 0.02953 0.3826 58.0427 0.3186 0.266
15 gi045 0.03008 0.45765 43.0011 0.3467 0.316
16 si039 0.02962 0.38475 57.0229 0.3196 0.267
17 si045 0.03027 0.4828 38.9857 0.3559 0.333
18 si038 0.02962 0.38475 57.0229 0.3196 0.267
19 si041 0.03091 0.4506 38.2644 0.3486 0.312
20 si035 0.0299 0.4176 50.0123 0.3319 0.289
Table 4: Feature set values of senior age group extracted from CCM
Sno Image Name Axis of least inertia Average bending energy solidity Eccentricity Rectangularity
1 003A51 0.03045 0.4999 38.9385 0.4132 0.344
2 003A57 0.03027 0.4755 38.9539 0.4047 0.382
3 003A58 0.03027 0.5236 39.9736 0.4207 0.36
4 003A59 0.0299 0.4705 50.012 0.402 0.341
5 003A60 0.0299 0.4705 50.012 0.402 0.342
6 004A53 0.0299 0.4705 50.012 0.402 0.354
7 006A54 0.03045 0.5047 38.9187 0.4149 0.347
8 006A55 0.02999 0.4349 46.9846 0.3904 0.351
9 039A50 0.02999 0.4905 45.9967 0.409 0.381
10 003A47 0.03027 0.5341 38.9857 0.4243 0.367
11 003A49 0.03045 0.5666 38.2768 0.4356 0.389
12 004A48 0.02962 0.428 57.0229 0.3772 0.392
13 gi046 0.03054 0.5986 39.9353 0.4466 0.41
14 gi048 0.02999 0.4905 45.9967 0.409 0.383
15 gi050 0.02999 0.4286 47.9725 0.3882 0.342
16 gi052 0.02972 0.4546 53.0076 0.3964 0.341
17 gi055 0.02999 0.4286 47.9725 0.3882 0.357
18 gi041 0.02972 0.4446 53.0076 0.3831 0.367
19 gi052 0.0299 0.4729 48.9922 0.4029 0.362
20 gi055 0.02981 0.4604 52.0197 0.3984 0.381
Table 5: Feature set values of senior citizen group extracted from CCM
Sno Image Name Axis of least inertia Average bending energy solidity Eccentricity Rectangularity
1 006A69 0.02193 0.4921 40.9704 0.3386 0.335
2 003A61 0.0216 0.4927 50.9999 0.3368 0.334
3 004A53 0.02192 0.5055 38.9539 0.3427 0.344
4 004A62 0.02185 0.5076 60.0504 0.3414 0.345
5 004A63 0.0219 0.5174 47.0164 0.3459 0.352
6 005A61 0.02197 0.5409 46.9078 0.3557 0.368
7 006A61 0.02193 0.5421 39.9704 0.3553 0.368
8 006A67 0.0256 0.5009 62.0581 0.3385 0.34
9 004A64 0.02189 0.5505 50.012 0.3567 0.374
10 004A61 0.02193 0.5162 39.2326 0.3465 0.351
11 gi066 0.03 0.4885 45.9967 0.3564 0.337
12 gi068 0.0301 0.5863 45.9648 0.3692 0.402
13 gi065 0.0299 0.5684 49.9801 0.3624 0.39
14 gi062 0.0302 0.5612 41.9813 0.3614 0.385
15 gi065 0.0305 0.5278 40.9232 0.3527 0.363
16 si070 0.0298 0.5596 51.9878 0.369 0.384
17 si068 0.0301 0.5452 43.9571 0.3558 0.374
18 si071 0.0302 0.5112 41.9813 0.3647 0.352
19 si269 0.0303 0.5722 39.9736 0.3655 0.392
20 si066 0.0292 0.485 70.5668 0.3503 0.334
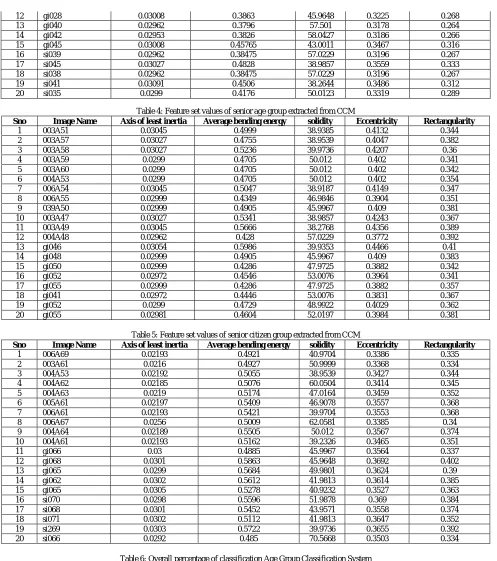
Table 6: Overall percentage of classification Age Group Classification System
Age group Classification Rate Databases
Morph Fg-Net Google Scanned Overall %
Child (0 to 12 Years) 96.55 95.59 96.87 96.13 96.285
Senior Aged (41-60 years) 97.19 96.63 96.37 95.79 96.51
senior citizen (>60 years) 93.83 95.62 96.45 95.91 95.45
Overall % in database 95.85 95.89 96.34 95.99 96.02
B. By using User defined classification Algorithm:
Based on the extracted feature set values, the present paper derives a user defined algorithm called Shape feature based classification algorithm. The input for the proposed algorithm is feature set values and the output of the algorithm is one of the five Age groups, the detailed Shape feature based classification algorithm is shown in Algorithm 1. The classification results proposed method when user defines algorithm is applied is listed out in table 7.
Algorithm 1: Estimation of age group of a person using Shape features START
if Solidity is less than 37 then
print“ Test image age group is Child age (0 to 12years)”
else if Solidity is greater than 37 and Axis of least inertia is less than or equal to 0.02134 then print“ Test image age group is Young Adult age (13 to 25 years) “
else if Rectangularity is less than or equal to 0.333 then
print“ Test image age group is middle age group (26 to 40 years) “ else if Eccentricity is less than 0.37 then
print“ Test image age group is Senior Citizen (> 60 years) “ else if Eccentricity is greater than 0.37 then
print“ Test image age group is Senior Aged group(41-60 years) “ otherwise
print “ unknown age group” END
Table 7: Percentage of classification when User defined algorithm is applied
Age group Classification Rate Databases
Morph Fg-Net Google Scanned Overal %
Child (0 to 12 Years) 96.33 95.12 96.34 96.31 96.025
Young Adult (13-25 years) 94.75 94.83 95.99 96.75 95.58
Middle aged(26 to 40 Years) 96.31 96.36 96.31 96.06 96.26
Senior Aged (41-60 years) 96.96 96.12 95.73 96.17 96.245
senior citizen (>60 years) 94.25 95.07 95.57 96.14 95.2575
Overall % in database 95.72 95.5 95.988 96.29 95.8735
From the above two approaches the NNC technique is show slightly higher rate bur when standard classification applies time complexity is more. When the user defined algorithm applies time complexity is less.
C. Comparison Of The Proposed Method With Other Existing Methods:
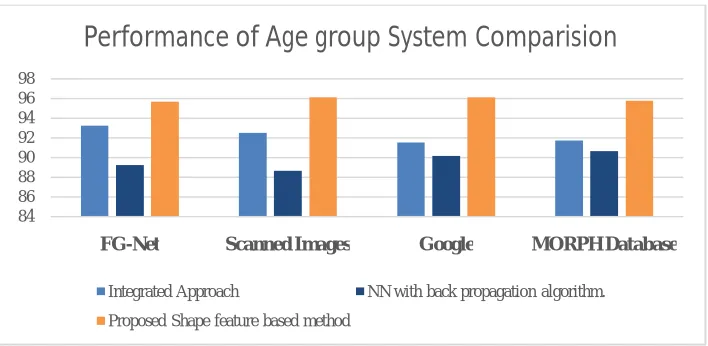
To evaluate the efficiency of the proposed method is compared with other age classification techniques [16,17] and Sneha ( 2012)]. The method proposed by Pullela SVVSR Kumar et.al [16] classifies facial images into four age groups based on integrating the features derived from Grey Level Co-occurrence Matrix (GLCM) with a new structural approach derived from four distinct LBP’s (4-DLBP) on a 3 x 3 image. The age group classification method proposed by Sneha Thakur et.al [17] classifies facial images into five age groups is based on the supervised Neural Network with back propagation algorithm. The classification percentage of proposed method and other existing methods are listed in table 8. The graphical representation of the percentage mean classification ratefor the proposed method and other existing methods are shown in figure 6.
Table 8: Classification rate of the proposed Shape feature based method with other existing methods
Sno Data Base Integrated Approach NN with back propagation
algorithm.
Proposed Shape feature based method
1 FG-Net 93.23 89.25 95.69
2 Scanned Images 92.5 88.65 96.13
3 Google 91.5 90.15 96.16
Figure 6: Comparison Chart of the Age group classification System
From the figure 6, observe that the present method shows highest percentage of classification compare to other existing methods in the literate and related work methods.
V. CONCLUSION AND FUTURE WORK
The proposed method drastically reduced the computational time because of simple procedure is applied for each and every step of the proposed method. The proposed method is tested in two approaches. In the first approach NNC is used for classifying the human age into 5 categories. The overall efficiency of the proposed method is 96.02 when NNC applied. In the second approach derived user defined age group classification algorithm called Shape feature based classification. The overall efficiency of the proposed method in the second approach is 95.87. Innovate of the proposed method is that classification is done in two approaches. Until no such method is available to test the method in two approaches. The overall efficiency of the proposed method is 95.946. The efficiency of the proposed method is highly compared to all other methods and no method has correctly classified the human age into five categories. The proposed method exhibits high average rate of classification when compared to the existing methods.
.
REFERENCES
1. X.Geng, Z.H.Zhou, Y.Zhang, G.Li,H.Dai, “Learning from facial aging patterns for
automaticageestimation”,in:ProceedingsofthefourteenthAnnualACM InternationalConferenceonMultimedia,,pp.307–316, 2006. 2. N.Ramanathan,R.Chellapa,S.Biswas,“Ageprogressioninhumanfaces:a survey”,,J.Vis.Lang.Comput.Vol 15, pp:3349–3361, 2009.
3. Y.H.Kwon,N.D.V.Lobo,“Ageclassification fromfacialimages”,in:Proceedings of
the1994IEEEConferenceonComputerVisionandPatternRecognition, ,pp.762–767. 1994.
4. T.F.Cootes,G.J.Edwards,C.J.Taylor,Activeappearancemodels,IEEETrans. PatternAnal.Mach.Intell)pp: 484–498. 1998
5. A.Lanitis,C.Taylor,T.Cootes,Towardautomaticsimulationofagingeffectson face images,IEEETrans.PatternAnal.Mach.Intell.24(4, PP: 442–455, 2002.
6. A.Lanitis,C.Draganova,C.Christodoulou,“Comparingdifferentclassifiers for automaticageestimation”,IEEETrans.Syst.ManCybern.vol. 34issue :1, pp:621–628. , 2004.
7. Y.Fu,T.Huang,“Humanageestimationwithregressionondiscriminativeaging manifold”, IEEETrans.Multim, vol: 10, issue:4, pp:578–584, 2008.
8. G.Guo,Y.Fu,C.Dyer,T.Huang,“Imagebasedhumanageestimationby manifold
learningandlocallyadjustedrobustregression”,IEEETrans.Image Process, Vol:17, issue:7, pp:1178–1188, 2004.
9. N.Ramanathan,R.Chellappa,,”Modelingageprogressioninyoungfaces”, in:
Proceedingsofthe2006IEEEComputerSocietyConferenceonComputer Vision andPatternRecognition,vol.1.pp.387–394., 2006.
10. S.Yan,H.Wang,X.Tang,T.Huang,“Learningauto-structuredregressorfrom uncertain
nonnegativelabels”,in:ProceedingsoftheEleventhIEEEInternational ConferenceonComputerVision,vol 1,issue 1, pp.1–8,2007
11. S.Yan,H.Wang,T.Huang,Q.Yang,X.Tang,“Rankingwithuncertainlabels”, in:
Proceedingsofthe2007IEEEInternationalConferenceonMultimediaand Expo, ,pp.96–99, 2007.
12. T.Ojala,M.Pietikainen,T.Maenpaa,“Multiresolutiongray-scaleandrotation invarianttextureclassification
withlocalbinarypatterns”,IEEETrans.Pattern Anal. Mach.Intell., vol:24 issue:7,971–987., 2002
13. Z.Yang,H.Ai,“Demographicclassification withlocalbinarypatterns”,in:S.W.Lee,
S.Li(Eds.),AdvanceinBiometrics,LectureNotesinComputerScience,vol. 46 issue:2,2007,pp.464–473, 2007.
14. Jangala. SasiKiran, V. Vijaya Kumar and B. Eswara Reddy “Age Classifications Based on Second Order Image Compressed and Fuzzy
84 86 88 90 92 94 96 98
FG-Net Scanned Images Google MORPH Database
Performance of Age group System Comparision
Integrated Approach NN with back propagation algorithm.
15. GortiSatyanarayanaMurty, Dr. V. Vijaya Kumar, and A. Obulesu, “Age Classification Based On Simple LBP Transitions”, International Journal on Computer Science and Engineering, vol. 5, no. 10, 2013.
16. V. V Kumar, Jangala. S Kiran and V.V. H Chandana, “ An Effective Age Classification Using Topological Features Based on Compressed and Reduced Grey Level Model of the Facial Skin”, I.J. Image, Graphics and Signal Processing(IJIGSP), vol. 6, no. 1, pp. 9-17, 2014. 17. Pullela. SVVSR Kumar, V.Vijaya Kumar and RampayVenkatarao “ Age Classification Based On Integrated Approach” , in I.J. Image,
Graphics and Signal Processing, Volume 7 Pages : 50 – 57 in thear May 2014