ISSN (Print) : 2347 - 6710
International Journal of Innovative Research in Science, Engineering and Technology
An ISO 3297: 2007 Certified Organization Volume 6, Special Issue 4, March 2017
National Conference on Technological Advancements in Civil and Mechanical Engineering – (NCTACME'17)
17th -18th March 2017
Organized by
C. H. Mohammed Koya
KMEA Engineering College, Kerala- 683561, India
Formability Analysis of an Aluminium Based
Alloy Using Finite Element Method
Akhil Remesh 1
Assistant Professor, Department of Mechanical Engineering, KMEA Engineering College, Aluva, India1
ABSTRACT: To examine the formability of an aluminium-based alloy 8011 sheet, Erichsen test is carried out and they are simulated by the axisymmetric finite element method. The effects of sheet thickness and frictional condition between the punch and sheet on formability is predicted and compared with the experimental results of the Erichsen test. The rate independent elasto plastic material is chosen as the material model. By considering the contact problem and applying the nonlinear finite element method, the dome height and stress and strain values for aluminium sheet are computed and compared with the experimental results. The results show that increasing sheet thickness the formability is increased. Also lubricant has shows significant effect on the formability.
I.INTRODUCTION
Sheet metal forming is the process of converting a flat sheet of metal into a part of desired shape without fracture or excessive localized thinning. The process may be simple, such as a bending operation, or a sequence of very complex operations such as those performed in high volume stamping plants. In the manufacture of most large stampings, a sheet metal blank is held on its edges by a blank holder ring and is deformed by means of a punch and die. The movement of the blank into the die cavity is controlled by pressure between the upper and lower parts of the blank holder ring.
II. UNIAXIAL TENSILE TESTING
The most widely used intrinsic test of sheet metal formability is the uniaxial tensile test. The strength of interest may be measured in terms of either the stress necessary to cause appreciable plastic deformation or the maximum stress that the material can withstand. These measures of strength are used, with appropriate caution, in engineering design. Also of interest is the material’s ductility, which is a measure of how much it can be deformed before it fractures. Rarely is ductility incorporated directly in design; rather, it is included in material specifications to ensure quality and toughness. Low ductility in a tensile test often is accompanied by low resistance to fracture under other forms of loading.
III. TEST PROCEDURE
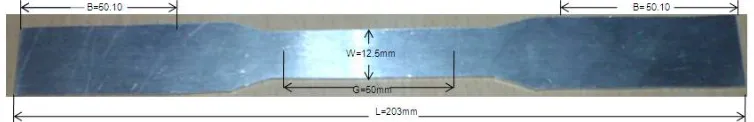
Tensile test specimens were cut from the sheet parallel to the rolling direction and at 450,900 to the rolling direction. Uniaxial tensile test specimens, 50mm gauge length and 12.5mm wide prepared from the sheets at 00, 450 and 900 to the rolling direction. The geometry of the specimen is shown in Fig. 1
Nomenclature
L-Overall length of the specimen,
G-Gauge length of the specimen,
B-Length of grip section,
C- Width of grip section.
IV. THE LOAD–EXTENSION DIAGRAM
The following load extension curve shown in Fig 2 was predicted from the uniaxial tensile test to the rolling direction 00, 450, and 900. The figure indicates elongation is quietly high value compare with other two rolling directions, which means the ductility property is quietly high in the 00 rolling direction. The following figure 3 shows the percentage of elongation is quietly high in the direction of 00 compare with the 450, and 900.
Fig 2. Relationship between tensile load and elongation in uniaxial tension test. Fig.3. Elongation in percentage.
V. THE ENGINEERING STRESS–STRAIN CURVE
Prior to the development of modern data processing systems, it was customary to scale the load–extension diagram by dividing load by the initial cross-sectional area, A0 and the extension by l0, to obtain the engineering stress–strain curve.
Fig.4. Stress-Strain curve
This had the advantage that a curve was obtained which was independent of the initial dimensions of the test piece, but it was still not a true material property curve. During the test, the cross-sectional area will diminish so that the true stress on the material will be greater than the engineering stress. The engineering stress–strain curve is still widely used and a number of properties are derived from it. Figure 4 shows the engineering stress strain curve.
True stress defined as,
(1)
True strain defined as,
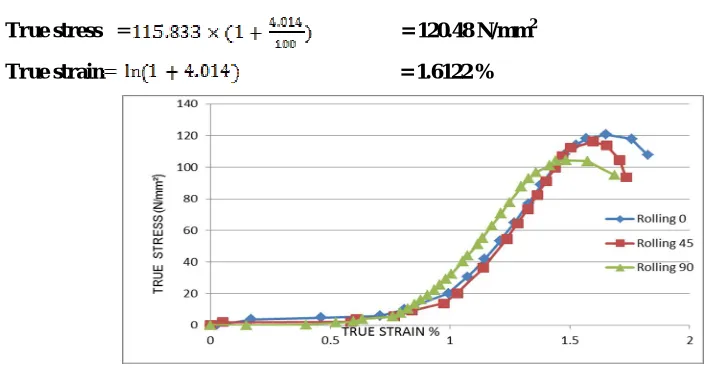
Sample true stress-true strain calculation:
True stress = = 120.48 N/mm2
True strain = 1.6122 %
Fig.5. True stress-True strain curve
Calculation of material properties
Calculation for 00
1) Tensile Strength=Maximum load/initial cross sectional area
Maximum load =2.15KN
Initial cross sectional area =18.75mm2 Tensile Strength = =114.66Mpa
2) Maximum uniform strain =ln ( ) = 0.10
3) True stress at maximum load = = =128.13Mpa
4) Anisotropy factor (r) R= value measured at rolling, transverse and 450
degrees orientations
Table.1. Anisotropic parameter values for three rolling directions
R00 R450 R900 Mean value
1.012 1.0004 1.0041 1.0062
Table 2. Tensile properties of the material calculated from the tensile test.
VI. ERICHSEN CUPPING TEST
Fig 6.specification of the machine Fig.7. Erichsen test: problem layout.
Experimental results
Thickness 1mm
Fig.8. Erichsen cupping index for 1mm thickness Fig.9. Erichsen cupping index for 1.5mm thickness sheet sheet
Thickness 2 mm
Fig.10. Erichsen cupping index for 2mm thickness sheet.
VII. STRAIN MEASUREMENT
After sheet metal is formed the marked circles will deform into ellipses of different sizes. Strain is calculate from the following formula and the major and minor strain diagram
(3)
The following methods are used to measure the deformation axis:
Strain measurement calculation
Major axis length= 4.75mm, Original circle diameter=2.5mm
= 89.6 %
Minor axis length= 2.66mm,
Original circle diameter=2.5mm
=6.4%
Table3. Major & minor strain value
VII. RESULTS AND DISCUSSION
Experimental Results Discussion
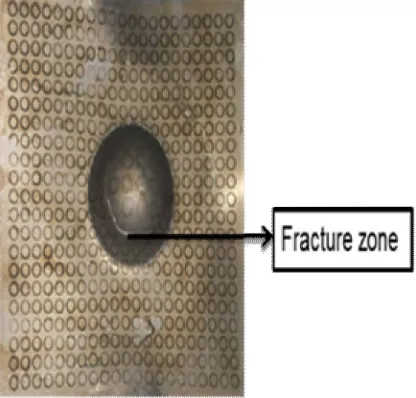
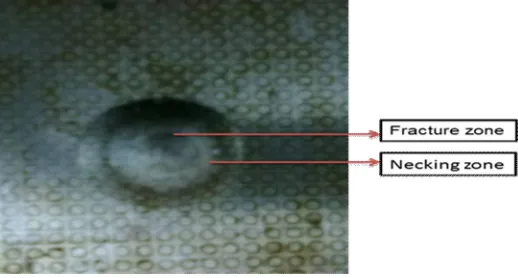
Fig.11 and Fig.12 shows 1mm thickness stretched specimen and corresponding forming limit diagram for dry condition. In this figure 88% major strain and 4.5% minor strain value were predicted. The forming limit diagram shows failure zone and safe zone regions. The major strain values vary ranging from 3.5% to 88% and minor strain values vary ranging from 2.5% to 85%. In this figure the major strain value above 60% indicates fracture zone.
Fig.11. stretched specimen (1mm) for dry Fig.12. FLD for dry and 1mm thick
Experiment test 1: thickness 1mm & Dry condition Erichsen drawing index
(IE):8.32mm
Experiment test 2: thickness 1mm & Grease lubricant Erichsen drawing index (IE):8.56mm
Experiment test 2: thickness 1.5mm & dry condition Erichsen drawing index (IE):10.7mm
Experiment test 3: thickness 2mm & dry condition Erichsen drawing index (IE):12.34
. Experimental test 3: thickness 2mm & grease lubricant Erichsen drawing index (IE):12.49
Results of major and minor strain for thickness 1mm & dry condition
. Results of major and minor strain for thickness 1mm & grease lubricant
Results of major and minor strain for thickness
1.5mm & dry
Results of major and minor strain for
thickness 2mm & dry
Results of major and minor strain for thickness 1mm &
grease Major strain Minor strain Major strain Minor strain Major strain Minor strain Major strain Minor strain Major strain Minor strain
0.075 -0.050 0.175 -0.130 0.250 -0.025 0.125 -0.025 0.100 -0.025
0.125 -0.075 0.200 -0.140 0.500 -0.050 0.175 -0.050 0.175 -0.05
0.175 0.025 0.225 -0.010 0.150 -0.075 0.150 0.025 0.200 -0.025
0.200 0.050 0.150 0.025 0.175 0.025 0.200 0.040 0.225 -0.050
0.225 0.075 0.200 0.050 0.225 0.075 0.225 0.075 0.250 0.050
0.260 0.080 0.225 0.075 0.250 0.100 0.250 0.150 0.275 0.100
0.270 0.100 0.250 0.125 0.275 0.125 0.240 0.150 0.280 0.125
0.275 0.175 0.300 0.150 0.300 0.150 0.225 0.175 0.250 0.125
0.250 0.200 0.275 0.175 0.300 0.175 0.240 0.190 0.225 0.150
Figure 13 and Fig.14 show 1mm thickness stretched specimen and corresponding forming limit diagram for grease condition. In this figure 79% major strain and 4.5% minor strain value were predicted. The forming limit diagram shows failure zone and safe zone regions. The major strain values ranging from 7.5% to 79% and minor strain values vary ranging from 4.5% to 55%. In this figure the major strain value 65% indicates fracture zone.
Fig.13. stretched specimen (1mm) for grease Fig. 14. FLD for grease and 1mm thick
Figure 15 and Fig 16show 1.5mm thickness stretched specimen and corresponding forming limit diagram for dry condition. In this figure 88% major strain and 4.5% minor strain value were predicted. The forming limit diagram shows failure zone and safe zone regions. The major strain values vary ranging from 3.5% to 88% and minor strain values vary ranging from 2.5% to 69%. In this figure the major strain value above 60% indicates fracture zone.
Fig.15. stretched specimen (1.5mm) for dry Fig. 16 FLD for dry and 1.5mm thick
Figure 17 and Fig 18 show 1.5mm thickness stretched specimen and corresponding forming limit diagram for grease condition. In this figure 78% major strain and 3.5% minor strain value were predicted. The forming limit diagram shows failure zone and safe zone regions. The major strain values ranging from 2.5% to 78% and minor strain values vary ranging from 3.5% to 55%. In this figure the major strain value 60% indicates fracture zone. In this FLD shows small number of failure points compare with dry condition which means can reduce fracture region when using lubrication. In this study lubricant shows significant effect on the formability.
Fig.17. stretched specimen (1.5mm) for grease Fig. 18. FLD for grease and 1.5mm thick
Fig.19. stretched specimen (2mm) for dry Fig. 20. FLD for dry and 2mm thick
Fig.21 and Fig.22 show 2mm thickness stretched specimen and corresponding forming limit diagram for grease condition. In this figure 77% major strain and 6.5% minor strain value were predicted. The forming limit diagram shows failure zone and safe zone regions. The major strain values vary ranging from 6 to 77% and minor strain values vary ranging from 4.5% to 55%. In this figure the major strain value 65% indicates fracture zone.
Fig.21. stretched specimen (2mm) for grease Fig. 22. FLD for grease and 2mm thick
Simulation results
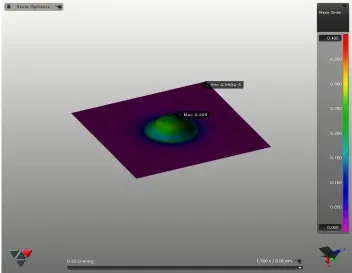
Fig.23 Formability of aluminum sheet (1mm) thick in dry condition
Erichsen index=8.32mm
Fig 25 FLD for dry and 1mm thick
Fig.27 Minor strain of Aluminium sheet for dry and 1mm thick
As the contour show,the stress is monotonically raised from the die rim to the pole and accordingly the strain is increased towards the pole.Figure.24 exhibits the experimentally stretched specimen and Fig 25 shows the simulated result. As can be seen,the failure has occurred in the vicnity of the pole.The punch displacement was measured as the 8.9mm.The erichsen index was measured as the 8.32mm.It is observed that a good correlation exist between the experiment and fem results. The predicted strain and stress contour also indicates that the minimum of thickness and the maximum of stress have occurred in this region.
The contour of Major and minor strain of the aluminum sheet(thick1mm) in grease condition are shown in fig. 26 and 27. respectively.
Erichsen index=8.56mm
Fig.28. stretched specimen (1mm) for grease Fig 29 FLD for grease and 1mm thick
Fig.30 Major strain of Aluminium sheet for grease and 1mm thick
Fig.31 Minor strain of Aluminium sheet for grease and 1mm thick
The contour of major and minor strain of the aluminum sheet(thick1.5mm) in dry condition are shown in fig. 35 and 36 respectively.
Erichsen index=10.7mm
Fig.32 stretched specimen (1.5mm) for dry condition Fig 33 FLD for dry and 1.5 mm thick
Fig 34 formability of Aluminium sheet 1.5 mm without lubricant
Fig 36 Minor strain of Aluminium sheet for dry and 1.5mm thick
The contour of major and minor strain of the aluminum sheet(thick2mm) in dry condition are shown in fig. 40 and 41 respectively.As the contour show,the stress is monotonically raised from the die rim to the pole and accordingly the strain is increased towards the pole.Figure.37.exhibits the experimentally stretched specimen.Fig 38 shows the FLD of aluminium sheet with thick 2mm without lubricant. As can be seen,the failure has occurred in the vicnity of the pole.The punch displacement was measured as the 12.80mm.The erichsen index was measured as the 12.34mm.It is observed that a good correlation exist between the experiment and fem results. The predicted strain and stress contour also indicates that the minimum of thickness and the maximum of stress have occurred in this region.
Erichsen index=12.34mm Fig 38 FLD for dry and2mmthick
Fig 39 formability of Aluminium sheet 2mm thick without lubricant
Fig 41 Minor strain of Aluminium sheet for dry and 2mm thick
The major and minor strain of the aluminum sheet(thick2mm) in grease condition are shown in fig. 45 and 46 respectively.
As the contour show,the stress is monotonically raised from the die rim to the pole and accordingly the strain is increased towards the pole.Figure.42 exhibits the experimentally stretched specimenand fig.43 shows the FLD of Al sheet for grease condition with 2 mm thickness.As can be seen,the failure has occurred in the vicnity of the pole.The punch displacement was measured as the 13mm.The erichsen index was measured as the 12.49mm.It is observed that a good correlation exist between the experiment and fem results. Thesevalues are indicaicates can quitely increase the formability when using lubricant. The predicted strain and stress contour also indicates that the minimum of thickness and the maximum of stress have occurred in this region. This figure also indicates minimum of stress value occurred in the vicnity of the pole compare with dry condition. At the same time the frcture region is reduced when increasing sheet thickness with lubricant condition.
Fig.8.32. stretched
Erichsen index=12.49mm
Fig 44 formability of Aluminium sheet 2mm thick with lubricant
Fig 46 Minor strain of Aluminium sheet for grease 2mm thick
IX. CONCLUSIONS
In this study, the formabilityof aluminum based alloy 8011 sheet in fundamental forming process has been analyzed by the axisymmetric elastic-plastic finite element method. Calculations have been carried out for the Erichsen test, and the results have been compared with a experimental observations.
From the above analysis, the following conclusions can be drawn:
1. The strain distribution and limit dome height show excellent agreement with experimental data.
2. The formability is increased with increasing sheet thickness.
The lubricants used in this work showed a significant effect on formability.
REFERENCES
[1]Claudio Garc, Diego Celentano, Fernando Flores, Jean-Philippe Ponthot, Omar Oliva (2006),‘Numerical modelling and experimental validation of steel deep drawing processes’, Journal of Materials Processing Technology vol.172 pp.461–471
[2] Mustafa YASAR and Ibrahim KADI (2007), ‘High Velocity Forming of Aluminum Cylindrical Cups-Experiments and Numerical Simulations’ Journel of Material Science and Technology,Vol.23 No.2,
[3] Z.Marciniak, J.L.Duncan,S.J.Hu(2005).,Mechanics Of Metal Forming, Elsevier publications’
[4]You-Min Huanga, Yi-Wei Tsai, Ching-Lun Li (2008), ‘Analysis of forming limits in metal forming processes’, Journal of materials processing technology vol.2 0 1 .
[5]Tung-Sheng Yang, Tze-Chi Hsu(2001), ‘Forming limit analysis of hemisphercal-Punch stretch forming’, Journal of material Processing Technology, vol.117 pp.32- 36.
[6]D. Ghaffari Tari M. J. Worswick J. Mckinley R. Bagheriasl(2010), ‘AZ31 magnesium deep drawing experiments and finite element simulation’, International journel of material forming vol.3 pp.159 – 162
[7] R.H.Wagoner,J.L.Chenot(1996), Fundamentals of Metal Forming, John Wiley&sonsInc.
[8] Kin,J.J. Park(2002),‘Effect of Process Parameters on Formability in Incremental Forming of Sheet metal’, Journal of material Processing Technology,pp.130-131.
[9]O.-G. Lademo, K.O. Pedersen, T. Berstad, T. Furu, O.S. Hopperstad(2008), ‘An experimental and numerical study on the formability of textured AlZnMg alloys’,European Journal of Mechanics A/Solids, vol.27 pp.116–140.