1821
High-b-value Diffusion-weighted MR Imaging of
Suspected Brain Infarction
Joel R. Meyer, Arturo Gutierrez, Bryan Mock, Delon Hebron, Jordan M. Prager, Michael T. Gorey, and Daniel Homer
BACKGROUND AND PURPOSE: Recent technological advances in MR instrumentation al-low acquisition of whole-brain diffusion-weighted MR scans to be obtained with b values great-er than 1000. Our purpose was to detgreat-ermine whethgreat-er high-b-value diffusion-weighted MR imaging improved contrast and detection of signal changes in acute and chronic brain infarction.
METHODS: We prospectively evaluated the MR scans of 30 subjects with a history of pos-sible brain infarction on a 1.5-T MR imager with 40 mT/meter gradients (slew rate 150 T/m/ s) by use of the following single-shot echo-planar diffusion-weighted MR sequences: 1) 7999/ 71.4/1 (TR/TE/excitations, b5 1000; 2) 999/ 88.1/3, b5 2500; and 3) 7999/ 92.1/4, b53000. Diffusion-weighted MR imaging was performed in three orthogonal directions during all se-quences. All subjects were scanned with fast fluid-attenuated inversion recovery (FLAIR) (10,006/145/2200/1 [TR/TE/TI/excitations]) and fast spin-echo T2-weighted (3650/95/3 [TR/TE/ excitations], echo train length, 8). The diagnosis of brain infarction was established by clinical criteria.
RESULTS: Twenty women and 10 men with a mean age of 67.7 years were enrolled in the study. One subject was excluded owing to poor image quality. Twelve of 29 subjects had a clinical diagnosis of acute infarction. All 12 had lesions that were hyperintense on diffusion-weighted images at all three b values; five were cortical and seven subcortical. There was increased contrast of all lesions on high-b-value scans (b52500 and 3000). Lesions that were hypointense on diffusion-weighted images were identified and evaluated at the three different b values. At b5 1000, there were 19 hypointense lesions, whereas at b52500 and 3000 there were 48 and 55 lesions, respectively. On FLAIR and T2-weighted images, these low-signal lesions were predominantly chronic, subcortical, ischemic lesions and lacunar infarcts, but four chronic cortical infarcts, one porencephalic cyst, and one primary brain tumor were also found. Low-signal lesions were also noted to have increased contrast on high-b-value diffusion-weight-ed scans.
CONCLUSION: High-b-value diffusion-weighted MR imaging (b5 2500 or b 53000) had no impact on diagnosis of acute infarction. High-b-value diffusion-weighted MR imaging (b5 2500) combined with diffusion-weighted MR imaging at b 5 1000 improves tissue character-ization by increasing the spectrum of observed imaging abnormalities in patients with suspected brain infarction.
Diffusion-weighted MR imaging has been shown to be highly sensitive for the diagnosis of cerebral infarction (1). Areas of cerebral infarction have
de-Received April 22, 1999; accepted after revision May 10, 2000. From the Departments of Radiology (J.R.M., A.G., D.H., J.M.P., M.T.G.) and Neurology (J.R.M., D.H.), Northwestern University Medical School, Evanston, IL, and GE Medical Systems (B.M.), Milwaukee, WI.
Address reprint requests to Joel R. Meyer, M.D., Department of Radiology, Evanston Northwestern Healthcare, 2650 Ridge Ave., Evanston, IL 60201.
qAmerican Society of Neuroradiology
AJNR: 21, November/December 2000 1822 MEYER
TABLE 1: Hyperintense lesions
b1000 b2500 b3000
# subjects # lesions
Avg contrast ratio* Standard deviation
12 16
0.33 0.10
12 16
0.51U¨ 0.10
12 16
0.56a´ 0.11
* Ratio defined as (SII 2 SIII)/(SII 1 SIII)—see methods for explanation.
[image:2.612.46.275.216.289.2]U¨ denotes statistical significance (a ,0.001). a´ denotes statistical significance (a ,0.001).
TABLE 2: Mean ADC of acute infarcts and normal tissue
b Value
Mean ADC Infarct (31024)
Mean ADC Contralateral
NL(31024)
1000 2500 3000
4.461.3 3.361.2 3.060.9
9.061.2 6.760.7 6.160.83
TABLE 3: Hypointense lesions
b1000 b2500 b3000
Total number of lesions
Avg number/subject Standard deviation Avg contrast ratio* Standard deviation
19 0.66 1.11
20.17 0.20
48 1.67U¨ 2.09
20.40# 0.19
55 1.90a´ 2.12
20.39` 0.17
Note.—Ratio defined as (SII2SIII)/(SII1SIII), U¨ Statistical sig-nificance (a 50.03), a´ Statistical significance (a 50.01).
# Statistical significance (a 50.03),`Statistical significance (a 5 0.02).
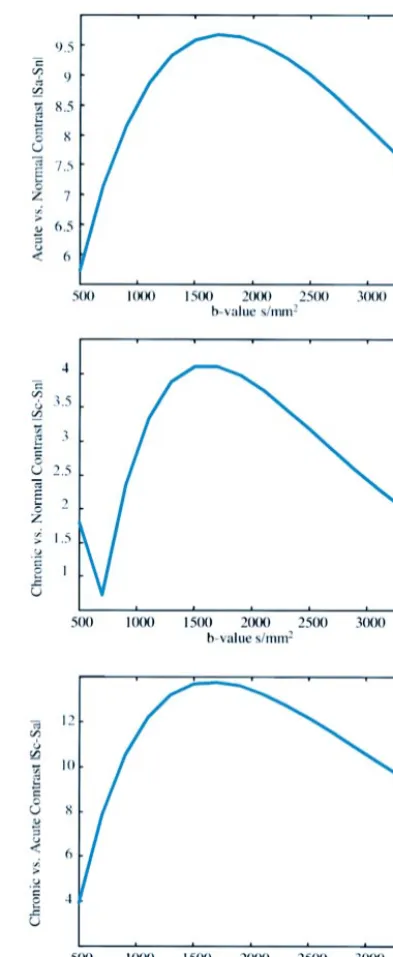
FIG 1. The signal intensity difference between three tissue
types (normal gray matter tissue [assumed ADC50.8310–3
mm2/s, T25100 ms], acute ischemic tissue [decreased ADC5
0.4310–3mm2/s, T25100 ms], and chronic lesions [elevated
ADC51.331023mm2/s, elevated T25100 ms]) plotted as a
function of the b value. In addition to the ADC and T2 assump-tions for each tissue, the tissue T1s were assumed to be equal (1000 ms) and significantly smaller than the imaging TR (10 s) such that T1 effects could be ignored.
A, The signal difference in normal gray matter tissue and acute lesion is shown.
B, Normal tissue signal is compared with chronic lesion signal, assuming the T2 and ADC are elevated in the chronic lesion.
C, The relative signal difference between acute and chronic lesion signal is demonstrated. In each case, the contrast reaches a maximum in the b-value range of 1500–2000 s/mm2. Note,
however, that the largest contrast is seen inC (acute vs chronic), suggesting that higher b values may be beneficial in delineating chronically infarcted versus acutely ischemic regions.
12 hours of onset of acute infarction (6–7), diffu-sion-weighted scans may be positive within min-utes of onset in several animal models of infarction (8–11), and is more sensitive than is conventional MR imaging pulse sequences for early detection of cerebral infarction in humans (1, 12–19). Investi-gators have shown increased sensitivity of diffu-sion-weighted imaging for detection of hyperacute infarction within the first 6 hours of onset (1, 17); others have shown diffusion-weighted imaging to be valuable in detecting the subacute and chronic stages of infarction (16, 18–20).
With enhanced gradients, echo-planar diffusion-weighted imaging is rapidly becoming a standard for imaging brain infarction. Multislice whole-brain diffusion-weighted examinations can be ob-tained in three orthogonal planes within seconds (13). The degree of diffusion weighting of these scans correlates with the strength of the diffusion gradients applied during the acquisition. Diffusion-weighted scans are characterized by the b value (in s/mm2), which is a function of diffusion gradient
[image:2.612.47.275.327.407.2]FIG2. Trace image of hyperacute infarct in an 89-year-old woman scanned 6 hours after developing right-sided weakness and aphasia. A, Diffusion-weighted image (b51000 s/mm2) demonstrates a high-signal area consistent with acute infarct in the left basal ganglia
and posterior limb of the internal capsule.
B, Diffusion-weighted image (b52500 s/mm2) demonstrates the increased contrast of the high-signal lesion.
C, Diffusion-weighted image (b53000 s/mm2) also demonstrates this lesion more clearly than at b51000; anisotropic effects are
evident in the posterior periventricular regions.
FIG3. Acute infarct in an 82-year-old man scanned at 22 hours.
A, Diffusion-weighted image with b51000 s/mm2demonstrates a high-signal area consistent with acute infarct in the right basal
ganglia along the posterior lenticular nucleus. The posterior horns of the lateral ventricles are prominent. B, Diffusion-weighted image at b52500 s/mm2demonstrates the high-signal lesion with greater contrast.
C, Diffusion-weighted image at b53000 s/mm2also demonstrates this lesion more clearly than at b51000; anisotropic effects are
evident in the contralateral internal capsule and corona radiata.
of brain infarction have routinely used higher gra-dient strengths (up to 60 mT/M) to generate b val-ues of 1400–1800 (8–9, 22–24), with one reporting a b value of 3580 (25). Most prior diffusion-weighted imaging studies of human brain infarction have been performed with b values of 1000 or less (21–26), although one reported a b value of 1463 (13). The purpose of this study was to determine the role of high-b-value (b 5 2500 or 3000) dif-fusion-weighted imaging for lesion detection in acute and chronic brain infarction.
Methods
AJNR: 21, November/December 2000 1824 MEYER
FIG4. Acute infarct in a 94-year-old woman scanned 12 hours after developing left-sided hemiparesis.
A, Diffusion-weighted image with b51000 s/mm2demonstrates a high-signal area consistent with acute infarct in the right parietal
lobe.
B, Diffusion-weighted image at b52500 s/mm2demonstrates the high-signal lesion with greater contrast.
C, Diffusion-weighted image at b53000 s/mm2also demonstrates this high-signal lesion more clearly than at b51000.
FIG5. Transient ischemic attack and chronic infarct in a 90-year-old woman with a remote history of cerebral infarct, scanned 2 hours after developing right-sided weakness and left-sided facial droop. Her symptoms resolved spontaneously within 11 hours.
A, Diffusion-weighted image with b51000 s/mm2negative for acute infarcts, though a low-signal area of increased diffusion, consistent
with chronic infarct, is noted in the right occipital lobe.
B, Diffusion-weighted image at b52500 s/mm2demonstrates the low-signal lesion with greater contrast.
C, Diffusion-weighted image at b53000 s/mm2also demonstrates this lesion more clearly than at b51000.
3000/2 min 8 s. Diffusion- weighted MR imaging was per-formed in three orthogonal directions during all sequences. All subjects were also scanned with fast fluid-attenuated inversion recovery (10,006/145/ 2200/1 [TR/TE/TI/excitations]) and fast spin-echo T2-weighted (3650/95/3 [TR/TE/excitations], echo train length, 8) sequences. One patient underwent proton spec-troscopy and stereotactic biopsy to confirm diagnosis of pri-mary brain tumor. The clinical diagnosis of stroke and onset of symptoms was established by clinical criteria.
Trace images using the information from the three orthog-onal images were photographed and reviewed by two experi-enced neuroradiologists in concert and by consensus. Quali-tative review included detection of low- and high-signal lesions on diffusion-weighted images at different b values. The number of lesions noted at different b values was tabulated.
Quantitative review involved calculating contrast ratios of le-sions relative to background at the three b values. To quantify the contrast of lesions at different b values, a contrast ratio was defined as SII-SIII/ SII1SIII, where SII 5 signal intensity at the lesion (hypo- or hyper intense), SIII5 signal intensity at normal brain, and signal intensity/contrast was measured at an MR workstation by use of standard software (Fig 1)
This contrast ratio, which is defined as the relative signal intensity difference in an image between two adjacent struc-tures, was compared across identically sliced images at differ-ent b values to determine lesion contrast at differdiffer-ent b values (27). A two-sided Student’s t test was used to determine sig-nificance at .05.
FIG6. Acute and chronic infarcts.
A, Diffusion-weighted image with b51000 s/mm2demonstrates a high-signal lesion,
consistent with acute infarct in the left corona radiata, and a low-signal area in the right periventricular white matter (arrow), consistent with a chronic infarct. A second low-signal lesion is seen anterior to the high-signal area in the left subcortical white matter.
B, Diffusion-weighted image at b52500 s/mm2shows increased contrast of the
high-signal and two low-high-signal lesions.
C, Diffusion-weighted image at b53000 s/mm2also demonstrates the high- and
low-signal areas more conspicuously than at b51000.
D, FLAIR image demonstrating the encephalomalacia and reactive gliosis associated with the two chronic strokes seen as low-signal lesions on a diffusion-weighted image, and increased signal in the lesion seen as high signal on a diffusion-weighted image.
can improve contrast-to-noise ratio between high-signal le-sions, regions of decreased diffusion, and surrounding tissue. Given two tissues, S0and S1, the contrast-to-noise ratio is giv-en by:
zS12S0z
CNR5 (1)
s
where
2(TE/T2 )0 S05S · e
(2(TR2TE/2)/T1 )0 2TR/T10 2bD0
3(122 · e 1e ) · e and
(2TE/T2 )1 S15S · e
(2(TR2TE/2)/T1 )1 2TR/T11 2bD1
3(122 · e 1e ) · e .
[image:5.612.63.538.60.429.2]Because the noise of MR imaging is proportional to the total data acquisition time, maximizing the contrast to noise in dif-fusion-weighted imaging amounts to maximizing the absolute signal differencezS12S0z.
Figure 1 demonstrates the change in signal zS1 2 S0z be-tween three tissue types: a) normal gray matter tissue (assumed apparent diffusion coefficient [ADC] 5 0.8 3 10–3 mm2/s, T2 5100 ms), b) acute ischemic tissue (decreased ADC 5 0.4 3 10–3 mm2/s, T2 5 100 ms), and c) chronic lesions (elevated ADC51.3310–3 mm2/s, elevated T25150 ms) as a function of the b value. In addition to the ADC and T2 assumptions for each tissue, the tissue T1s were assumed to be equal (1000 ms) and significantly smaller than the imaging
TRs (10 s) such that T1 effects could be ignored. In Figure 1A, the contrast between normal tissue and acute lesion signal is plotted. In Figure 1B, normal tissue signal is compared with chronic lesion signal, assuming the T2 and ADC are elevated in the chronic lesion. In Figure 1C, the relative signal differ-ence between acute and chronic lesion signal is shown. In each case, the contrast reaches a maximum in the b-value range of 1500–2000 s/mm2. Note, however, that the largest difference is seen in Figure 1C (acute vs chronic), suggesting that higher b values may be beneficial in delineating chronically infarcted versus acutely ischemic regions.
ADC calculations were performed on all subjects with acute infarcts at each b value. ADC measurements were also derived from contralateral normal brain at each b value. Mean ADCs were calculated and compared.
Results
[image:5.612.58.281.500.612.2]AJNR: 21, November/December 2000 1826 MEYER
A clinical diagnosis of acute infarction was es-tablished in 12 of 29 subjects. All 12 had hyper-intense lesions on diffusion-weighted images at all three b values, five of which were cortical and sev-en subcortical, including a hemorrhagic lacunar in-farct with mixed signal on the diffusion-weighted image. No subject had a recent infarction involving the brain stem. All high-signal lesions on diffusion-weighted images showed improved lesion contrast at higher b values (Figs 2 and 3). The average con-trast ratios for hyperintense lesions are summarized in Table 1.
One additional subject had a hyperintense lesion on diffusion-weighted images at all b values, with a clinical diagnosis of transient ischemic attack. This appeared as a mixed-signal lesion with central low signal and peripheral high signal. A diffusion-weighted study performed 5 weeks prior to the high-b-value examination confirmed that this lesion was an evolving infarct rather than an acute event. Mean ADC values for acute infarcts and contra-lateral normal brain are presented in Table 2.
Low-signal lesions were predominantly subcor-tical ischemic and lacunar infarcts, but three chron-ic cortchron-ical infarcts, one 5-week-old evolving in-farct, one porencephalic cyst, and one primary brain tumor were found. Qualitatively, the low-sig-nal lesions were more conspicuous at higher b val-ues (Figs 4–7), leading to a greater number of le-sions recorded at higher b values: 19 at b51000, 48 at b52500, and 55 at b5 3000. The contrast ratios of low-signal-intensity lesions are summa-rized in Table 3. In one subject, a large area of low signal was demonstrated at b5 2500/3000, which was not shown at b 5 1000. This subject under-went MR spectroscopy and subsequent stereotactic brain biopsy, confirming the diagnosis of oligoas-trocytoma (Fig 7).
Discussion
Diffusion-weighted MR imaging has dramatical-ly improved our ability to diagnose cerebral infarc-tion. Whereas conventional MR images may be normal within the first 8 to 12 hours, diffusion-weighted MR images may be positive minutes after onset of infarction (8–11). Clinical experience with diffusion-weighted imaging within the first 6 hours of infarction revealed a sensitivity of 94% and specificity of 100% for diagnosis of acute infarc-tion (1). Other investigators have shown the im-portance of diffusion-weighted scans in the diag-nosis of subacute and chronic infarction (16). Although early investigators used spin-echo and navigated spin-echo techniques to obtain diffusion-weighted scans, with the improvement of MR gra-dient technology, echo-planar imaging is rapidly becoming the standard for rapid whole-brain dif-fusion-weighted imaging. More recently, whole-brain diffusion-weighted scans with b values up to 3000 can be acquired, without requiring a signifi-cantly longer gradient duration or gradient interval,
thereby eliminating the need for prolonged echo times.
Prior diffusion-weighted imaging studies have used b values ranging from 500 to 1463. One study indicated that higher b values (b51463) improved the sensitivity of diffusion-weighted imaging for detection of the smallest areas of infarction (13). Our study extends this work by assessing the utility of high b values in brain infarction. Whereas prior studies focused on the evaluation of high-signal-intensity lesions associated with acute infarction, our study evaluated both high- and low-signal-in-tensity lesions (areas of decreased and increased diffusion). Our study showed a statistically signif-icant increase in the contrast ratio of high-signal-intensity lesions at b 52500 and b53000 versus b 5 1000. Although no additional lesions were documented at higher b values, the increased con-spicuity of these lesions suggests that high-b-value diffusion-weighted imaging may facilitate interpre-tation of acute infarction, particularly with smaller lesions, as others have suggested. Comparing b 5 2500 to b 5 3000, there was no significant im-provement in the contrast ratios. Furthermore, at b 5 3000, the decrease in signal to noise required additional signal averages, which prolonged the ex-amination time by approximately 90 seconds.
ADC calculations were consistent with the im-proved contrast ratios of high signal lesions on dif-fusion-weighted images at different b values. At higher b values, the observed ADCs were lower for both contralateral normal tissue as well as areas of acute infarction. Other investigators confirm the observation that the relationship between ADC and b-value changes with increasing b values (personal communication, Gregory A. Sorenson). The ADC measurements performed on our data were two-point ADC measurements between no diffusion weighting (T2 image, b value 5 0) and the diffu-sion-weighted image. Because two-point ADC measurements represent a single aggregate diffu-sion value within a region, such measurements can-not accurately represent differences in diffusion from different compartments. The combination of MR imaging’s partial volume effects and the re-cently observed multiexponential behavior of dif-fusion attributed to extracellular (fast difdif-fusion) and intracellular (slow diffusion) compartments (28), might render two-point ADC calculations inappro-priate when combined with high-b-value imaging. Nevertheless, high-b-value diffusion-weighted im-aging improves the gray-white matter differentia-tion on ADC maps and may improve the visual assessment of areas of decreased diffusion.
FIG7. Primary brain tumor in a 72-year-old woman scanned 30 hours after developing
aphasia and slurred speech.
A, Diffusion-weighted image with b51000 s/mm2is negative for acute infarcts, but
an isointense irregularity of the cortical sulci is noted along the left sylvian fissure. B, Diffusion-weighted image at b52500 s/mm2demonstrates a large low-signal lesion
along the left sylvan fissure and in white matter posterior to the posterior horns of the lateral ventricles, representing increased diffusion that was not appreciated at b51000. C, Diffusion-weighted image at b53000 s/mm2also demonstrates these low-signal
lesions not seen at b51000.
D, Fast spin-echo T2-weighted image reveals a high signal along the left sylvian fissure and posterior to the posterior lateral ventricles, corresponding to the low-signal lesions seen on the diffusion-weighted images at b52500 and b53000. Stereotactic biopsy confirmed the large lesion to be an oligostrocytoma.
limited. This may in part relate to so-called T2 shine-through effect, which may cancel low signal from chronic infarcts with increased diffusion. (20, 21). We hypothesize that more heavily diffusion-weighted images are less sensitive to T2 signal al-terations (T2 shine-through), thereby improving imaging of chronic infarcts as well as entities with increased diffusion such as cysts, brain tumors, and brain edema. Our case of a primary brain tumor, which only demonstrated low signal at higher b values, illustrates the potential value of this tech-nique (Fig 7). Others have shown that diffusion-weighted imaging with b values less than 1000 s/mm can distinguish areas of nonenhancing tumor from areas of peritumoral edema, both of which appear nonenhancing on T1- and bright on T2-weighted images of gliomas (29). This study also suggested advantages of diffusion-weighted imaging with b 5 777 over b 5 215. Others have demonstrated the utility of diffusion-weighted imaging in differ-entiating extraaxial cysts from epidermoid tumors (30) and differentiating brain cystic abscesses filled with paramagnetic protein from solid masses (31). High-b-value diffusion-weighted images, therefore, offer a potentially valuable complement to conven-tional MR imaging techniques for studying chronic processes and complex lesions.
There are some limitations to high-b-value dif-fusion-weighted imaging. High-b-value diffusion-weighted imaging requires a hardware upgrade, be-cause most scanners are not capable of generating a 40-mT/m gradient field. This would otherwise re-quire an increased gradient duration and interval, with an accompanying increase in echo time, all of which degrade image quality. Secondly, high-b-val-ue diffusion-weighted scans have accentuated an-isotropic effects in the brain stem and posterior capsular regions. This might limit the utility of high-b-value diffusion-weighted imaging in the brain stem as well as other areas where white mat-ter tracts are prominent (Figure 3). Although this was not a limitation in this study, further investi-gation would be necessary to determine which b value is best for evaluation of brain stem infarc-tions. Finally, high-b-value diffusion-weighted im-aging requires longer scanning times. Multiple ex-citations are needed to overcome signal-to-noise problems at high b values, thereby increasing im-aging time from 32 seconds (b 51000) to 2 min-utes and 8 seconds (b 5 3000).
AJNR: 21, November/December 2000 1828 MEYER
diffusion changes have been reported at lower b values, most commonly a high signal abnormality on the diffusion-weighted image indicates infarcted tissue (19, 21). This would require a study that in-volved high-b-value serial scanning to determine reversibility. A related unanswered question is how higher b values affect the observed time course of stroke. Serial high-b-value diffusion-weighted scans may help address this important issue.
Finally, it is unclear whether high-b-value dif-fusion-weighted imaging solves the problem of T2 shine-through, thereby eliminating the need to pro-duce ADC maps. ADC maps address the issue of T2 shine and offer the advantage of allowing ready differentiation of acute from chronic infarcts (25). Imaging at higher b-values might not alter these findings at all, because ADC maps that are con-structed should theoretically be independent of the b value. Further investigation and comparison of ADC maps with high-b-value diffusion-weighted images would be helpful to answer this question.
Despite improved contrast of high-signal lesions, high-b-value diffusion-weighted imaging did not improve our ability to diagnose acute infarction in patients with suspected infarction. An increased spectrum of imaging abnormalities was observed at higher b values, including improved contrast and increased detection of low-signal-intensity lesions. The improved detection of low-signal lesions re-sults in better visual characterization of brain le-sions with diffusion-weighted imaging. As opposed to a ‘‘light bulb’’ test that only answers the question of whether a recent infarct is present, high-b-value diffusion-weighted imaging offers more specific tis-sue characterization of brain lesions. Although this study addresses applications in brain infarction, better visual assessment of low- and high-signal lesions may have significant applications in other neurologic disorders. The combination of low- and high-b-value diffusion-weighted acquisitions may prove to be ef-ficacious in a variety of brain diseases.
Conclusion
High-b-value diffusion-weighted imaging pro-vides improved tissue characterization with better visualization of acute and chronic infarction. Al-though the improved contrast of high-signal lesions with high b values did not demonstrate additional areas of acute infarction, obtaining two b values (b 5 1000 and b 5 2500) resulted in improved de-tection of low-signal lesions (chronic infarction and brain tumor). No further improvement in lesion conspicuity was demonstrated at b 5 3000.
References
1. Lovblad KO, Laubach HJ, Baird AE, et al. Clinical experience
with diffusion-weighted MR in patients with acute stroke.
AJNR Am J Neuroradiol 1998;19:1061–1066
2. Benveniste H, Johnson GA. Mechanisms of ischemia-induced
changes in brain water diffusion coefficient studied by brain MRI and brain microdialysis. Stroke 1992;23:746–754
3. Baker LL, Kucharcyzk J, Sevick RJ, Mintorovich J, Moseley M.
Recent advances in MR imaging/spectroscopy of cerebral is-chemia. AJR Am J Roentgenol 1991; 156:1133–1143
4. Sevick RJ, Kanda F, Mintorovich J, et al. Cytotoxic brain edema:
assessment with diffusion-weighted MR imaging. Radiology
1992;185:687–690
5. Mintorovich J, Baker LL, Yang GY, et al. Diffusion weighted
hyperintensity in early cerebral ischemia: correlation with brain water content and ATPase activity. Proc Soc Magn Reson
1991;10:329
6. Bryan RN, Levy LM, Whitlow WD, Killian JM, Preziosi TJ, Ro-sario JA. Diagnosis of acute cerebral infarction: comparison of
CT and MR imaging. AJNR Am J Neuroradiol 1991;12:611–620
7. Yuh WT, Crain MR, Loes DJ, Greene GM, Ryals TJ, Sato Y. MR
imaging of cerebral ischemia: findings in the first 24 hours.
AJNR Am J Neuroradiol 1991;12:621–629
8. Moseley ME, Kucharczyk J, Mintorovich J, et al.
Diffusion-weighted MR imaging of acute stroke: correlation with T2-weighted and magnetic susceptibility-enhanced MR imaging in cats. AJNR Am J Neuroradiol 1990;14:330–346
9. Mintorovich J, Moseley ME, Chileuitt L, et al. Comparison of
diffusion and T2-weighted MRI for the early detection of ce-rebral ischemia and reperfusion in rats. Magn Reson Med 1991;
18:39–50
10. Moseley ME, Cohen Y, Mintorovich J, et al. Early detection of
regional cerebral ischemia in cats: comparison of diffusion and T2 weighted MRI and spectroscopy. Magn Reson Med 1990;
14:330–346
11. van Gelderen P, de Vleeschouwer MHM, DesPres D, Pekar J, van Zijl PCM, Moonen CTW. Water diffusion and acute stroke. Magn Reson Med 1994;31:154–163
12. Warach S, Chien D LiW, Ronthal M, Edelman RR Fast magnetic
resonance diffusion-weighted imaging of acute human stroke.
Neurology 1992;42:1717–1423
13. Warach S, Gaa J Siewert B, Wielopolski, Edelman RR. Acute
human stroke studies by whole brain echo planar diffusion-weighted magnetic resonance imaging. Ann Neurol 1995;37:
231–241
14. Chien D, Kwong KK, Gress DR, Buonno FS, Buxon RB, Rosen BR. MR diffusion imaging of cerebral infarction in humans. AJNR Am J Neuroradiol 1992; 13:1097–1102
15. Le Bihan D, Turner R, Douek P, Patronas N. Diffusion MR
im-aging: clinical applications AJR Am J Roentgenol 1992; 13:
1097–1102
16. Marks MP, De Crespigny A, Lentz D, Enzmann D, Albers GW, Moseley ME. Acute and chronic stroke: navigated spin-echo
diffusion weighted magnetic resonance imaging. Radiology
1996;199:403–408
17. Sorenson AG, Buononno FS, Gonzalez RG, et al. Hyperacute
stroke: evaluation with combined multisection diffusion-weighted and hemodynamically-diffusion-weighted echo planar MR im-aging. Radiology 1996;199:391–401
18. Sclaug G, Siewert B, Benfield A, Edelman RR, Warach S. Time
course of the apparent diffusion coefficient abnormality in hu-man stroke. Neurology 1997;49:113–119
19. Welch KMA, Windham J, Knight RA, et al. A model to predict
the histopathology of human stroke using diffusion and T2 magnetic resonance imaging. Stroke 1995;26:1983–1989
20. Le Bihan D. Molecular diffusion magnetic resonance. Magn Re-son Q 1991;7:1–30
21. Beauchamp NJ, Aziz MU, Passe TJ, van Zijl PCM. MR diffusion
imaging in stroke: review and controversies. Radiographics
1998; 18:1269–1283
22. Moseley ME, Sevisk R, Wendland MF, et al Ultrafast magnetic
resonance imaging: diffusion and perfusion. Journal of
Cana-dian Association of Radiologists 1991;42:31–38
23. Rother J, de Crespigny AJ, DA˜ Arceuil H, Iwai K, Moseley ME.
Recovery of apparent diffusion coefficient after ischemia-in-duced spreading depression relates to cerebral perfusion gra-dient. Stroke 1996;27:980–987
24. Norris DG, Niendorf T, Hoehn-Berlage M, Kohno K, Schneider EJ, et al. Incidence of apparent restricted diffusion in three
different models of cerebral infarction. Magn Reson Imaging
25. Loubinoux I, Volk A, Borredon J, Guirimand S, Tiffon B, Seylaz J, Meric P. Spreading of vasogenic edema and cytotoxic edema
assessed by quantitative diffusion and T2 magnetic resonance.
Stroke 1997;28:419–427
26. Leeds NE, Jackson EF. Invited commentary accompanying
ref-erence 21. Radiographics 1998;18:1283–1285
27. Edelstein WA, Bottomley PA, Hart HR, Smith LS. Signal, noise,
and contrasts in nuclear magnetic resonance (NMR) imaging.
J Comput Assist Tomogr 1983;7:391–401
28. Niendorf T, Dijkhuisen R, Norris D, Campagne M, Nicolay K.
Biexponential diffusion attenuation in various states of brain
tissue: implications for diffusion-weighted imaging. Magn
Re-son Med 1996;36:847–857
29. Tien Rd, Felsberg GJ, Friedman H, Brown M, Macfall J. MR
imaging of high-grade gliomas: value of diffusion-weighted echoplanar pulse sequences. AJR Am J Roentgenol 1994;162:
671–677
30. Tsuruda JS, Chew WM, Moseley ME, Norman D.
Diffusion-weighted MR imaging of the brain: value of differentiating between extraaxial cysts and epidermoid tumors. AJR Am J
Roentgenol 1990;155:1059–1065
31. Haimes A, Zimmerman R, Morgello S, et al. MR imaging of
![Figure 1 demonstrates the change in signal �tween three tissue types: a) normal gray matter tissue (assumedapparent diffusion coefficient [ADC]S1 � S0� be- 0.8 10–3 mm2/s,](https://thumb-us.123doks.com/thumbv2/123dok_us/1132678.633575/5.612.63.538.60.429/figure-demonstrates-normal-matter-tissue-assumedapparent-diffusion-coefcient.webp)
