DETERMINATION OF IPLEX MASSARRAY AS A METHOD FOR GENETIC TYPING AND CHARACTERIZATION OF STAPHYLOCOCCUS
AUREUS ISOLATES IN KENYA
NYASINGA JUSTINE TIRIMBA (BSc. PGD) I56/27783/2013
A THESIS SUBMITTED IN PARTIAL FULFILLMENT OF THE REQUIREMENTS FOR THE AWARD OF THE DEGREE OF MASTER OF
SCIENCE (BIOTECHNOLOGY) IN THE SCHOOL OF PURE AND APPLIED SCIENCES OF KENYATTA UNIVERSITY
DECLARATION
This thesis is my original work and has not been presented for award of a degree in any other university or for any other award.
Signature………... Date………. Justine Tirimba Nyasinga - 156/27783/2013
Department of Biochemistry, Microbiology and Biotechnology
SUPERVISORS
We confirm that the work reported in this thesis was carried out by the candidate under our supervision.
Signature………... Date………. Dr. Susan Musembi
Department of Biochemistry, Microbiology and Biotechnology Kenyatta University
Signature………... Date………. Dr. Lillian Musila
DEDICATION
ACKNOWLEDGEMENTS
TABLE OF CONTENTS
DECLARATION………..….ii
SUPERVISORS………...ii
DEDICATION………..iii
ACKNOWLEDGEMENTS……….iv
LIST OF FIGURES………viii
LIST OF TABLES………....x
ABBREVIATIONS AND ACRONYMS……….…xi
ABSTRACT………..xii
CHAPTER ONE………....1
INTRODUCTION………...1
1.1 Background information ... ……….1
1.2 Problem statement and study justification ... 3
1.3 Research questions ... 4
1.4 Objectives ... 5
1.4.1 General objective ... 5
1.4.2 Specific objectives ... 5
1.5 Significance of the study ... 5
CHAPTER TWO………...7
LITERATURE REVIEW……….7
2.1 Staphylococcus aureus infections ... .7
2.2 Pathogenicity of S. aureus ... 8
2.2.1 Clumping factor A ... 10
2.2.2 Intercellular adhesin ... 10
2.2.3 Enterotoxin A ... 11
2.2.4 Panton-Valentine leucocidin ... 11
2.3 Treatment andAntimicrobial resistance in S. aureus ... 12
2.4 Prevention and control of S. aureus infections ... 14
2.5 Genotyping of S. aureus ... 15
2.5.1 Pulsed Field Gel Electrophoresis (PFGE) ... 15
2.5.2 Multi Locus Sequence Typing (MLST) ... 16
2.5.3 Staphylococcal Protein A (spa) typing ... 18
2.5.5 Single nucleotide polymorphism (SNP) genotyping techniques ... 21
2.5.6 IPlex massARRAY SNP genotyping method ... 22
CHAPTER THREE………...27
MATERIALS AND METHODS………....27
3.1 Study location and period ... 27
3.2 Ethical Approvals ... 27
3.3 Staphylococcus aureus isolation ... 28
3.4 Demographic and clinical characteristics of the study population ... 30
3.5 Nucleic acid extraction ... 31
3.6 PCR reactions for the spa typing, MLST and virulence gene detection ... 32
3.6.1 PCR reactions for the spa typing ... 32
3.6.2 PCR reactions for MLST ... 33
3.6.3 PCR detection of selected virulence determinants ... 33
3.7 PCR clean up of spa gene and MLST amplification products ... 36
3.8 Sanger dideoxynucleotide sequencing of spa and MLST amplicons ... 36
3.9. IPlex massARRAY procedure ... 37
3.9.1 IPlex Mass array primer design ... 37
3.9.2 Primary amplification PCR ... 40
3.9.3 Removal of unincorporated dNTPs ... 41
3.9.4 IPlex reaction/Allele-specific primer extension PCR ... 41
3.9.5 Final product clean up and conditioning ... 42
3.9.6 Detection by Mass spectrometry ... 42
3.10 Data handling and analysis ... 42
CHAPTER FOUR………....44
RESULTS……….44
4.1 Distribution of virulence determinants ... 44
4.2 Distribution of Staphylococcus aureus according to spa types ... 50
4.3 Multi Locus Sequence Typing (MLST) results ... 52
4.4 iPlex MassARRAY results ... 55
4.4.1 IPlex MassARRAY results for MLST SNPS ... 55
4.4.2 Distribution of Staphylococcus aureus isolates according to SNP genotypes ... 57
4.4.4 Evaluating the discriminatory power of iPlex massARRAY against MLST
typing ... 60
4.4.5: Assessing the resolving power of selected SNPs ... 63
4.4.6 Evaluating iplex MassARRAY as a binary gene marker ... 66
4.4.7 Time and cost analysis between MassARRAY, spa and MLST typing ... 68
CHAPTER FIVE………..………...70
DISCUSSION, CONCLUSIONS, RECOMMENDATIONS AND FUTURE WORK………...………...70
5.1 DISCUSSION ... 70
5.1.1 Distribution of Staphylococcal virulence genes ... 70
5.1.2 Associations between virulence genes and selected markers of severity of infections ... 71
5.1.3 Distribution of Staphylococcus aureus types ... 72
5.1.4 Comparison of iPlex MassARRAY technique with other typing methods ... 74
5.1.5 Study limitations ... 80
5.2 CONCLUSIONS ... 80
5.3 RECOMMENDATIONS FROM THE STUDY ... 81
5.4 RECOMMENDATIONS FOR FUTURE WORK ... 81
REFERENCES………...………..82
APPENDICES……...………...88
Appendix 1: List of study isolates and their characteristics ... 88
Appendix 2: Antimicrobial Susceptibility Testing summary of the study isolates ... .90
Appendix 3: A summary of the SNPs, primer sequences and expected sizes for the primary PCR step ... 91
Appendix 4: A summary of the SNPs, primer sequences for the iPlex PCR reaction and expected extension masses for each SNP ... 93
Appendix 5: Reagent and consumable costing for spa and MLST typing ... 95
Appendix 6: A summary of reagent and consumable costing for iPlex massARRAY ... 98
Appendix 7: Ethical approvals ... 99
LIST OF FIGURES
Figure 1.1: A summary of the various MRSA clones that have been reported in Africa………4 Figure 2.1: An illustration of the seven target loci, primer names and positions for
S. aureus multilocus sequence typing...………..18 Figure 2.2: An illustration of the S. aureusspa typing technique………19 Figure 2.3: A diagram illustrating the iPlex massARRAY SNP genotyping
method………23 Figure 2.4: A Schematic showing the principle of Matrix Assisted Laser
Desorption/Ionization technique……….25 Figure 3.1: A map of Kenya showing the three counties from which the 54 S.
aureus isolates originated………...28 Figure 3.2: Graph showing regional distribution of the S. aureus isolates………...30 Figure 3.3: A schematic demonstration of the primer design strategy for binary gene
detection………..38 Figure 3.4: A spectrum of the adjusted unextended primers for the 19 gene targets
in pool 1………..39 Figure 3.5: A spectrum of the adjusted unextended primers for the 4 gene targets in
pool 2………..40 Figure 4.1: Distribution of five S. aureus virulence factors among the 54
isolates………44 Figure 4.2: A summary of the number of virulence genes detected in each S. aureus
isolate tested………45 Figure 4.3: A gel picture showing 770 bp amplicons for 10 isolates for icaA
gene………45 Figure 4.4: A gel picture showing the 980 bp amplicons for 10 isolates for clfA
Figure 4.5: A gel picture showing amplified regions of the X region of the spa gene for 30 isolates………..51 Figure 4.6: Spatial distribution of various spa types across the three counties……52 Figure 4.7: A representative gel picture showing amplicons for 9 isolates for three
LIST OF TABLES
Table 3.1: Summary of the demographic and clinical characteristics of the study population and S. aureus isolates used in this study………...31 Table 3.2: Target names, primer sequences and expected sizes for spa, MLST and
five virulence determinants………35 Table 4.1: Different virulence gene combinations……….47 Table 4.2: Logistic regression analyses between different virulence gene
combinations and three markers of severity of infection………..…….48 Table 4.3: Logistic regression analyses between number of virulence genes and
three markers of severity of infection……….49 Table 4.4: Distribution and diversity of spa types across the three sites…………..50 Table 4.5: Distribution of various sequence types across the three sites…………..54 Table 4.6: Characteristics of various MLST SNPs tested by iPlex massARRAY...56 Table 4.7: Distribution of S. aureus isolates by massARRAY SNP genotyping….58 Table 4.8: Comparisons between the discriminatory powers of iplex massARRAY
and spa typing for the collection of 54 S. aureus isolates………..59 Table 4.9: Comparisons between the discriminatory powers of iplex massARRAY
and MLST typing for the collection of 54 S. aureus isolates tested…...62 Table 4.10: A summary of the different SNP combinations tested for resolving
power………..65 Table 4.11: Distribution of various binary genes by PCR and massARRAY and
comparisons between the two methods………..67 Table 4.12: Comparisons between iPlex massARRAY, spa and MLST typing for
the 54 isolates analyzed in relation to discriminatory power, time, cost and multiplexing capabilities………..68 Table 4.13: Time-to-result analysis for spa, MLST and massARRAY typing
ABBREVIATIONS AND ACRONYMS AMR- Antimicrobial resistance
AST- Antimicrobial Susceptibility Testing ASPE- Allele Specific Primer Extension BLAST- Basic Local Alignment Search Tool BURP- Based Upon Repeat Pattern
BURST- Based Upon Related Sequence Type CC- Clonal complex
dNTPs- Deoxyribonucleoside Triphosphates ddNTPs- Dideoxyribonucleoside Triphosphates MALDI- Matrix Assisted Laser Desorption /Ionization MDR- Multi-Drug Resistance
MIC- Minimum Inhibitory Concentration MLST- Multi-locus sequence typing
MRSA- Methicillin-resistant Staphyloccus aureus
MSCRAMMs-Microbial Surface Components Recognizing Adhesive Matrix Molecules
MSSA- Methicillin-sensitive Staphyloccus aureus
PCR- Polymerase Chain Reaction
PFGE – Pulsed Field Gel Electrophoresis SAP- Shrimp alkaline phosphatase
SCCmec- Staphylococcal Cassette Chromosome mec
SNPs- Single Nucleotide Polymorphisms SPA- Staphylococcal Protein A
SSTIs- Skin and soft tissue infections ST- Sequence Type
ABSTRACT
Staphylococcus aureus is a clinically important pathogen in Kenya and globally owing to its widespread occurrence, virulence potential and multidrug resistance. Adequate surveillance is required to track the emergence and spread of hypervirulent and multidrug resistant strains such as methicillin and vancomycin resistant S. aureus (MRSA and VRSA). Conventional methods for S. aureus
characterization include Staphylococcal protein A (spa) gene typing, multi-locus sequence typing (MLST) and Pulsed Field Gel Electrophoresis. To overcome the limitations of high costs, long turnaround times and technical complexity associated with these methods, alternative genotyping approaches are required. This study evaluated mass spectrometry-based iPlex massARRAY as a method for genetic characterization of Kenyan S. aureus isolates by comparing it to spa, MLST and conventional PCR methods. Fifty four clinical S. aureus isolates from three hospital sites in Kenya (Kisumu, Nairobi and Kericho) were analyzed. Ten single nucleotide polymorphisms (SNPs) derived from six MLST loci and 13 binary gene markers for virulence and resistance were analyzed by iPlex massARRAY in a multiplexed assay. The isolates were also characterized using MLST, spa typing and conventional PCR assays for five selected staphylococcal virulence genes (icaA,
clfA, pvl, tsst and sea). IPlex massARRAY grouped 44/54 isolates into 14 SNP genotypes with 9 of the 10 MLST SNPs showing high identification rates (average 89%). MLST typing identified 21 sequence types (STs) in 49/54 isolates while spa
CHAPTER ONE
INTRODUCTION 1.1 Background information
Staphylococcus aureus is one of the most common microorganisms that colonize the human body. While it exists asymptomatically in healthy individuals, it can cause infections that may range from mild (boils, abscesses, impetigo and food poisoning) to severe (endocarditis, pneumonia, osteomyelitis and toxic shock syndrome) (Hao et al., 2012). With the global rise in development of antimicrobial resistance among bacterial pathogens, methicillin resistant S. aureus (MRSA) presents a serious clinical challenge (Andhoga et al., 2002; Struelens et al., 2009; Aiken et al., 2014).
In Kenya, the extent of infections caused by S. aureus is large. Akoru and others identified S. aureus as a major cause of infections across 9 hospital units including Intensive Care Units, surgical and pediatric wards in Moi Teaching and Referral Hospital (Akoru et al., 2016). About 34% of hospital blood stream infections at the Aga Khan hospital between 2003 and 2008 were caused by S. aureus (GARP, 2011). At Kenyatta National Hospital, the prevalence of MRSA was 33% of all S. aureus
organisms isolated in 2006 (Ngumi, 2006). S. aureus was the most common organism isolated from the wounds of post-operative patients at Moi Teaching and Referral Hospital with a prevalence of 55% (Andhoga et al., 2002).
primary focus of hospital infection control programs. Knowledge of the emergence, dissemination and molecular epidemiology of MRSA strains is required for effective prevention of the spread of MRSA (Struelens et al., 2009).
Various molecular typing techniques have been developed to study the evolution and spread of MRSA. The most widely used techniques for S. aureus typing include Pulsed Field Gel Electrophoresis (PFGE) which is based on gel resolution of genomic fragments after restriction enzyme digestion, multilocus sequence typing (MLST) which targets variations in DNA sequences of 400-500bp fragments from 7 housekeeping genes (Maiden et al., 1998), spa gene typing which identifies number and types of 24 nucleotide repeats in the variable X region of the spa gene (Shopsin et al., 1999) and Staphylococcal Cassette Chromosome (SCCmec) typing which is a PCR-based method that identifies variants of the mobile genetic element (SCCmec) in MRSA isolates (Mombach et al., 2007).
MLST and spa typing have become the most popular methods for epidemiological studies (O'Hara et al., 2016). To solve the limitations associated with the above methods such as high costs and long turnaround times, MALDI-TOF mass spectrometry-based iPlex massARRAY has been proposed as a simple, fast, affordable, robust and high throughput method for bacterial typing with capabilities for analyzing up to 40 targets in one isolate per reaction (Syrmis et al., 2011).
This study aimed to investigate and compare the genotypic characteristics of S. aureus
1.2 Problem statement and study justification
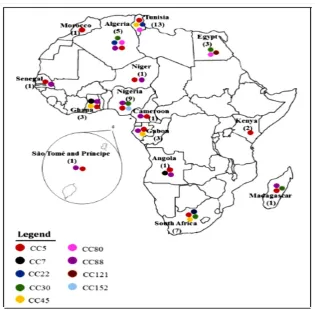
Methicillin resistance is emerging in different S. aureus clonal types that are associated with community, hospital and livestock strains. MRSA strains are associated with multidrug resistance and it is therefore important to monitor the evolution of MRSA in order to detect and manage outbreaks in the community and health facilities. Particular S. aureus clones are predominant in certain geographical regions of the world and are associated with increased virulence (Omuse et al., 2016). Data on clonal diversity of S. aureus in Kenya and Africa is scanty (Figure 1.1) and thus relationships between S. aureus types, resistance and virulence have not been well elucidated (Abdulgader et al., 2015). Only two studies in Kenya have reported on the circulating MRSA strains (Aiken et al., 2014; Omuse et al., 2016).
Figure 1.1: A summary of the various MRSA clones that have been reported in Africa. The colored circles represent various clones while the numbers in brackets represent the studies conducted in each country (Abdulgader et al., 2015).
1.3 Research questions
i. What is the strain type diversity and distribution of clinical S. aureus isolates in 3 hospital sites in Kenya?
ii. Is there an association between the presence of five selected virulence determinants and selected markers of severity of staphylococcal infections? iii. How discriminatory is the iPlex MassARRAY method in relation to MLST and
spa typing techniques in classifying Kenyan S. aureus types?
v. How does iplex massARRAY compare to spa and MLST typing with respect to assay turnaround time and reagent and consumable costs per isolate?
1.4 Objectives
1.4.1 General objective
To determine the use of iPlex MassARRAY genotyping method for genetic typing and characterization of S. aureus isolates in Kenya in relation to conventional methods
1.4.2 Specific objectives
i) To establish the diversity and distribution of S. aureus isolates from 3 hospital sites using spa gene and MLST typing
ii) To determine the presence of five selected staphylococcal virulence determinants and their possible associations with selected markers of severity of staphylococcal infection
iii) To characterize Kenyan S. aureus isolates using a multiplexed SNP assay on the iPlex MassARRAY system and compare the method with spa, MLST and conventional PCR methods
1.5 Significance of the study
CHAPTER TWO
LITERATURE REVIEW
2.1 Staphylococcus aureus infections
Staphylococcus aureus is a gram-positive, spherical-shaped eubacteria that exhibits a clustered cellular morphology. In healthy individuals the bacteria colonizes various parts of the body such as nasal passages and skin as a part of the normal flora. Some studies have estimated a global nasal S. aureus colonization prevalence of 30% in humans (Chambers and Deleo, 2009). Though the organism exists asymptomatically in healthy individuals, it may cause infections of the central nervous system, respiratory tract and wounds among other anatomical sites. These infections may range from mild (impetigo, boils, abscesses, folliculitis and cellulitis) to very severe (toxic shock syndrome, septic arthritis, osteomyelitis, endocarditis and necrotizing pneumonia) (Enright et al., 2000).
S. aureus is one of the most common antimicrobial resistant bacteria encountered in clinical settings and an important cause of nosocomial (hospital-acquired) infections (Struelens et al., 2009). Methicillin resistant strains of S. aureus present a public health challenge in the management of nosocomial infections due to their occurrence in outbreaks, relatively high treatment costs and limited choices for antimicrobial drug therapy (Dancer, 2005).
2011). At Kenyatta National Hospital, the prevalence of MRSA was 33% of all S. aureus isolated in 2006 (Ngumi, 2006).
In another Kenyan study focusing on skin and soft tissue infections in Nairobi, 65% of boil cultures were positive for S. aureus, 87.2% of which were MRSAs (Maina et al., 2013). In the same study, there was no resistance observed against vancomycin although multi-drug resistance and decreased susceptibility to erythromycin and clindamycin were reported (Maina et al., 2013).
A study conducted in Thika level 5 hospital involving 950 inpatient screens reported a
S. aureus prevalence of 8.9% with the level of MRSA detected among these isolates being 7% (Aiken et al., 2014). Most of these MRSA isolates were from burn patients and were members of the same clone; ST239, spa type t037. In contrast to MSSA, MRSA strains showed resistance to multiple antibiotics (Aiken et al., 2014).
Livestock associated MRSA (LA-MRSA) strains have also been reported among farmers, veterinary practitioners and people living in close proximity to animals with similar strains isolated from pigs, cows and other animals pointing to possible zoonotic transmission (Hao et al., 2012).
2.2 Pathogenicity of S. aureus
These virulence genes include surface adhesins, pore-forming toxins, enzymes, superantigens and molecules that aid in immune system evasion (Bartlett and Hulten, 2010; Spaan et al., 2017). Surface adhesins, molecules that facilitate attachment to host cell surfaces and toxins, molecules that mediate membrane destruction and cell lysis are the most important groups of molecules that aid in the pathogenesis of S. aureus infections. The expression of these molecules is tightly regulated by systems such as the two-component signal transduction systems (TCS) which include accessory gene regulator (agr), Staphylococcal accessory element (saeRs) and vraRs
(Hao et al., 2012).
Some of the genes related to formation of surface adhesins include clumping factor A (clfA), clumping factor B (clfB), collagen adhesin gene (cna), staphylococcal surface protein A (spa), sialoprotein-binding protein (bbp), fibronectin binding protein (fnb) and elastin-binding protein (ebps) genes (Paniagua-Contreras et al., 2012). These genes code for proteins that exhibit specific binding to host cell proteins such as elastin, sialoprotein, fibronectin, immunoglobulin G (IgG), collagen and fibrinogen thereby facilitating bacterial adhesion to host cell surfaces.
(Loughman et al., 2009). In this section, a review of 2 adhesins and 2 toxin molecules is presented.
2.2.1 Clumping factor A
Clumping factor A is a member of a group of staphylococcal adhesins collectively referred to as Microbial Surface Components Recognizing Adhesive Matrix Molecules (MSCRAMMs). ClfA is a protein associated with the cell surface that is thought to aid in cell adhesion by binding to host fibrinogen protein (Lacey et al., 2016). Other researchers have suggested that clumping factor A plays a role in mediating direct binding of S. aureus to platelets, a phenomenon that likely contributes to severity of staphylococcal endocarditis (Lacey et al., 2016). Murine models of sepsis, endocarditis and arthritis have shown a role of clfA in attachment to host cells and immune system escape (Lacey et al., 2016). Peacock and others did not find any association between clfA and invasive staphylococcal infections in a study that compared staphylococcal virulence between healthy volunteers and invasive infection patient groups in the United Kingdom (Peacock et al., 2002). However, given the discordant findings regarding the role of clfA in staphylococcal pathogenicity, further research is needed to unravel its role in skin and soft tissue infections.
2.2.2 Intercellular adhesin
2015). Biofilm formation is a two-step sequential process that begins with cellular attachment to a solid surface after which cell to cell adhesion follows leading to formation of layers of cells as a result of the action of the polysaccharide intercellular adhesin (Arciola et al., 2015).
Bacterial colonies that exist as biofilms in invasive biomedical devices can initiate infections that are difficult to eliminate as the inner layers of cells remain shielded from the host immune system responses and the bactericidal activity of antibiotic therapy (Arciola et al., 2015). Moreover, chronicity and irreducibility of certain bacterial infections has been attributed to biofilm formation (Arciola et al., 2015). One study identified intercellular adhesin as a possible contributor to severity of staphylococcal invasive infections both individually and in combination with other virulence factors (Peacock et al., 2002).
2.2.3 Enterotoxin A
S. aureus can grow in food and produce extracellular toxins. These preformed exotoxin molecules exert their disease-causing effects on the intestinal tract upon consumption of contaminated foods. As such, bacterial exotoxins that affect the intestinal tract are referred to as enterotoxins (Bhatia and Zahoor, 2007). In S. aureus, these molecules of low molecular weight differ on their antigenic properties and have been named according to the alphabet depending on the order of their discovery. So far, over 10 staphylococcal enterotoxins have been described denoted (SEA-SEO) (Bhatia and Zahoor, 2007).
2.2.4 Panton-Valentine leucocidin
2012). Studies have demonstrated the ability of PVL to induce death of polymorphonuclear cells (Ritz and Curtis, 2012; Spaan et al., 2017). In parts of the USA and Australia, the PVL toxin has been associated with CA-MRSA strains prompting research on its role in increasing the pathogenicity associated with such infections (Chambers and Deleo, 2009; Loughman et al., 2009).
However, despite the high prevalence of the PVL toxin in CA-MRSA strains, its role in pathogenesis is still controversial (DeLeo et al., 2010; Ritz and Curtis, 2012) because CA-MRSA strains lacking the toxin have been found to cause infections as severe as PVL-positive CA-MRSA strains (DeLeo et al., 2010). Some studies have suggested that the role of PVL in pathogenesis is dependent on the site of infection, with positive correlations being observed with severe infections in the lungs and the bone but not the skin (Ritz and Curtis, 2012).
2.3 Treatment and Antimicrobial resistance in S. aureus
In healthy individuals, mild S. aureus infections such as boils and abscesses may resolve on their own but when they persist, they can be treated with antibiotics. Drainage of infected sites for mild infections is an equally effective way of managing staphylococcal infections (Liu et al., 2011). The choice and duration of antibiotic therapy are influenced by factors such as the nature and location of infection as well as patient factors such as age and immune status.
are effective (Liu et al., 2011). However, MRSA strains warrant administration of stronger combinations of antibiotic agents such as vancomycin.
Methicillin-resistant and vancomycin-resistant strains of S. aureus pose the greatest challenge in managing staphylococcal infections. These strains are important as they are associated with resistance to multiple drug classes which include macrolides, aminoglycosides, fluoroquinolones, tetracyclines, lincosamides and β-lactams (Aminov, 2010). Though they were the earliest drugs to be used against S. aureus,
resistance to β-lactams for example penicillin is now globally distributed with less than 10% of isolates exhibiting susceptibility to the drug (Aminov, 2010). Resistance to β-lactams by S. aureus is mediated by the blaZ-blaI-blaIR gene complex that is responsible for β-lactamase enzyme synthesis (Hao et al., 2012). The enzyme breaks down the drug thereby rendering it inactive against the bacterial cells.
Resistance to methicillin, a semi-synthetic β-lactam that is penicillinase-stable emerged in the 1960s and such strains are currently distributed worldwide (Chambers and Deleo, 2009). Resistance to methicillin is mediated by the production of a modified form of the penicillin-binding protein, PBP2a. Synthesis of PBP2a is mediated by the MecA-MecI-MecIR gene complex that has the same regulatory mechanism as that of the Bla gene complex (Hao et al., 2012).
in the 1990s (Chambers and Deleo, 2009). These MRSA strains, which were associated with the production of the Panton-Valentine Leucocidin (PVL) toxin, then spread to the United States and other parts of the world.
Currently, vancomycin is one of the most reliable last line treatments for staphylococcal infections. Since its first report in Japan in 1996 (Hiramatsu, 2001), vancomycin resistance has been reported in various parts of the world among patients and even among healthy non-hospitalized carriers (Palazzo et al., 2005). Most recently, vancomycin-resistant strains of S. aureus have been isolated from livestock in India thereby highlighting the growing threat of VRSA globally (Bhattacharyya et al., 2016).
2.4 Prevention and control of S. aureus infections
There is currently no approved vaccine for S. aureus infections although clinical trials are currently ongoing (Mohamed et al., 2017). An effective vaccine will be a welcome intervention in this era of multidrug resistance by the pathogen.
2.5 Genotyping of S. aureus
In epidemiological and hospital investigations of various microbial pathogens, molecular techniques have emerged as important tools for establishing the origin and relatedness of various strains (Struelens et al., 2009). S. aureus has been reported to have a highly clonal population structure such that indexing of DNA polymorphisms through restriction digestion, single nucleotide polymorphisms (SNPs), tandem DNA repeats and inter-repeat spacer element polymorphisms generally yields concordant results (Struelens et al., 2009).
An ideal genotyping technique should have high discriminatory power, technical simplicity, short turnaround times to results, robustness, cost effectiveness, high throughput and inter-laboratory portability of data (Struelens et al., 2009; Syrmis et al., 2011). However, no existing method combines all these features and each method has its strengths and limitations. Some of the most common genotyping methods are detailed below.
2.5.1 Pulsed Field Gel Electrophoresis (PFGE)
large genomic fragments of more than 50kb move as broad numerous and indiscrete bands within the gel, thereby resulting in low resolution (Frickmann et al., 2012). Use of an alternating current at angles of 600 to the direction of DNA flow resolves larger molecules of up to 10 megabases (mb).
Before the advent of DNA sequence based techniques, PFGE was regarded as a simple and versatile technique for establishing physical and optical genetic maps. The technique offers very high resolution and as such it was the most suitable method for investigations of S. aureus outbreaks (Frickmann et al., 2012). Moreover, there is a universally accepted criterion for interpretation of data from PFGE analysis (Struelens
et al., 2009). PFGE is able to resolve insertions or deletions of mobile genetic elements (MGEs) such as the SCCmec complex into and out of the chromosome. PFGE is however technically demanding, takes about 2-3 days to complete, difficult to reproduce and costly with low throughput capabilities. In addition, the method presents a challenge in typing certain STs such as livestock associated strains like ST398 which show extensive DNA methylation (Struelens et al., 2009).
In recent years however, the need to have high throughput, rapid and robust typing methods with inter-laboratory portability coupled with reduced cost and availability of sequencing platforms has shifted the attention from PFGE to DNA sequence-based techniques (Frickmann et al., 2012).
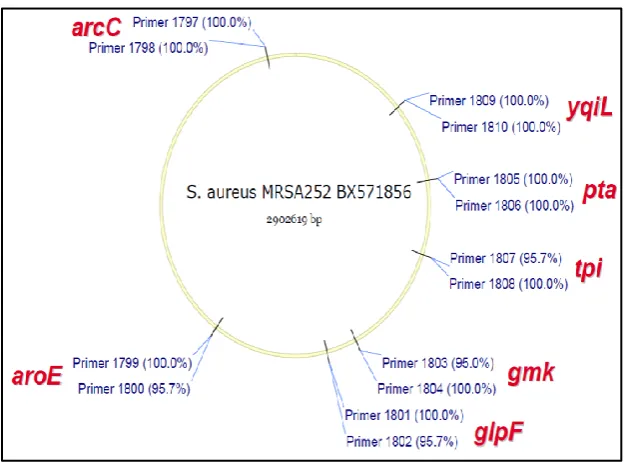
2.5.2 Multi Locus Sequence Typing (MLST)
from seven housekeeping genes are sequenced for different polymorphisms (Maiden
et al., 1998). The technique was first applied to Neisseria meningitidis where 470 base pair fragments from 11 housekeeping genes were analyzed. The method has since been extended to other pathogens including Vibrio cholera and S. aureus (Enright et al., 2000). In S. aureus MLST typing, seven housekeeping genes are sequenced. These genes are Carbamate kinase (ArcC), Shikimate dehydrogenase (AroE), Glycerol kinase (glpF), Guanylate kinase (gmk), Phosphate acetyl transferase (pta), Triosephosphate isomerase (tpi) and Acetyl co-enzyme A acetyl transferase (yqil). The combination of polymporphisms across the seven loci is the basis on which sequence types are assigned.
In MLST typing, the selected fragments are first amplified by PCR after which they are sequenced (Maiden et al., 1998). The unique sequences for a given fragment are assigned specific allelic numbers which are then used to make an allelic profile for the annotation of a sequence type (ST) for a given isolate. Isolates with the same alleles for at least 5 of the seven loci are regarded as members of the same clonal complex. Isolates that differ by one allele from the founder sequence type are termed as single locus variants (SLVs) while those that differ by two alleles are referred to as double locus variants (DLVs). Isolates with unique allelic profiles are classified as singletons. There are about 3000 sequence types reported for S. aureus which together make up a number of clonal complexes (CC).
MLST is the main reference method for defining the genetic population structure for
discriminatory power has been attributed to the fact that polymorphisms are analyzed for housekeeping genes which are generally conserved that is, slow evolving. Moreover, with the advent of rapid and low cost whole genome sequencing, MLST offers limited utility as sequence data from MLST represents only about 0.1% of the total bacterial genome. MLST typing targets and genomic distribution is illustrated in Figure 2.1.
Figure 2.1: An illustration of the seven target loci, primer names and positions for S. aureus multilocus sequence typing. Fragments of about 500 bp from seven housekeeping genes are selected (Hasman et al., 2010).
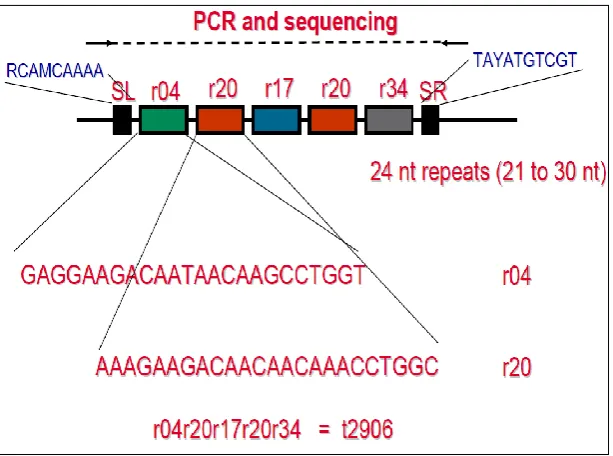
2.5.3 Staphylococcal Protein A (spa) typing
Staphylococcal protein A (spa) gene typing is a single locus sequence-based technique for determination of polymorphisms in the variable X region of the spa
binding aids in sequestration of antibodies and killing of B lymphocytes leading to immune system evasion by the pathogen (Kobayashi and DeLeo, 2013).
Spa typing entails first performing a PCR reaction to amplify the variable region of the spa gene after which DNA sequencing of the amplicon is done. Spa types are then assigned based on the number and type of 24 nucleotide repeats in the variable X-region of the gene. The spa types are then clustered using an algorithm called Based Upon Repeat Pattern (BURP) to form spa clonal complexes (spa CCs) (O'Hara et al., 2016). An illustration of spa typing is shown in Figure 2.2.
Figure 2.2: An illustration of the S. aureus spa typing technique. The number and type of 24 nucleotide repeats in the X-region of the spa gene corresponds to a particular spa type (Hasman et al., 2010).
aureus isolates using both spa and MLST typing (O'Hara et al., 2016). Spa typing yielded comparable results to MLST and was relatively cost effective (O'Hara et al., 2016).
However, the technique is faced with certain limitations such as misclassification of certain STs due to DNA transfer, homoplasy and recombination events (Struelens et al., 2009). Even though spa typing shows high discriminatory power, in some instances it requires additional evaluation of other binary markers such as virulence or resistance factors for reliable delineation of certain STs (Struelens et al., 2009).
Despite spa and MLST typing being the two most common sequence-based typing methods, other studies based on sequence variation on different staphylococcal genes have been reported. For example, a comparable resolution with MLST typing was reported when a collection of 61 S. aureus isolates was analyzed by sequencing three staphylococcal exotoxin genes, set2, set5 and set7 (Aguiar-Alves et al., 2006).
2.5.4 Staphylococcal Cassette Chromosome mec typing (SCCmec)
Staphylococcal cassette chromosome mec (SCCmec) is a mobile genetic element (MGE) that has been demonstrated to contain genes that confer resistance to different drugs including methicillin to S. aureus. This element contains a gene that encodes a modified form of the penicillin binding protein, PBP2a which ensures diminished binding of methicillin to its target site (Mombach et al., 2007; Hao et al., 2012). The SCCmec is composed of the mecA complex with regulatory elements mecI and
In addition to the mecA and ccr complexes, the SCCmec complex contains interspersed junk regions (J-regions) J1, J2 and J3 (orfX) in between them. These regions include elements such as insertion sequences (IS) and transposons (Tn). Some of these elements have been shown to encode genes responsible for multidrug resistance and pathogenicity of MRSA (Hao et al., 2012). For example, Tn554 has been reported to aid in resistance against erythromycin and streptomycin while Tn4001 has been attributed to resistance against aminoglycosides. Plasmid pUB110 is thought to aid in resistance against bleomycin and tobramycin while pT181 has been implicated for resistance against tetracycline (Hao et al., 2012).
Owing to the importance of the SCCmec complex in virulence and resistance of MRSA, the region is often genotyped in epidemiologic studies to add resolution to MRSA classifications. There are about 11 distinct types of the SCCmec complex. SCCmec type I-III have been mainly associated with hospital-acquired strains of MRSA (HA-MRSA), while SCCmec type IV-V are associated with CA-MRSA and SCCmec type IV-VII are associated with CA-MRSA.
2.5.5 Single nucleotide polymorphism (SNP) genotyping techniques
2.5.6 IPlex massARRAY SNP genotyping method
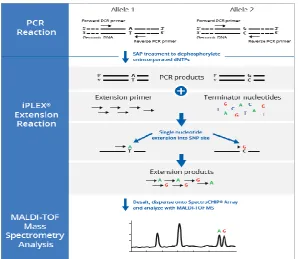
2.5.6.1 Principle of iPlex massARRAY
IPlex massARRAY is a SNP genotyping method that combines PCR and mass spectrometry. The technique entails two types of PCR reactions; a primary amplification followed by a single base primer extension PCR (also called allele specific primer extension (ASPE) PCR). The primary PCR involves amplification of 80-120 bp fragements of the regions containing an informative SNP. In the second ASPE PCR, primers are designed such that the 3’end is adjacent to the SNP site and, using terminator ddNTPs, the primer extends by only one base. The base that is added at the SNP position can then be identified using MALDI-TOF Mass Spectrometry.
Figure 2.3: A diagram illustrating the iPlex massARRAY SNP genotyping method. This is a three-step technique that involves a conventional PCR reaction followed by single base extension PCR that generates fragments that are detected by mass spectrometry (www.agenabioscience.com).
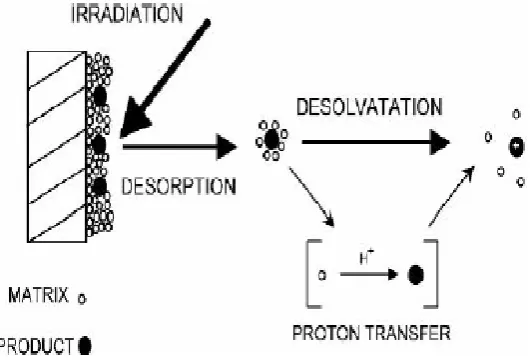
2.5.6.2 Matrix Assisted Laser Desorption/Ionization Time of Flight Mass Spectrometry (MALDI-TOF)
Mass spectrometry is a technique that is used for the analysis of ionic gas phase forms of a sample molecule by measuring its charge to mass ratio (m/z). The MALDI approach is a soft ionization technique that allows the analysis of molecules that are large, non-volatile and temperature sensitive such as nucleic acids, proteins and inorganic molecules (Edmond de Hoffmann, 2007).
room temperature. The matrix molecules surround the individual analyte molecules in its solid state. The sensitivity of MALDI is related to the efficiency with which matrix molecules separate individual analyte molecules thereby avoiding formation of clumps of the analyte. In the second step, a laser is directed at the analyte-matrix solid mixture under vacuum conditions where desorption and ionization occur through processes such as ion-molecule interactions, excited state proton transfer and desorption of pre-formed ions leading to formation of gaseous ions of the analyte. (Edmond de Hoffmann, 2007).
Figure 2.4: A Schematic showing the principle of Matrix Assisted Laser
Desorption/Ionization technique. A laser is irradiated at the analyte contained in a matrix material leading to formation of singly charged analyte molecules (Edmond de Hoffmann, 2007).
2.5.6.3 Current applications of iPlex massARRAY in bacterial genotyping
Robertson and others developed a bioinformatics driven software (Minimum SNPs) for generating sets of informative SNPs from gene sequences found in the MLST database (Robertson et al., 2004). Seven highly informative SNPs that could resolve Australian MRSA strains into major clonal complexes were identified (Robertson et al., 2004) and subsequently applied on a larger collection of both MSSA and MRSA isolates (Huygens et al., 2006). Inclusion of binary markers from resistance or virulence determinants was found to increase resolution of the assay (Huygens et al., 2006; Stephens et al., 2006). At the time, the authors developed kinetic PCR techniques for the rapid interrogation of these SNPs and binary markers.
97.7% accuracy using PCR as the reference method (Syrmis et al., 2011). Bouakaze
et al applied iPlex massARRAY in the identification of Mycobacterium tuberculosis
complex (MTBC) (Bouakaze et al., 2011). Trembizki et al developed, applied and validated a 14-member SNP assay on the massARRAY platform for genetic characterization of Neisseria gonorrhea isolates in Australia (Trembizki et al., 2014). Subsequently, the assay was used for a large scale AMR surveillance study of
Neisseria gonorrhea (Whiley et al., 2017).
CHAPTER THREE
MATERIALS AND METHODS
3.1 Study location and period
This study analyzed 54 archived (cryopreserved) S. aureus isolates that were collected between January 2015 and June 2016 as part of an ongoing antimicrobial resistance surveillance project conducted by the KEMRI-United States Army Medical Research Directorate-Africa (USAMRD-A). The study covers three hospital sites in three counties of Kenya: Defense Forces Memorial Hospital (Nairobi), Kericho County Hospital and Kisumu District Hospital. Kericho County is a region on the Kenyan Rift valley with an estimated population of 1 million people (UNICEF-Worldpop). It is mainly an agricultural region with a large proportion of the respondent population reporting themselves as rural residents (56%). Nairobi is Kenya’s capital city with an estimated population of 4 million people (UNICEF-Worldpop) and 74% of the study participants from the region responded as urban residents. Kisumu is a lake-side city county of 1.2 million people (UNICEF-Worldpop) found on the western region of the country where 67% of participants from the region reported their residence as either urban or semi-urban. Figure 3.1 shows a map of the study counties.
3.2 Ethical Approvals
Figure 3.1: A map of Kenya showing the three counties from which the 54 S. aureus
isolates originated (Courtesy: Peter Macharia).
3.3 Staphylococcus aureus isolation
In the parent study, S. aureus was isolated from specimens by culture on sheep blood agar (SBA) and Mueller Hinton agar (MHA) after which biochemical identification was done using tests such as Gram staining, cell and colonial morphology, catalase and coagulase tests. All biochemically identified S. aureus isolates were screened for the presence of femA gene which is used as a molecular confirmatory test for S. aureus.
Antimicrobial susceptibility testing was performed using a panel of antimicrobial drugs from different drug classes such as β-Lactams, aminoglycosides, tetracyclines, macrolides and fluoroquinolones using the disc diffusion method and the automated Microscan system (Siemens). A cefoxitin and /or oxacillin screen was used as a proxy for methicillin resistance. Isolates were categorized as resistant or susceptible as per the Clinical Laboratory Standards Institute (CLSI) guidelines. Of the 54 isolates, 11% (6/54) were MRSA (Musila et al., unpublished). Summaries of the antimicrobial susceptibility testing (AST) profiles of the isolates are presented in Appendix 2. The six MRSAs were further characterized by MecA gene PCR and SCCmec typing. All MRSA isolates were mecA-positive and 4/6 had SCCmecIV genotype (Musila et al.,
unpublished). All isolates were screened for VanA gene (vancomycin resistance) and none was positive for the gene. All S. aureus isolates were preserved in glycerol stocks at -80 0C.
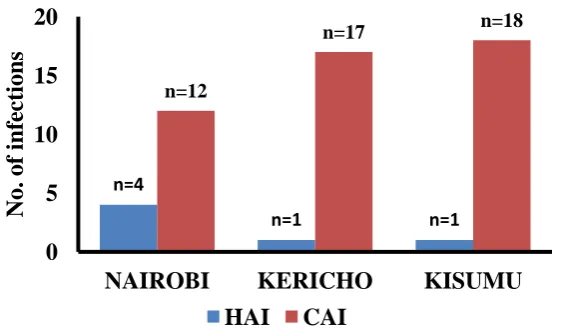
defined as that which was detected after 48 hours of admission into a healthcare facility. One isolate from Kericho was not categorized as either CAI or HAI as the patient had been given a referral from another hospital. Figure 3.2 summarizes the distribution of the study isolates across the three sites. Overall, 87% (47/54) of the isolates were associated with community-acquired infections (CAI) while 11.1% (6/54) of them were hospital-acquired (HAI). Across the three sites, community acquired infections were predominant.
Figure 3.2: Graph showing regional distribution of the S. aureus isolates.
3.4 Demographic and clinical characteristics of the study population
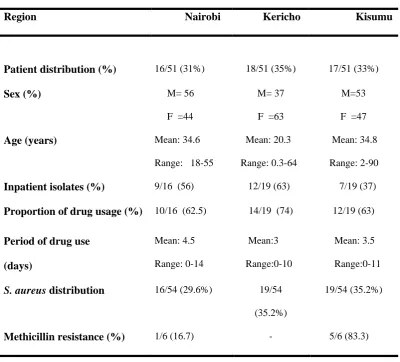
Of the three sites, Kericho and Kisumu were represented by 35% (19/54) of the isolates each whereas 30% (16/54) of the isolates were isolated from patients in Nairobi (Table 3.1). Variables such as period of drug use and in-/out-patient status were available for these isolates. Overall, 52% (28/54) of the isolates were isolated from in-patients while the remainder (26/54) was from out-patients. The period of drug use ranged from 0-14 days with an average period of 3.6 days. About 67% (36/54) of the isolates were recovered from patients who had been on antibiotic treatment for at least 1 day. The age of patients ranged from 3 months to 90 years with a mean age of 29.7 years.
n=4
n=1 n=1
n=12
n=17 n=18
0 5 10 15 20
NAIROBI KERICHO KISUMU
No.
of i
nfec
ti
ons
Table 3.1: Summary of the demographic and clinical characteristics of the study population and S. aureus isolates used in this study
S. aureus infected population (N=51)*
Region Nairobi Kericho Kisumu
Patient distribution (%) 16/51 (31%) 18/51 (35%) 17/51 (33%)
Sex (%) M= 56
F =44
M= 37
F =63
M=53
F =47
Age (years) Mean: 34.6
Range: 18-55
Mean: 20.3
Range: 0.3-64
Mean: 34.8
Range: 2-90
Inpatient isolates (%) 9/16 (56) 12/19 (63) 7/19 (37)
Proportion of drug usage (%) 10/16 (62.5) 14/19 (74) 12/19 (63)
Period of drug use
(days) Mean: 4.5 Range: 0-14 Mean:3 Range:0-10 Mean: 3.5 Range:0-11
S. aureus distribution 16/54 (29.6%) 19/54
(35.2%)
19/54 (35.2%)
Methicillin resistance (%) 1/6 (16.7) - 5/6 (83.3)
Note: (-) denotes zero observations. *:Even though the total number of isolates was 54, the number of patients was 51. There were three patients from each of whom 2 different isolates were recovered (Refer to isolate list in Appendix 1)
3.5 Nucleic acid extraction
antimicrobial resistance profiles and genotypes were also sub-cultured. The standard strains used were: ATCC 43300, ATCC CO-34, ATCC 25213 and ATCC 25923.
The ZR/Fungal/ Bacterial DNA MiniPrep kit (Zymo Research) was used for extraction following manufacturer’s instructions with minor modifications. A loopful of S. aureus inoculum was picked and suspended in 200 µl of sterile distilled water and vortexed to form a uniform suspension. The suspension was transferred to a tube containing beads. About 750 µl of cell lysis solution was added to the cell suspension and the mixture was vortexed for 10 minutes at room temperature before centrifugation at 10,000 rpm (Eppendorf Microcentrifuge Model 5418) for 1 minute. After a series of washes, the column containing DNA was transferred to a clean 1.5 ml microcentrifuge tube and DNA was eluted with 60 µl of DNA elution buffer by centrifuging at 10,000 rpm (Eppendorf Microcentrifuge Model 5418) for 30 seconds. DNA was then quantified using the fluorometry-based Qubit DsDNA quantification kit (Life Technologies). Typical DNA yields ranged from 35 ng/µl to 120 ng/µl. DNA samples were stored at -20 0C.
3.6 PCR reactions for the spa typing, MLST and virulence gene detection
3.6.1 PCR reactions for the spa typing
at 95 0C for 45 seconds, primer annealing 60 0C for 30 seconds, extension at 72 0C for 90 seconds followed by a final extension at 72 0C for 10 minutes. Amplification products were resolved on a 1.5% agarose in 1X TAE buffer and visualized using a UV- transilluminator.
3.6.2 PCR reactions for MLST
All the seven primer pairs used in the PCR reactions are shown in Table 3.2. Each PCR reaction was performed in a 25 µl reaction volume comprising 10.5 µl of sterile nuclease free distilled water, 12.5 µl of Dream Taq mix (Thermo Fisher Scientific), 0.5 µl (10 pmol) of both forward and reverse primers with 1 µl of template DNA (approximately 50 ng). Thermocycler conditions were set as: Initial denaturation at 950C for 3 minutes and 35 cycles of strand denaturation at 95 0C for 30 seconds, primer annealing at 55 0C for 30 seconds and extension at 72 0C for 1 minute and a final extension at 72 0C for 10 minutes. The amplicons were resolved and visualized as described in section 3.6.1 for spa gene PCR products.
3.6.3 PCR detection of selected virulence determinants
Table 3.2: Target names, primer sequences and expected sizes for spa, MLST and five virulence determinants
Locus Forward primer Reverse primer Product size Reference
Spa gene
spa 5ʹ TAAAGACGATCCTTCGGTGAGC3ʹ 5ʹ CAGCAGTAGTGCCGTTTGCTT3ʹ Variable (Shopsin et al., 1999)
MLST loci
arc 5ʹ TTGATTCACCAGCGCGTATTGTC3ʹ 5ʹAGGTATCTGCTTCAATCAGCG3ʹ 456 bp (Enright et al., 2000)
aro 5ʹ ATCGGAAATCCTATTTCACATTC3ʹ 5ʹ GGTGTTGTATTAATAACGATATC3ʹ 456 bp (Enright et al., 2000)
glp 5' CTAGGAACTGCAATCTTAATCC3' 5' TGGTAAAATCGCATGTCCAATTC3' 465 bp (Enright et al., 2000)
gmk 5' ATCGTTTTATCGGGACCATC3' 5' TCATTAACTACAACGTAATCGTA3' 429 bp (Enright et al., 2000)
pta 5' GTTAAAATCGTATTACCTGAAGG3' 5' GACCCTTTTGTTGAAAAGCTTAA3' 474 bp (Enright et al., 2000)
tpi 5'TCGTTCATTCTGAACGTCGTGAA3' 5' TTTGCACCTTCTAACAATTGTAC3' 402 bp (Enright et al., 2000)
yqil 5'CAGCATACAGGACACCTATTGGC3' 5' CGTTGAGGAATCGATACTGGAAC3' 516 bp (Enright et al., 2000)
Virulence determinants
clfA 5ʹGGCTTCAGTGCTTGTAGG3ʹ 5ʹTTTTCAGGGTCAATATAAGC3ʹ 980 bp (Stephan et al., 2001)
pvl 5ʹATCATTAGGTAAAATGTCTGGACATGA TCC A3ʹ
5ʹGCATCAASTGTATTGGATAGCAAAAGC3ʹ 433 bp (Lina et al., 1999)
icaA F: 5ʹGATTATGTAATGTGCTTGGA3ʹ 5ʹACTACTGCTGCGTTAATAAT3ʹ 770 bp (Peacock et al., 2002).
sea 5ʹGGATATTGTTGATAAATATAAAGGGAA AAAAG3ʹ
5ʹGTTAATCGTTTTATTATCTCTATATATTC TTAATAGT3ʹ
439 bp (Johnson et al., 1991)
tsst 5ʹ ATGGCAGCATCAGCTTGATA3ʹ 5ʹ TTTCCAATAACCACCCGTTT3ʹ 350 bp (Johnson et al., 1991)
3.7 PCR clean up of spa gene and MLST amplification products
In preparation for sequencing reactions, all amplicons were purified using the DNA Clean & Concentrator kit (Zymo Research) following manufacturer instructions. Five volumes of DNA binding buffer for each volume of amplicon DNA was added into a Zymospin V column and centrifuged at 10,000 rpm (Eppendorf Microcentrifuge Model 5418) for 1 minute. The flow through was discarded and 600 µl of DNA wash buffer was added. Centrifugation was done at 10,000 rpm for 1 minute. The flow through was discarded and the wash repeated. Clean amplicon DNA was eluted with 30 µl of a DNA elution buffer.
3.8 Sanger dideoxynucleotide sequencing of spa and MLST amplicons
containing Sephadex were transferred to a clean 96-well plate where 12 µl of the sequencing fragments were added and centrifuged at 2140 rpm (Eppendorf Centrifuge Model 5810) for 5 minutes. The plate containing the columns was discarded and 10 µl of Hi-Di formamide (Applied Biosystems) was added to each well before loading into the Applied Biosystems Genetic Analyzer 3500 sequencing machine for sequence determination.
3.9. IPlex massARRAY procedure 3.9.1 IPlex Mass array primer design
The SNPs derived from the MLST database have already been published and were included in the assay (Syrmis et al., 2011). The SNPs had been generated from the MLST database using the Minimum SNPs Software Version 2043 (Robertson et al., 2004). For this study, the sequences used to design primers for the MLST SNPs were downloaded from the staphylococcal MLST database: http://www.mlst.net. In addition to the MLST SNPs, the study adapted the MassARRAY technique and used it to test for the presence of virulence and resistance genes. Sequences for the primers used for conventional PCR assays were used to conduct a BLAST search and the gene sequences for the top hits were selected. Hypothetical (mock) SNPs were placed at known base positions within these gene sequences normally amplified by PCR assays.
Full DNA sequences for the virulence and resistance genes were downloaded from the NCBI GenBank database (www.ncbi.nlm.nih.gov/genbank). The regions amplified by conventional PCR assays were selected by performing DNA sequence alignments using respective forward and reverse primer sequences. Primers specific for the assay SNPs were designed using the Assay designer Software Version 3.2 from Agena Biosciences. All amplification primers had a 10-nucleotide tag (ACGTTGGATG) at the 5ʹ end in order to remove them from the observed mass window (4500-9000 Daltons) and eliminate their interference during spectrometric analysis. A summary of the primary and iPlex PCR assay designs is shown in Appendices 3 and 4.
The experiment was designed to assay for these targets in two multiplex reaction pools [pool 1=19 targets (Figure 3.4) and pool 2=4 targets (Figure 3.5)]. The iPlex chemistry is dependent on differential molecular masses between the unextended primer and its extension product. However, the inverse relationship that exists between peak intensity and mass leads to high mass primers having lower peaks in comparison to low mass primers. To correct for this and thus normalize peak intensities, a special dilution of the unextended primers (UEPs) is performed where the high mass primers are doubled in concentration in relation to low mass primers. The UEP spectra are shown in the Figures 3.4 and 3.5.
Figure 3.4: A spectrum of the adjusted unextended primers for the 19 gene targets in pool 1
Key: 1: hlg (Hemolysin gamma), 2: pvl (Panton-Valentine Leucocidin), 3: msrA
For these assays, the UEP concentrations were adjusted and the two pools were spotted on the MALDI-TOF mass spectrometer. The peak intensities for pool 1 showed moderate noise with the UEPs showing peaks at expected masses. Concentrations were doubled for the few that had lower peaks before the primer pool was used for the iPlex chemistry reactions. For pool 2, all the primers showed sharp distinct peaks with minimal noise and were reconstituted for the iPlex assays without further adjustment.
Figure 3.5: A spectrum of the adjusted unextended primers for the 4 gene targets in pool 2. Key: 20: vanA (vancomycin A), 21: arcC162, 22: pta294, 23: tpi243. The primers are arranged in order of increasing molecular mass. The mass window for the loci is between 4500-9000 Daltons.
3.9.2 Primary amplification PCR
PCR Buffer, forward and reverse primers at 0.1 µM each, 4 mM MgCl2, 500 µM
dNTP mix, 0.5 units of Taq polymerase and 10 ng of DNA template. PCR grade water was used to adjust the reaction mix to a final volume of 5 µl. All samples were analyzed alongside reference isolates (ATCC 43300, CO-34, 25213 and 25923) and negative controls (water). PCR conditions were set as follows: Initial denaturation at 95 0C for 2 minutes, 25 cycles of 95 0C for 30s, 56 0C for 30s, and 72 0C for 60s, and a final extension at 72 0C for 5 minutes.
3.9.3 Removal of unincorporated dNTPs
Deoxyribonucleotides (dNTPs) left from the primary amplification PCR are neutralized to prevent their participation in the second allele-specific primer extension PCR. A commercial reagent containing Shrimp alkaline phosphatase enzyme (SAP) was used to dephosphorylate unused dNTPs. 2µl of SAP cocktail which includes 0.5 units of the SAP enzyme in SAP buffer and sterile distilled water was added to the PCR product. The tubes containing the enzyme preparation were incubated at 37 0C for 40 minutes and then held at 85 0C for 5 minutes in order to denature the SAP enzyme.
3.9.4 IPlex reaction/Allele-specific primer extension PCR
The commercially available iPlex Gold chemistry reagent set from Agena Bioscience was used following the manufacturer’s instructions. The extension primers for the two reaction pools in these assays were adjusted and spotted on the mass spectrometer before being constituted for this step. 2 µl of the primer cocktail was added to the reaction well and the following conditions were set: initial denaturation at 94 0C for 30s, 40 cycles of one step at 94 0C for 5s with five sub cycles of 52 0C for 5s and 80
0
3.9.5 Final product clean up and conditioning
Before analysis, extension products were first conditioned using a commercially available resin from Agena Bioscience. The wells containing the clean resin and water were rotated for 15 minutes after which centrifugation at 5000 rpm for 5 minutes followed (Eppendorf Centrifuge Model 5810). 10 nl of the conditioned extension product was dispensed using the MassARRAY Nanodispenser RS1000 (Agena Bioscience) on to a 96-well spectroCHIP before spectrometric analysis.
3.9.6 Detection by Mass spectrometry
A MassARRAY Compact Analyzer machine (Agena Bioscience) was used for spectrometric detection. The SpectroAcquire program was used for data acquisition and was set at ten laser shots per raster position and a threshold of five good spectra per sample pad.
3.10 Data handling and analysis
Data on continuous variables such as age and drug use as well as categorical variables such as sex, in-/out-patient status, study site, presence or absence various virulence genes, methicillin resistance, specimen sources and infection source were entered on Microsoft Excel spreadsheet. Categorical variables were coded before the data was imported into Stata Statistical Software Version 11.0 (StataCorp, College Station, TX, USA) where various descriptive summaries were performed. For testing of statistical association between various virulence gene combinations and different clinical variables, linear logistic regression analyses were conducted where p-values ≤0.05 were considered significant.
Version 2.6.2 (Technelysium Pty) before consensus sequences were created using BioEdit Sequence Alignment Editor Version 7.2.5 (Hall, 1999). Consensus sequences were used to assign spa types using online Spa Type Finder/Identifier Software (spatyper.fortinbras.us). Spa types were further confirmed using the web-based Ridom Spa Server (spaserver.ridom.de). For MLST loci, consensus sequences were aligned with reference sequences for each locus using the online alignment tool, MAFFT Version 7 (https://mafft.cbrc.jp/alignment/server/) before being trimmed to correct lengths for each locus. Consensus sequences were then used to assign allele numbers for each locus on the web-based multilocus sequence database (www.mlst.net). The combination of 7 allele numbers for each isolate was then used to assign a sequence type (ST) on the MLST database.
CHAPTER FOUR
RESULTS 4.1 Distribution of virulence determinants
Genes for adhesin molecules (icaA and clfA) occurred more frequently compared to genes for toxins (pvl, sea and tsst). Intercellular adhesin gene (icaA) was present in 92.5% (50/54) of the isolates while the toxic shock syndrome toxin gene (tsst) was the least abundant, occurring in only 4% (2/54) of the isolates.
There was no isolate in which all the five genes were present whereas there were four isolates in which none of the genes was present. One isolate had not been tested for
clfA hence was excluded when examining the abundance of virulence genes. In general, about 85% (45/53) of the isolates had at least two virulence genes. Data on the presence of these genes is shown in figures 4.1 and 4.2.
Figure 4.1: Distribution of five S. aureus virulence factors among the 54 isolates. n=50
n=43
n=24
n=6
n=2 0
20 40 60 80 100
Icaa clfA pvl sea tsst
Oc
cur
ence
(%
)
Figure 4.2: A summary of the number of virulence genes detected in each S. aureus
isolate tested. About 85% of the isolates had at least two virulence genes.
Representative gel images for two of these 5 genes are shown in Figures 4.3 and 4.4.
Figure 4.3: A gel picture showing 770 bp amplicons for 10 isolates for icaA gene. Key: L-100 bp ladder, P- Positive control, N- Negative control, DNA samples are numbered 1-10
No genes 7.5% (n=4)
1 gene 7.5% (n=4)
2 genes 36% (n=19) 3 genes
43% (n=23) 4 genes 5.6% (n=3)
Expecte
d size
770 bp
600bp700bp 800bp
Figure 4.4: A gel picture showing the 980 bp amplicons for 10 isolates for clfA gene Key: L-100bp ladder, P- Positive control, N- Negative control, DNA samples are numbered 1-10
Virulence gene profiles for each of the isolates were created. Only 53 isolates were tested for the whole panel of genes as one isolate was not screened for clfA. The different virulence gene combinations in this collection of isolates are shown in Table 4.1. In total, nine combinations of genes were observed. The combination of icaA, clfA and pvl was the most common with 35.8% (19/53) of the isolates. The combinations of clfA, icaA and pvl and that of clfA and icaA collectively accounted for about 68% (36/53) of all the isolates tested.
L
P N 1 2 3 4 5 6 7 8 9 10L
Expect
ed size
980 bp
800bpTable 4.1: Different virulence gene combinations
* Of the 54 isolates used in this study, one isolate was not tested for one virulence gene hence was excluded from the analyses leaving only 53 isolates.
Possible associations between individual genes and different clinical characteristics such as period of drug use, presence or absence of drug use and in/outpatient status were explored using Chi-squared tests. For all the three parameters considered, no significant associations were observed (p>0.05) (data not shown).
Table 4.2: Logistic regression analyses between different virulence gene combinations and three markers of severity of infection
Logistic regression table for possible associations between different gene combinations and presence or absence of drug use, period of drug usage and in/outpatient status. P-values >0.05 were not considered significant.
and markers of severity of infections (drug use, long period of antibiotic use and admission as an in-patient).
Table 4.3: Logistic regression analyses between number of virulence genes and three markers of severity of infection