University of South Carolina
Scholar Commons
Theses and Dissertations
1-1-2013
Characterization of the Role of FRO6 in Metal
Homeostasis in Arabidopsis Thaliana
Margo Ellen Maynes University of South Carolina
Follow this and additional works at:https://scholarcommons.sc.edu/etd
Part of theLife Sciences Commons,Medicine and Health Sciences Commons, and thePhysical Sciences and Mathematics Commons
This Open Access Thesis is brought to you by Scholar Commons. It has been accepted for inclusion in Theses and Dissertations by an authorized administrator of Scholar Commons. For more information, please [email protected].
Recommended Citation
Characterization of the Role of
FRO6
in Metal Homeostasis
in
Arabidopsis
thaliana
by
Margo Maynes
Bachelor of Science University of South Carolina, 2009
Submitted in Partial Fulfillment of the Requirements
For the Degree of Master of Science in
Biological Sciences
College of Art and Sciences
University of South Carolina
2013
Accepted by:
Erin Connolly, Major Professor
Beth Krizek, Committee Member
Johannes Stratmann, Committee Member
© Copyright by Margo Maynes, 2013
D
EDICATIONThis thesis is dedicated to my wonderful family:
To my mother, Mary, for constantly supporting and encouraging me. Regardless
of the many ups and downs that come along with graduate school, there was always
someone there, whom believed that I could accomplish my goals. I’m so thankful for the
countless hours and sacrifices you made to help me achieve my dreams, I will always be
grateful.
To my grandmother, Ellen, for instilling in me the importance of attaining higher
education, your constant wisdom and guidance, support, love, I can think of no one better
to model my life after. Thank you for believing in me.
To my brother, Derrick, thank you for all your support and love.
Finally, to my sister, for never failing to bring a smile to my face, and for your
constant support and love.
A
CKNOWLEDGEMENTSI would like to thank some people that have helped and supported me through my
graduate studies:
I would like to thank my major Professor, Dr. Erin Connolly, for support,
wisdom, mentoring, and patience over the last three years. Thank you for helping me
realize my potential, I will always be grateful for the many that leadership has afforded
me.
I am also grateful to my committee members: Dr. Beth Krizek and Dr. Johannes
Stratmann. I really appreciate your advice and feedback.
I would also like to thank Dr. Lewis Bowman, and Dr. Caryn Outten for your
helpful advice and feedback.
Thanks to our collaborator: Dr. Mary Lou Guerinot (Dartmouth College) for
providing me with an amazing educational experience that I will never forget.
To my awesome co-workers: Grandon Wilson and Anshika Jain- thank you for
constant patience, guidance and support during our times in lab. I will always appreciate
those times and I’m glad that I can call you my friends.
To all my friends that I’ve met in graduate school: Amy, Han, CJ, Claire, Erika,
Jendayi, Nike, Varun, Grishma, Daniel, Hema, Chris, Christian, Kurt, and Anusha and
others that I may not have mentioned, it has been a pleasure to get to know each of you.
trials and tribulations of graduate school would have been very tough. I will be forever
grateful for all the help and encouragement that you have given me.
To Desire thank you for all your support and encouragement, it has meant so
much to me.
To my best friends since elementary school Krystal, Nakita, and Carey words
cannot express how much I appreciate your support and love. Thanks for reminding me
that I can have fun and be a graduate student as well, I love you all forever.
To my beautiful Godson Malcolm, I love you!
Again to my awesome family for all their love and support.
Most of all I am thankful to God, for saving, keeping, strengthening, challenging,
and blessing me! “I can do all things through Christ, who strengthens me!” Philippians
4:13
A
BSTRACTIron deficiency is the most common human nutritional disorder in the world
today, affecting approximately 2 billon people worldwide, almost a third of the world's
population. For most of the world's population, plant foods serve as the major source of
dietary iron. One approach that may contribute towards the solution of iron deficiency is
the development of crop plants that contain higher levels of bioavailable iron. This
project focuses on FRO6, a ferric chelate reductase in Arabidopsis thaliana that is
thought to reduce apoplastic iron for transport across the plasma membrane in leaf cells.
We hypothesize therefore that FRO6 controls iron content of leaves and provides iron
needed for photosynthesis, a vital process in plants. In order to examine the proposed
function of FRO6, we obtained two FRO6 loss-of-function lines, fro6-1 and fro6-2 and
compared these lines to the WT to determine the role of FRO6 in iron homeostasis in
plants. fro6-1 contains an insertion in the 8th intron of the gene, while fro6-2 contains an
insertion in the 8th exon of the gene. We demonstrate that fro6-1 and fro6-2 are both
homozygous for the insertion. Despite this, fro6-1 and fro6-2 mutants express FRO6
transcript, possibly because the insertion does not destabilize the transcript. Leaf disks
prepared from fro6-1 and fro6-2 show a significant decrease in ferric reductase activity
compared to WT leaf disks, indicating a putative role for FRO6 in reduction of apoplastic
Fe in leaves. Consistent with the fact that FRO6 is not expressed in roots, fro6-1 mutant
The fro6-1 plants show a reduced flowering time as compared to WT plants. Taken
together, these data indicate that FRO6 is likely responsible for mediating the reduction
T
ABLE OFC
ONTENTSDEDICATION ... iii
ACKNOWLEDGEMENTS ... iv
ABSTRACT ... vii
LIST OF FIGURES ...x
LIST OF ABBREVIATIONS ... xi
LIST OF TABLES ... xii
CHAPTER 1: IRON UPTAKE, TRAFFICKING AND HOMEOSTASIS IN ARABIDOPSIS thaliana ...1
CHAPTER 2: CHARACTERIZATION OF THE ROLE OF FRO6 IN METAL HOMEOSTASIS IN ARABIDOPSIS Thaliana ...21
L
IST OFF
IGURESFigure 1.1 Strategy I vs. Strategy II ...20
Figure 2.1 Genotyping of WT and fro6-1 mutants ...35
Figure 2.2 Genotyping of WT and fro6-2 mutants ...36
Figure 2.3 Transcript Analysis ...37
Figure 2.4 Digestion of RT-PCR product with HindIII ...38
Figure 2.5 Leaf Discs Ferric Reductase Activity of fro6-1 mutants ...39
Figure 2.6 Leaf Discs Ferric Reductase Activity of fro6-2 mutants ...40
Figure 2.7 Root Ferric Reductase Activity ...41
Figure 2.8 Flowering time...42
Figure 2.9 Average Growth Rate of Roots grown on +/- Fe medium ...43
L
IST OFA
BBREVIATIONSAHA ... ATPase
DMA ... Deoxymugeinic Acid
DMAS ... Deoxymugeinic Acid Synthase
FER ...Ferritin
FRO ... Ferric Reductase Oxidase
ICP-MS ... Inductively Coupled Plasma Mass Spectroscopy
IRT ... Iron Regulated Transporter
MA ... Mucigenic Acid
NA ... Nicotianamine
NRAMP ... Natural Resistance Associated Macrophage Protein
PIC ... Permease in Chloroplasts
PS ... Phytosiderophore
SAM ... S-Adenosyl Methionine
SMF... Suppressor of mif1-1
VIT ... Vacuolar Iron Transporter
YSL ... Yellow Stripe Like
L
IST OFT
ABLESTable 2.1 Arabidopsis FRO Family of Metalloreductases...26
CHAPTER
1
I
RONU
PTAKE,
T
RAFFICKING AND HOMEOSTASIS IN ARABIDOPSISthaliana
For the majority of organisms, iron (Fe) is a necessary micronutrient for
maintaining life. Iron is important because it serves as a cofactor in proteins that are
involved in integral cellular functions, such as DNA replication and repair,
photosynthesis, electron transport, and nitrogen assimilation (Jeong and Guerinot, 2009).
Iron’s many valuable properties in life arise from the fact that it is a transition metal,
meaning it has the ability to change redox state (the accepting and donating of electrons),
which makes it an ideal candidate for participation in the electron transport chain of
respiration and photosynthesis. Fe associated with proteins is most commonly found as
Fe-S clusters or heme groups.
The properties that make iron so vital for life also make it potentially harmful to
life. Copious amounts of ferrous iron are harmful, because this form of Fe has the
potential to generate reactive oxygen species (ROS), via the Fenton reaction. The Fenton
reaction involves ferrous iron Fe2+ interacting with H2O2 and O2 within the cell to
generate superoxides and/or hydroxyl radicals. These ROS are strong oxidants that can
cause serious damage to DNA, proteins, and lipids, and therefore greatly decrease the
Iron is the fourth most abundant element in the earth’s crust. But the majority of
the iron that is present in the soil is not readily available for use by plants. In particular, in
aerobic soils at neutral or alkaline/basic pH, Fe has low bioavailability.
In these soils, Fe forms insoluble oxyhydride polymers that cannot be used by
some plants (Jeong and Guerinot, 2009). Alkaline soils account for approximately one
third of all agricultural lands in the world, so Fe limitation is a major problem in
agricultural settings (Nano and Strathmann, 2006).
According to the World Health Organization, iron deficiency is the most
common nutritional disorder in the world today, affecting over approximately 2 billion
people (http://www.who.int/nutrition/topics/ida/en/index.html). While plant food serve as
the major source of dietary iron for humans and other mammals (Connolly et al., 2002),
plants are generally considered poor sources of iron. More iron rich foods include red
meat, which is considered a better source of iron versus plants for primarily two reasons.
First, plant foods contain less iron than meat. Secondly, not only is there less iron in
plants than in meat but the iron that is present is less bioavailable than the iron found in
meat (Miret et al., 2003). A diverse plant-based diet or eating meat may be a solution to
this problem, but these alternatives are not plausible in some parts of the world, due to
lack of affordability or conflict with religious or cultural beliefs (Miret et al., 2003).
Since plant-based diets seem to be a significant contributor to this nutritional deficit
pandemic, there is great interest in bioengineering plants to have enhanced amounts of
understanding how plants uptake, transport, and store iron. A clearer understanding of
these mechanisms may lead to the development of iron-enriched crops that may be used
to combat iron deficiency anemia.
To achieve this goal, we must first understand the mechanisms of plant iron
uptake, transport, and storage. Plants have evolved two strategies to increase acquisition
of iron from the soil under limiting conditions. Strategy I plants include all non-grasses,
such as tomato, pea and Arabidopsis thaliana, while Strategy II plants include all the
grasses, such as rice, maize, wheat and barley.
Iron Uptake from Soil Strategy I
When iron is limiting, Strategy I plants employ a three-pronged approach to
mediate the uptake of iron by the roots (see Figure 1.1). This system is similar to that of
the iron uptake system found in the yeast Saccharomyces cerevisiae, which uses a
two-step iron uptake strategy, in which Fe3+ iron is reduced to Fe2+ by FRE1 and then
transported into the cell by a high affinity transporter (Askwith, 1994). In Strategy I
plants, protons (H+) are first pumped out into the rhizosphere. This step is crucial,
because it serves to acidify the soil and make the ferric Fe3+ iron more soluble
(Mukherjee et al., 2006). A one unit drop on the pH scale corresponds to 1000-fold
increase in Fe solubility (Palmer and Guerinot, 2009). The family of genes thought to be
responsible for proton extrusion in the rhizosphere is the AHA (Arabidopsis H+ ATPase)
family. AHA2, along with AHA1 and AHA7 are all up- regulated in iron deficient
extruding protons in the Strategy I mechanism (see Figure 1.1) (Santi and Schmidt, 2009;
Hindt and Guerinot, 2012).
Next, the solubilized ferric iron is reduced to ferrous Fe2+ iron by FRO2, which is
the principle root surface ferric chelate reductase (or Ferric Reductase Oxidase)
responsible for reduction of rhizosphere iron (see Figure 1.1). FRO2 is the founding
member of the FRO family and the first member to be fully characterized. The
Arabidopsis FRO family includes 8 genes. The FRO family of genes was identified due
to their similarity to the human respiratory burst NADPH oxidase (gp91phox) and to the
yeast ferric chelate reductase (Yi and Guerinot 1996). Additionally, FRO2 was found to
map to same locus as frd1, a mutant which lacks ferric reductase activity. FRO2 was able
to functionally complement or rescue the frd1 mutant phenotype proving that FRO2
encodes the root surface reductase (Robinson et al., 1999). FRO2 is expressed primarily
in the roots and is localized to the root plasma membrane (Mukherjee et al., 2006).
FRO2 is predicted to contain eight hydrophobic domains that form helices that
span across the membrane. Two of the transmembrane helices (4 and 6), are believed to
each contain two conserved histidines which are thought to coordinate two heme groups.
Also, within FRO2 there is a region that is highly conserved in all flavocytochrome
family members. It is thought that FRO2 oxidizes NADPH in the cytoplasm and then
transfers the electrons from NADPH through the two heme groups and subsequently
across the membrane to reduce Fe3+ to form Fe2+ (Robinson, 1999 ; Schagerlof 2006).
This step is considered to be the rate-limiting step in iron uptake from the soil (Connolly,
Finally, ferrous iron is transported across the plasma membrane into the cell via
IRT1 (iron-regulated transporter 1) (see Figure 1.1) (Connolly et al, 2002; Vert et al.
2002). IRT1 was discovered using yeast complementation studies (Eide et al., 1996). In
addition to Fe, IRT1 can transport zinc, manganese, cobalt, and cadmium (which is toxic
at low levels) as well.
Expression of IRT1 is crucial for survival of the plant, as evidenced by IRT1
loss-of-function mutants, which show seedling lethality unless they are provided with excess
iron (Vert et al., 2002). Experimentally, it has been shown that after 3 days of growth on
iron deficient medium, expression of IRT1 is greatly increased in the plasma membrane
of the roots. Additionally it has also been shown that IRT1 mRNA and protein are quickly
degraded and are undetectable just 12 hours after iron is resupplied to plants (Connolly et
al. 2002).
Regulation of Strategy I
FRO2 and IRT1 are both iron deficiency response genes that are controlled by the
iron responsive transcription factor FIT (FER-like Iron- deficiency- induced transcription
factor). FIT was discovered in Arabidopsis based on its sequence similarity to the tomato
FER protein and it is a basic helix-loop-helix (bHLH) transcription factor (Ling 2002;
Bauer et al, 2007). FIT, like its tomato ortholog, is needed to induce iron-deficiency
responses (Colangelo, 2004). Under iron-deficient conditions, there is high induction of
FIT in the roots. Similar to irt1 mutants, fit mutants exhibit chlorosis and do not produce
seed, unless supplied with exogenous iron (Colangelo and Guerinot, 2004; Vert, 2002).
the roots of the fit mutant (Colangelo and Guerinot, 2004). On the other hand, IRT1
shows post-transcriptional regulation by FIT, because in fit, IRT1 mRNA is present, but
there is no accumulation of the IRT1 protein (Colangelo and Guerinot, 2004).
Strategy II
Strategy II is the mechanism by which the grasses acquire iron and it is
deemed much more efficient than Strategy I because Strategy II plants can grow on
calcareous soils (Römheld, 1987). Strategy II plants respond to iron deficiency by
synthesizing phytosiderophores (PS) in the roots, and secreting them out into the
rhizosphere. PSs chelate or bind Fe3+ with a very high affinity (Chu et al., 2010). These
Fe(III)-PS complexes are then transported across the root plasma membrane for use by
the plant (see Figure 1.1) (Chu et al., 2010).
Nicotianamine serves as the precursor for all phytosiderophores. Nicotianamine is
a non-proteinogenic amino acid. Nicotianamine synthetase synthesizes NA by
condensing three molecules of S-adenosyl methionine. Then, nicotianamine
aminotransferase converts NA into a 3”-ketoacid. Next DMA synthase (DMAS) reduces
the 3”-ketoacid (Dell’mour, 2010) to create mucigenic acid (MA) or phytosiderophores.
The two most common muginenic acids are hydroxymugineic acid (HMA) and
deoxymugineic acid (DMA) (Dell'mour, 2010).
After the phytosiderophores have been pumped out into the rhizosphere, they
chelate ferric iron, and now must be transported back into the plant (see Figure 1.1)
(Nozoye, et al., 2011). In 2001, Curie et al identified the transporter needed to transport
the Fe(III)-PS complexes through the characterization of the yellowstripe1 (ys1) mutant
which shows reduced growth on iron deficient media, but when transformed with WT
ZmYS1 and supplied with Fe(III)-DMA, the transformed mutant yeast strain was able to
grow normally. On the other hand, growth was still limited if the media included
Fe(III)-citrate as the substrate. So, the YS1 transporter is specifically able to transport the
phytosiderophore bound Fe (Fe-DMA) (Curie, 2001). Furthermore, ZmYS1 was shown to
be expressed in both iron deficient roots and shoots, indicating that YS1 may play a role
in iron acquisition from the soil and iron transport to the shoots (Roberts, 2004).
In Strategy II plants, the biosynthesis of PS and Fe(III)-PS transporter had been
well characterized, but the actual PS effluxor had remained a mystery. However, recent
studies have identified this efflux protein (Nozoye et al., 2011). TOM1 of rice and
HvTOM1 from barley are both members of the major facilitator family (MFS) and both
were shown to function in efflux of PSs (Nozoye et al., 2011). When expressed in
Xenopus oocytes, TOM1 and HvTOM1 were both able to efflux 14C-labeled
deoxymugineic acid but did not transport 14C-labeled NA, which indicates that TOM1
and HvTOM1 specifically efflux the phytosiderophore DMA (see Figure 1.1).
Iron Trafficking in Plants
The FROs- metalloreductases
In Arabidopsis, there are eight FROs named FRO1-8. Due to their subcellular
localization and expression patterns and their sequence similarity to FRO2, other FROs
are believed to function to reduce Fe in different tissue of plants and in different
subcellular compartments. Ferric reductase activity has been reported in leaves of both
sunflowers (de la Guardia, MD and Alcantara E., 1996) and Vigna unguiculata
that Fe needs to be reduced again before entering leaf cells. Only FRO2 and FRO7 have
been fully characterized, while FRO4 and FRO5 have been partially characterized. FRO7
localizes to the chloroplast (Jeong et al., 2008) and is highly expressed in all green aerial
portions of the plant (Mukherjee et al., 2006). Chloroplasts isolated from fro7
loss-of-function mutants contains 33% less Fe than WT (Jeong and Guerinot, 2009). Further,
fro7 chloroplasts show 75% less ferric chelate reductase activity than WT (Jeong et al.,
2008). This indicates that FRO7 is important for providing the large amount of Fe that is
needed by the chloroplast.
Recently, two additional FROs have been partially characterized. FRO4 and
FRO5 are expressed in both roots and shoots, and both localize to the PM (Mukherjee et
al., 2006; Bernal et al., 2011). Recently, FRO4 and FRO5 have both been shown to be
FRO4 and FRO5 have been shown to be under control of the transcription factor
SPL7 (SQUAMOSA Promoter Binding Protein-Like 7), which is the master regulator Cu
deficiency responses (Bernal, et al., 2011). The promoters of FRO4/FRO5 both contain
multiple copies of the GTAC core motif, to which SPL7 can bind under Cu deficient
conditions (Bernal, et al., 2011). A fro4fro5 double mutant is unable to reduce Cu at the
root surface. Additionally, it was shown that high affinity Cu uptake in the roots first
requires reduction of Cu2+ to Cu1+ by FRO4/FRO5. Taken together, this data indicates
that FRO4/FRO5 function redundantly as Cu chelate reductases.
There remain four FROs to be characterized; FRO1, FRO3, FRO6, and FRO8. Of
these remaining FROs, FRO3 and FRO8 both localize to mitochondria. FRO3 is
in the shoots (Mukherjee et al., 2006). FRO3 and FRO8 are believed to be responsible
for reducing Fe for subsequent uptake by mitochondria.
FRO6 shares a high level of sequence similarity with FRO7 (approximately 95%
amino acid sequence similarity) (Wu et al., 2006). FRO6 has been shown to localize to
the plasma membrane in protoplasts (Jeong and Guerinot, 2009). FRO6 is regulated in
light-dependent manner, with its promoter containing many light responsive elements
(LREs), such as the I-box, GT1, and GATA motif, which indicates that FRO6 may be
indirectly involved in photosynthesis, perhaps through delivery of Fe to photosynthetic
complexes (Feng et al., 2006). Li et al. expressed the Arabidopsis FRO6 gene under the
control of a 35S promoter in tobacco plants (Li et al., 2010). These transgenic tobacco
plants showed increased ferric reductase activity in leaves grown under both iron
sufficient and iron deficient conditions compared to WT plants grown in the same
conditions (Li et al., 2010). The 35S::FRO6 plants also contained higher levels of Fe 2+
and chlorophyll, compared to WT plants (Li et al., 2010). Taken together, this data
suggests that FRO6 is predicted to be responsible for reducing apoplastic iron for
transport across the plasma membrane in leaf cells. The functional characterization of
FRO6 is the focus of this thesis, as described in Chap 2.
Additional Transporters of Iron
There are additional known transporters of iron that exist in plants, beside IRT1
and YS1. Arabidopsis IRT2 has high amino acid sequence similarity to the main iron
transporter in Strategy I plants, IRT1. IRT2 is also able to alleviate the Fe- limited growth
phenotype of the fet3fet4 yeast strain on iron deficient media, like IRT1. Also like IRT1,
IRT1, IRT2 does not transport manganese or cadmium. So IRT2 is more specific in its
transport of metals (Vert, 2002). Additionally, the IRT2 mutant, irt2, does not exhibit any
signs of iron deficiency. Furthermore, IRT2 cannot rescue the chlorotic and Fe-deficient
growth phenotypes of the irt1-1 mutant and it is not localized to the plasma membrane
like IRT1, but instead to vesicles within root epidermal cells (Vert et al., 2009). There are
many ideas about the precise function of IRT2 and one interesting explanation proposes
that IRT2 serves as a “proactive adaptation” (MacDiarmid et al. 2003) where IRT2 acts
to sequester excess Fe that is produced when IRT1 is induced (Vert et al., 2009).
However more work needs to be done to support this idea (Conte and Walker 2011).
There is also another family of iron transporter genes called the NRAMPs
(Natural Resistance Associated Macrophage Protein). The yeast SMF (Suppressor of
mif1-1) gene and the mammalian DMT1 are both NRAMP homologs, and both have been
shown to participate in metal uptake. Arabidopsis contains six NRAMP genes, and half
of them (NRAMP1, NRAMP3, and NRAMP4) can transport iron when expressed in yeast
(Curie et al., 2000). Additionally, like IRT1 and IRT2, some NRAMPs are up-regulated
during times of iron deficiency (Curie et al, 2000).
Intercellular Transport of Fe in Plants
Once iron has been taken up into root cells, it undergoes lateral movement from
the root epidermal cells to the xylem and then is moved to the green above-ground
portions of the plant, where it is needed in great quantities for photosynthesis. The
process of transporting iron from the roots to shoots is thought to involve organic acids,
such as citrate, which bind iron in the xylem and carry it to the shoots (Rellán-Alvarez,
and Fe3+, is present in both Strategy I and Strategy II plants, and these Fe-NA complexes
are found in the vasculature of plants (Chu et al., 2010). Iron is transported to the root,
flower, seeds, and other parts of the plant via the phloem (Palmer and Guerinot, 2009).
Vascular Transport of Fe
Citrate is thought to be the major binder of iron in the xylem because the pH of
xylem favors Fe(III)-citrate complexes (Curie et al., 2009). Additionally, there is
evidence that Fe moves from roots to shoots as Fe(III)-citrate (Tiffin, 1966). Analogs of
xylem sap show that Fe and citrate co-migrate in paper electrophoresis.
Indeed,"Theoretical calculations that take into account the known metal chelators
(organic acids and amino acids including nicotianamine) ... suggest that citrate will be the
major complexor of Fe in the xylem” (Conte and Walker 2011). Recently, Fe-complexes
that occur in nature were identified as oxo-bridged tri-Fe(III), tri-citrate (FeCit3) using
HPLC-ICP-MS to analyze the xylem sap of tomatoes (von Wiren et al., 1999;
Rellan-Alvarez et al., 2008; Conte and Walker, 2011). The presence of Fe(III)-complexes in
xylem exudates suggests that Strategy I plants reoxidize the reduced Fe back to the ferric
form once it crosses the plasma membrane of root epidermal cells.
Two mutant lines have provided significant insight into transport of Fe within the
xylem. The chloronerva mutant, which lacks the single NAS gene that encodes
nicotianamine synthase and thus lacks NA synthesis, shows elevated levels of citrate in
the xylem sap (Pich et al., 2001). The Arabidopsisfrd3 mutant contains less xylem citrate
and accumulates Fe at high levels in the root, which indicates that FRD3 is required for
the proper transport of Fe across long distances (Rogers and Guerinot 2002). FRD3
protein family and is thought to function in the efflux of citrate to the xylem. It is
localized to the root pericycle and cells around the vasculature. Thus, FRD3 is thought to
release citrate into the root xylem, where it complexes with Fe so that it may be
translocated to the aerial portions of the plants (Rogers and Guerinot, 2002). FRD3 is also
strongly expressed in the seed and flower,indicating a possible role in efflux of citrate to
the apoplast for transport of iron in the xylem of flowers (Roschzttardtz et al., 2011). In
the Arabidopsis frd3 mutant, iron accumulates in the cell directly next to the vasculature,
where FRD3 is localized, suggesting that there is blockage of Fe entering the vasculature
(Green and Rogers, 2004).
When FRD3 was expressed in the heterologous Xenopus oocyte system, it was
able to facilitate efflux of citrate. In rice, there is FRD3-like gene FRDL1, (FRD3-like1),
that has 57% sequence similarity to FRD3 and has an analogous function to FRD3 and
similar phenotypes to the frd3 mutant (Yokosho et al., 2009). Although Strategy I and
Strategy II plants have differing Fe uptake mechanisms from the rhizosphere, both types
of plants seem to share similar Fe translocation systems (Conte and Walker, 2011).
At this time, the mechanism for loading iron into the xylem is not yet entirely
known. However, recently, a likely candidate has been identified and the name of this
protein is FPN1 (ferroportin). In Arabidopsis, the ferroportin family includes three genes:
FPN1/IREG1 which localizes to the plasma membrane (Morrissey et al., 2009),
FPN2/IREG2, which localizes to the vacuolar membrane (Schaaf et al., 2006; Morrissey
et al., 2009), and FPN3/MAR1/RTS3/IREG3, which localizes to the chloroplast envelope
(Conte et al., 2009). In mammals there are ferroportins called Metal Transporter Protein 1
hepatocytes (Muckenthaler et al., 2008; Conte and Walker 2011). The functional activity
of FPN1/IREG1 could not be determined, because FPN1 protein does not localize to the
plasma membrane in the yeast heterologous system (Schaaf et al., 2006). But the closely
related FPN2 can transport Ni, Co, and Fe from the cytoplasm to the vacuole (Morrissey
et al., 2009). FPN1 is localized to the “stele of the root, root-shoot junctions of seedlings
and leaf veins, indicating a role in efflux into apoplast and or xylem” (Morissey et al.,
2009).
Transport of Fe within the Shoot
Once Fe travels to the leaf apoplast via the xylem, it must be transported across
the leaf plasma membrane (Conte and Walker, 2011). The importance of citrate in the
proper transport of iron in xylem has been demonstrated in the frd3 mutant, which
accumulates iron in the extracellular space, as noted above (Green and Rogers, 2004).
However the role that citrate plays in xylem unloading remains a mystery. In
Arabidopsis, members of the Yellow Stripe-Like (YSL) family, which transport Fe2+
nicotianamine complexes, are thought to be the principal "mediators" of uptake of Fe
from the xylem (Conte and Walker, 2011).
Fe is thought to be transported through the phloem bound to nicotianamine (NA).
NA is synthesized by both Strategy I and Strategy II plants and is a precursor to the PS
found in the Strategy II grasses. Thus NA is structurally similar to PS, so it can chelate
Fe3+, along with other metal species including Fe2+, Cu2+, Ni2+, Co2+, Mn2+, and Zn 2+
(Chu et al., 2010). NA is found in both shoots and roots (Stephan et al., 1987; Conte and
Walker, 2011) and both xylem and phloem (Schmidke and Stephen, 1995; Pich and
Identification of the tomato NA synthesis deficient mutant, chloronerva,
demonstrated the importance of NA in iron translocation. The chloronerva mutant shows
severe interveinal chlorosis of young leaves(Stephan and Grun, 1989; Higuchi, 2001).
The interveinal chlorosis phenotype indicates that the plant is iron deficient and the
mutant shows constitutive induction of the iron deficiency uptake response(i.e.
upregulation of AHA2, FRO2, and IRT1) (Becker et al, 1992). However, the mature
leaves surprisingly contain an excess of iron (Becker et al. 1992). So the fact that there is
more iron in the mature leaf tissue and less Fe in the younger tissues suggests that NA
plays a role in proper distribution of Fe (Conte and Walker, 2010).
As noted above, when Fe is traveling through the phloem it is believed to
be chelated or bound by NA (Conte and Walker, 2011). The YSL family of proteins is
thought to be responsible for loading and unloading of these Fe-NA complexes. The
YSLs are a subfamily of oligopeptide transporters (OPT) (Curie et al, 2009). These genes
were identified based on their high sequence similarity to YS1, the PS-Fe(III) transporter
in Strategy II plants (Curie et al, 2009). YSLs are expressed in a wide variety of plants
including gymnosperms, mosses, lycopods, ferns, monocots and dicots (Conte and
Walker, 2011). YSLs have been shown to transport various metal-NA chelates as
substrates (DiDonato et al., 2004, Koike et al., 2004; Roberts et al., 2004; Schaaf et al.,
2004; Lejean et al., 2005; Murata et al., 2006; Gendre et al., 2007; Harada et al., 2007).
YSL1 is a well-characterized member of the YSL family. YSL1 is expressed in
the shoot vasculature, siliques, pollen grains and maturing seeds (Lejean et al., 2005).
The ysl1 mutant contains less iron in its seeds and these seeds show a reduced
iron into the seed (Waters et al., 2006). Additionally, another member of the YSL family,
YSL3 also localizes to the shoot vasculature and pollen grains (Waters et al., 2006). The
double mutant ysl1, ysl3, contains less Fe, Cu, and Zn in leaves, which indicates roles for
YSL1 and YSL3 as metal transporters in leaves (Waters et al., 2006). Expression of
YSL1, YSL2, and YSL3 is suppressed under iron deficiency. The opposite holds true for
the iron uptake genes (YS1, FRO2 and IRT1). Taken together, these data suggest that the
YSL family is responsible for maintaining iron homeostasis via intercellular transport of
Fe-NA complexes (Conte and Walker, 2011).
Intracellular Iron Transport
Once Fe has reached the appropriate tissue and crossed the plasma membrane, it
must be distributed to various subcellular compartments to be used and/or stored. Two
major organelles that require large amounts of Fe are the chloroplast and mitochondria
(Conte and Walker, 2011). In addition, iron may be stored in the vacuole (Kim et al.,
2007).
The Chloroplast
Almost 90% of leaf cell Fe is found in the chloroplast. Much iron is found here,
because this is the organenelle where photosynthesis takes place. Many photosynthetic
processes, complexes, and proteins require Fe, including the photosynthetic complexes,
chlorophyll synthesis, and heme (Kim and Guerinot, 2007). Additionally, Fe is needed as
a co-factor in the enzyme Fe-SOD, which prevents oxidative damage by converting ROS
to H202, reducing the number of harmful superoxides that are normally formed during the
Ferritin in plants, much like ferritin found in animals, is involved in storage of iron. Plant
ferritins can store up to 4500 atoms of Fe and are localized to the plastids (chloroplast)
(Hintze and Theil, 2006). In Arabidopsis, there exist four FER genes. FER1 is believed to
be involved in senescence, because the age-dependent rate of senescence was increased
in the fer1 mutants, due to toxic accumulation of ROS. All four ferritins (FER1-4)
localize to the chloroplast and have been shown to function primarily to protect the plant
from oxidative damage rather than in storage of Fe (Ravet, et al., 2008).
Recently, transport of Fe into the chloroplast has been elucidated. Transport into
the chloroplast involves two main components: FRO7 and PIC1. As noted above, FRO7
belongs to the FRO family of ferric chelate reducatses. It is highly expressed in all green
aerial tissues and is localized to the chloroplast membrane. In Arabidopsis, fro7 mutants
germinate on alkaline soils, but quickly die (Jeong et al., 2008). Chloroplasts isolated
from fro7 plants show 75% less ferric chelate reductase activity than WT. They also have
less iron than WT chloroplasts, which indicates that FRO7 plays a major role in acquiring
Fe for the chloroplasts (Jeong et al., 2008).
In recent years, the chloroplastic Fe transporter has been identified as PIC1
(Permease in Chloroplast 1). PIC1 is a permease-like protein in cyanobacteria (Duy, et
al., 2007). PIC1 was first identified as a part of a “protein-conducting channel” on the
inner-envelope of the chloroplast (Teng, Y et al., 2006). However it was shown to be able
to complement the yeast iron uptake mutant fet3fet4 . Additionally, the pic1 mutant
shows phenotypes that are indicative of compromised iron transport. For instance, the
It is not known whether or not PIC1 transports Fe2+ or Fe3+ or some other molecule, and
the precise role of PIC1 remains unclear (Jeong and Guerinot, 2009).
Mitochondria
Mitochondria, like chloroplasts, require a high amount of iron (Briat, 2007). As
previously mentioned, iron serves as a cofactor in the electron transport chain of
respiration. Additionally, Fe-S clusters are constructed in mitochondria, as well as in
chloroplasts. FER4 dually localizes to mitochondria and to the chloroplast and is thought
to have the same function as the chloroplastic ferritins FER1, FER2, and FER3, which is
to store iron safely in a bioavailable form and to therefore protect cells from oxidative
stress (Taratino, 2010). In recent years, the transporter responsible for transporting Fe
into the mitochondria has been identified. MIT was discovered using through screening
of a T-DNA (transfer DNA) library to identify rice T-DNA lines that exhibited iron
deficiency symptoms. MIT is a member of the mitochondrial solute carrier family (MSC)
and members of this family are known to localize to the inner mitochondrial membrane
and also to transport a diverse variety of substrates, including Fe (Kunji and Robinson,
2006). MIT function is essential for survival, as homozygous knockouts for MIT are not
viable (Bashir et al., 2011). MIT was able to rescue the growth phenotype of
Δmrs3Δmrs4 yeast, which has defective transport of iron into the mitochondria. The
MIT-knockdown, mit-2, shows a reduced growth phenotype, although it accumulates excess
iron. Moreover, there was a decrease in aconitase activity in both the cytosol and
mitochondria, which indicates that Fe-S cluster formation is compromised in mit-2 plants.
Taken together, these results point to MIT as the protein responsible for transporting iron
Vacuoles
The vacuole is a critical compartment for storage and sequestration of iron within
plants (Lanquar et al., 2005; Kim et al., 2006). VIT1 has been shown to transport Fe into
vacuole (Kim et al., 2006). Expression of VIT1 in yeast was able to rescue the yeast
ccc1(Ca2+cross complementer 1) mutant, because there was an increase in the amount of
Fe in the vacuoles, which suggests that VIT1 functions in transporting iron into the
vacuole (Kim, et al., 2006). VIT1 is expressed highly during the development of seeds,
and vit1 mutants cannot survive under Fe-limiting conditions, such as alkaline soil (Kim
et al, 2006).
Remobilization of Fe from the vacuole is another important part of iron
metabolism in plants. Two members of the NRAMP family have been shown to aide with
this process. NRAMP3 and NRAMP4 both export Fe from the vacuoles (Kim et al,
2006). Both NRAMP3 and NRAMP4 are up-regulated under iron deficient conditions
(Lanquar et al, 2005). Neither nramp3 nor nramp4 single mutants show phenotypes,
when grown on iron deficient medium. However, the double mutant nramp3nramp4 does
not germinate under iron deficiency (Lanquar et al., 2005). Interestingly, the mutants do
not contain less iron that WT seeds, but electron microscopy shows that nramp3nramp4
plants accumulate Fe in the vacuole, suggesting that NRAMP3 and NRAMP4 play a role
in exporting Fe from the vacuole (Jeong and Guerinot, 2009).
A thorough understanding of the mechanisms that regulate metal homeostasis is
critical to generating iron-enriched biofortified crops. This goal will be attainable by
continual in- depth study and analysis of the ferric reductase oxidases, transporters,
progress has been made to elucidate the molecular mechanisms of Fe homeostasis, but
much remains unknown. The focus of this thesis is the role of FRO6 in reduction of Fe by
Figure 1.1 Strategy I versus Strategy II Iron Uptake Mechanism. (Adapted from Kobayashi and Nishizawa, 2012). Strategy I plants (all non-graminaceous dicots) use a Reduction Strategy, where Fe is reduced by FRO2,
YS1
CHAPTER 2: Characterization of the Role of FRO6 in Metal
Homeostasis in
Arabidopsis thaliana
Introduction
For the majority of organisms, iron (Fe) is essential for life. This is because it acts
as a cofactor in many proteins involved in replication and repair of DNA, photosynthesis,
and respiration (Jeong and Guerinot, 2009). Although iron is required for many cellular
processes, over accumulation of iron generates toxic hydroxyl radicals via the Fenton
reaction (Halliwell and Gutteridge, 1992). Even though iron is abundant in the soil, it is
not readily available for use by plants in aerobic soils at neutral or basic pH, where it
forms insoluble oxyhydroxide polymers (Jeong and Guerinot, 2009). Alkaline soils
account for approximately one third of all agricultural lands in the world, so iron
deficiency is a major problem that we face in the world today (Nano and Strathmann,
2006). Indeed, plants grown under iron deficient conditions often exhibit yellowing or
chlorosis of the leaves (Briat and Lobreaux, 1997) and reduced crop yields (Guerinot and
Yi, 1994). According to the World Health Organization, iron deficiency anemia is the
most common nutritional disorder in the world today, affecting over approximately 2
billion people. Plants serve as the major source of dietary iron for humans and other
mammals (Connolly et al., 2002). So, there is great interest in understanding the
mechanisms by which plants uptake and regulate iron.
Strategy I plants include all non-grasses, such as tomato, soybean and the model
plant Arabidopsis thaliana, while Strategy II plants include all the grasses, including rice,
maize and wheat. When iron is limiting, Strategy I, plants employ a three-step process to
mediate the uptake of iron in the roots. In the first step, protons are pumped out into the
rhizosphere by an ATPase; this step serves to acidify the soil and make the ferric (Fe3+)
iron more soluble (Vert, 2002; Eide et al., 2006; Connolly and Walker, 2008). Then, the
solubilized ferric iron is reduced to ferrous (Fe2+) by FRO2 (ferric reductase oxidase),
which is the principle root ferric chelate reductase and a member of the FRO family of
genes. Finally, ferrous iron, is transported across the plasma membrane into the cell via
IRT1 (iron-regulated transporter 1) (Eide et al., 1996; Vert et al., 2002; Connolly et al,
2002). Strategy II is deemed much more efficient, than Strategy I. Strategy II plants
respond to iron deficiency by synthesizing phytosiderophores (PS) in the roots, and
secreting them out into the rhizosphere. PSs chelate or bind Fe3+ with a very high affinity
(Chu et al., 2010). These Fe(III)-PS complexes are then transported across the plasma
membrane by the YS1 (yellow stripe 1) iron transporter (Chu et al., 2010) (see Figure
1.1).
In Strategy I plants, IRT1 is the transporter that is responsible for transporting
iron and other bivalent metal cations across the plasma membrane. Its expression is
crucial for survival of the plant, as the irt1 loss-of-function line displays seedling lethality
(Vert et al., 2002). Experimentally, it has been shown that after 3 days of plants growth
on iron deficient medium, expression of IRT1 is greatly increased. Additionally it has
also been shown that IRT1 mRNA and protein are quickly degraded, after resupply of Fe
Similarly, FRO2 is also transcriptionally up regulated under iron deficiency
(Connolly et al., 2003). FRO2 is the main ferric chelate reductase responsible for
converting ferric iron to ferrous iron, a pivotal and rate limiting step for transport of iron
across the plasma membrane (Grusak et al., 1999). Plants which lack FRO2 exhibit
severe chlorosis, indicating the importance of this gene in Strategy I plants (Robinson et
al., 1999). FRO2 is expressed primarily in root epidermal cells and is localized to the
plasma membrane in these cells (Connolly et al, 2003).
The FROs constitute a family of genes thought to be responsible for reducing iron
and/or copper in various parts of the plant. The Arabidopsis FRO family includes 8
genes, named FRO1-8 (see Table 2.1). When iron is limiting, there is transcriptional
induction of some of the FRO genes and studies have shown that different FROs are
expressed and localized in different parts of the plant (Wu et al., 2005; Mukherjee et al.,
2006; Jeong et al., 2008; Bernal et al., 2012). Recently, three FROs have been
functionally characterized. In 2008, Jeong et al. showed that FRO7, which is expressed
highly in all green tissue, localizes to the chloroplast and plays a role in acquiring iron in
chloroplast. FRO7 is essential for proper functioning of photosynthesis in young
seedlings under iron deficient conditions (Jeong et al., 2008). On the other hand, FRO4
and FRO5 are expressed in the shoots and roots and localized to the plasma membrane.
Recently, these genes have been shown to be instrumental in maintaining Cu
homeostasis, because they reduce Cu for high affinity uptake of Cu by roots.
Furthermore, transcription of FRO4 and FRO5 is under the control of the transcription
There are 4 FROs that have not been characterized yet. FRO3 and FRO8 are
thought to be localized to the mitochondria (Jeong and Connolly, 2009). FRO3 is
ubiquitously expressed throughout the plants, while FRO8 is only expressed in senescing
leaves (Mukherjee et al., 2006). FRO3 and FRO8 are both thought to be involved in the
reduction of iron that is needed for use by the mitochondria. FRO1 is not highly
expressed in any tissue tested (Mukherjee, et al., 2006, Wu et al., 2005).
This work focuses on functional characterization of another uncharacterized FRO,
FRO6. FRO6 is localized to the PM and expressed at a high level in all green aerial
portions of the plant (Mukherjee et al., 2006; Feng et al., 2008; Jeong et al., 2008)
Interestingly, the FRO6 promoter contains multiple, light responsive elements (LREs),
including a GATA motif, the I-box, and GT1, thus FRO6 is regulated in a light-
dependent manner (Feng H et al., 2006). Overexpression of FRO6 in transgenic tobacco
plants resulted in increased ferric reductase activity in the shoots, but not the roots of
plants grown on iron sufficient and deficient media, with ferric reductase activity being
higher in iron deficient transgenic plants (Li et al., 2010). Additionally, these 35S::FRO6
transgenic plants showed increased levels of chlorophyll and Fe.
As of now, the mechanism for how Fe is taken up across the PM of the root is
well understood: 1. AHA2 lowers pH of soil to solubilize Fe, 2. FRO2 reduces the
solubilized Fe3+ to Fe2+, and 3. IRT1 transports the Fe2+ across the root PM, as described
above. However, the mechanism for how Fe is taken up across the PM of the shoot is not
well understood.
Previous studies support the idea that a ferric reductase is required for Fe uptake
sunflowers (de la Guardia, MD and Alcantara E., 1996) and Vigna unguiculata
(Bruggemann et al. 2003). The presence of ferric chelate reductase activity indicates that
some percentage of Fe is likely oxidized back to its Fe3+ form after entry into the root
cells and therefore needs to be reduced again before entering the leaf cells. The actual
metalloreductase responsible for providing the Fe needed for photosynthesis has been a
mystery for quite a while and the presence of the LREs in the FRO6 promoter suggests
that it may be responsible for providing the Fe needed for photosynthesis (Feng et al.,
2008). Moreover, the increased ferric reductase activity and Fe content of FRO6
overexpressing transgenic tobacco plants provide strong evidence that FRO6 is indeed
the actual FRO responsible for providing the iron needed for transport across the leaf PM
(Li et al, 2010). Here, I provide additional evidence to support this hypothesis through the
Expression Pattern
Localization Function
FRO1 Unknown Unknown Unknown
FRO2 Roots PM Reduction of
Fe at root soil interface
FRO3 Roots and
shoots
Mitochondri a
Postulated reduction of Fe for mitochondria
FRO4 Roots and
shoots
PM Reduction of
Cu for high affinity uptake in the roots
FRO5 Roots and
shoots
PM Reduction of
Cu for high affinity uptake in the roots
FRO6 Shoots PM Postulated
reduction of Fe for transport across leaf PM
FRO7 Shoots Chloroplast Reduction of
Fe for chloroplast
FRO8 Shoots Postulated
reduction of Fe for mitochondria
Materials and Methods
Arabidopsis lines
Wild type Arabidopsis (ecotype Columbia gl-1) was used as a control for all
experiments. Two FRO6 loss-of-function mutantsfro6-1 (SALK_085659) and fro6-2
(SALK_099597C), were ordered from the SALK Institute Genomic Analysis Lab
(SIGNAL). fro6-1 has a T-DNA insertion in the 8th intron (see Figure 2.1A), while fro6-2
has a T-DNA inserted in the 8th exon (see Figure 2.2A).
Genotyping
The fro6-1 and fro6-2 lines were backcrossed to the WT Col gl-1 twice. To
confirm that the fro6-1 and fro6-2 knockouts are homozygous, plants were genotyped
using primers specific to FRO6 along with primers specific to the T-DNA insertion. The
primers used for genotyping are as follows: FRO6KOLP Forward, FRO6KO Reverse,
and LBB1 (see Table 2.2). PCR was stopped after 35 cycles.
DNA Extraction
In order to extract DNA, a single leaf was selected from a single plant and
ground in an eppendorf tube, using 400 µl of extraction buffer (200 mM Tris, pH 7.5, 250
mM NaCl, 25mM EDTA, and 0.5% SDS). Samples were centrifuged at 13,000 rpm for
two minutes. Then, 300 µl of the supernatant was removed and mixed with 300 µl of
Next, the supernatant was discarded and the pellet was washed with 70% ethanol and
allowed to dry. The pellet was resuspended in 50µl of water and used for genotyping
assays (Klimyuk et al., 1993).
Transcript Analysis
To verify that the fro6-1 and fro6-2 mutants do not contain any FRO6 transcript,
semi-quantitative reverse transcriptase-PCR (RT-PCR) was performed. The primers used
are specific to the FRO6 3΄UTR. It was necessary to design primers that correspond to
the 3´UTR, because the sequence of FRO6 is highly homologous to the FRO7 gene and
the greatest degree of variability between the two genes is in the 3´UTR. RNA was
extracted from the shoots of wild type Arabidopsis seedlings grown for 14 days on
Gamborg’s B5 medium (Sigma-Aldrich, St. Louis). cDNA was synthesized from this
RNA following the manufacturer’s protocol (Superscript First-Strand Synthesis from
PCR Kit, Life technologies/Gibro-BRL). Actin cDNA was used as a control when doing
semi-quantitative RT-PCR. In RT-PCR, the polymerase chain reaction (PCR) was
stopped at particular intervals, the sample was then collected, and PCR was resumed,
after each pause. In addition to the WT control, a No RT control was included, to ensure
that there was no genomic DNA present in the sample. Moreover, a No cDNA control
was used to ensure the absence of contamination of the reagents used to prepare the PCR
samples. For transcript analysis of FRO6, samples were stopped at the 29th, 32th, and
35th cycles. For actin transcript analysis, the PCR reaction was stopped at the 23th, 26th,
Leaf Disc Ferric Reductase Activity
Leaf discs (de la Guardia, 1996) from 3-4 week old seedlings (grown on soil)were
submerged in assay solution and were kept in light. Leaves of the same age were selected
from 8 different plants. Preparation for leaf discs required the use of the
“Taped-Arabidopsis Sandwhich” method in order to peel off the leaf epidermis to expose the PM
(Wu et al., 2009). A hole punch was used to cut out the leaf discs, while the leaves are
still attached to the tape. Then, the leaves were completely submerged in 300 ul of assay
solution. The assay solution used contains 0.1mM Fe(III)-EDTA with 0.3mM Ferrozine.
Absorbance was then measured at 562 nm at 5 minutes, 15 minutes, 30 minutes 45
minutes and 60 minutes. Absorbance data was normalized to leaf disc weight. A student’s
t-Test was conducted to determine statistical significance.
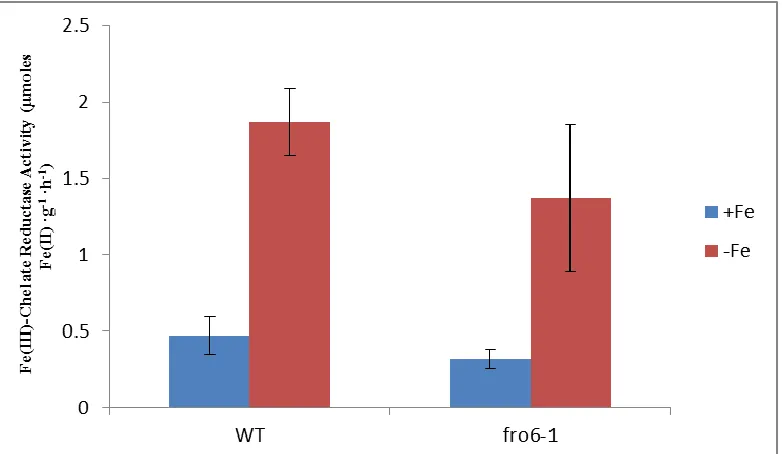
Root Ferric Reductase Activity
Ferric reductase assays were conducted on roots of plants grown on Gamborg’s
B5 medium (Sigma-Aldrich, St. Louis) for 12-14 days, then transferred to iron sufficient
(50µM Fe(III)-EDTA) or iron deficient (300 µM Ferrozine) medium for an additional
three days. Roots were submerged in the assay solution containing 0.1mM Fe(III)-EDTA
and 0.3mM Ferrozine. Then the plants were placed in the dark and the absorbance was
then measured at 562 nm at 0, 20, 40, 60 minutes). The absorbance data was normalized
to fresh root weight (Yi and Guerinot, 1996. Ten replicates of each line were used. A
student’s t-Test was conducted to determine statistical significance.
Flowering time
Flowering time was measured for fro6-1 and WT Col g1-1 plants, as a control.
was measured by counting the total number of leaves when the initial flowering bud
appeared (cotyledons were not included). 10 replicates for each line were used. A
student’s t-Test was conducted to determine statistical significance (Clarke et al., 1995).
Root Growth Assay
A root growth assay was used to measure the effects of iron deficiency on the
growth of roots of fro6-1 mutants. Plants were grown for 5 days on Gamborg’s B5
medium (Sigma-Aldrich, St.Louis) supplemented with 2% sucrose, 1mM MES, and 0.6%
agar, pH 5.8 (Mukherjee, et al., 2006). Then the 5 day old seedlings were transferred to
either iron sufficient (50 µm Fe (III)- EDTA) or iron deficient (300 µM Ferrozine) plates
(Yi and Guerinot, 1996). The plates were positioned vertically in the growth chamber.
Col g1-1 plants were used as controls. Measurements were taken every day for six days
(Connolly et al., 2002). 12 replicates of each line were used. A student’s t-Test was
conducted to determine statistical significance.
Chlorophyll Content
Plants were grown on Gamborg’s B5 medium (Sigma-Aldrich, St.Louis) for 14
days, and then transferred to either iron sufficient (50µM Fe (III-EDTA) or iron deficient
(300 µM Ferrozine) medium for an additional three days. Col g1-1 plants were used as
controls. Chlorophyll content was measured using a protocol adapted from Arnon (1949),
in which .1 g of tissue was ground in an eppendorf in 1 ml of 85 % acetone. The
homogenate was spun down and the supernatant absorbance was read at 663 and 644 nm.
Chlorophyll content was calculated as previously described (Arnon, 1949). Eight
replicates of each line were used. A student’s t-Test was conducted to determine
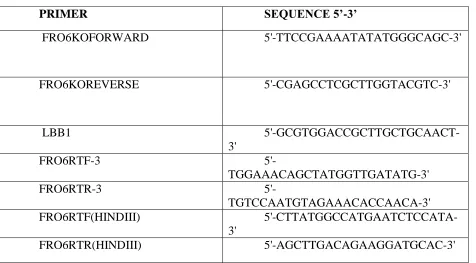
PRIMER SEQUENCE 5’-3’
FRO6KOFORWARD 5'-TTCCGAAAATATATGGGCAGC-3'
FRO6KOREVERSE 5'-CGAGCCTCGCTTGGTACGTC-3'
LBB1
5'-GCGTGGACCGCTTGCTGCAACT-3'
FRO6RTF-3
5'-TGGAAACAGCTATGGTTGATATG-3'
FRO6RTR-3
5'-TGTCCAATGTAGAAACACCAACA-3'
FRO6RTF(HINDIII)
5'-CTTATGGCCATGAATCTCCATA-3'
FRO6RTR(HINDIII) 5'-AGCTTGACAGAAGGATGCAC-3'
RESULTS
Previous work has shown that FRO6 is highly expressed in all green aerial
portions of plants (Mukherjee et al., 2006; Wu et al., 2005; Feng, et al., 2006; Li, et al.,
2010) and is localized to the PM (Jeong et al., 2008). In addition, it has been shown that
FRO6 encodes a protein that displays ferric reductase activity using a yeast system (Wu
et al., 2005; Jeong et al., 2008). This data has led us to hypothesize that FRO6 is ferric
chelate reductase involved in Fe homeostasis, specifically providing reduced Fe for
transport across the leaf plasma membrane that is needed for important biological
processes such as photosynthesis.
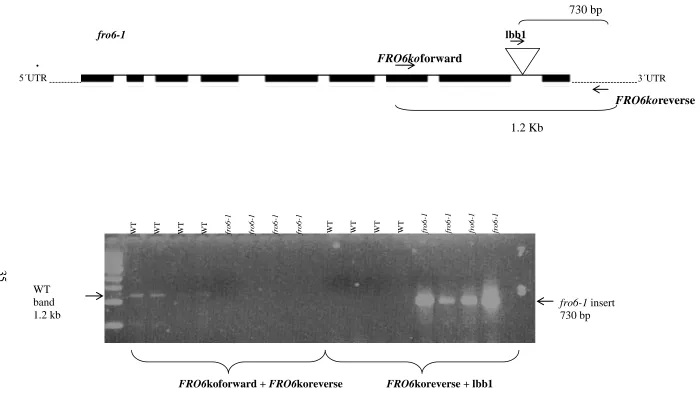
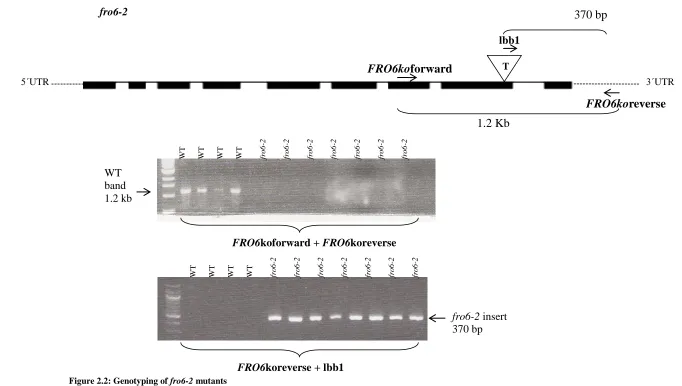
Mutants (fro6-1 that contains a T-DNA insertion in the 8th intron) (see Figure
2.1A) and (fro6-2 that contains a T-DNA insertion in the 8th exon) (see Figure 2.2A) of
the Arabidopsis FRO6 gene were obtained from the SALK Institute Genomic Analysis
Laboratory collection. The inserts were confirmed using sequence analysis at the
University of South Carolina. PCR genotyping was used to identify homozygous mutant
plants (see Figure 2.1B and Figure 2.2B).
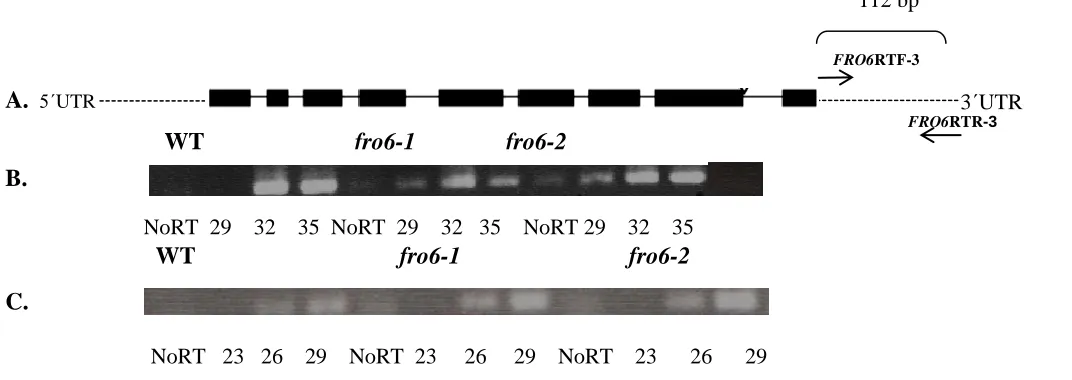
However, semi-quantitative RT-PCR transcript analysis showed that these
mutants express transcript comparable to WT (Col gl-1) (see Figure 2.3 B). A No RT
control was used to check for the presence of genomic DNA and a no cDNA control was
used as well to check for the presence of DNA contamination in the PCR reagents.
FRO6RTF-3΄ and FRO6RTR-3΄ primer specificity, because FRO6 and FRO7 share
approximately92%sequence similarity. Of the 23 bases in the FRO6RTF-3΄ primer, 15
bases match the corresponding FRO7 sequence and of the 23 bases in FRO6RTR-3΄
primer, 14 bases match the corresponding FRO7 sequence. FRO6RTF-3΄ and
FRO6RTR-3΄ were used with FRO7 cDNA and showed that these primers are able to amplify FRO7
under the PCR conditions used.
Next, we designed primers FRO6RTF (HINDIII) and FRO6RTR (HINDIII) for
semi-quantitative RT-PCR to amplify a region of the cDNA that contains a HindIII site
that is specific to FRO6. Because FRO6 and FRO7 share such high sequence similarity, it
was important to cut at a site that is present in FRO6 but not FRO7, so that after digestion
with HindIII, the actual identity of the transcript can be verified (see Figure 2.4 A). The
RT-PCR product was digested with the restriction enzyme HindIII. Two bands of sizes
100 bp and 200 bp correspond to the digested FRO6 transcript and the undigested 300 bp
band corresponds to the FRO7 transcript (see Figure 2.4 B). When the amplified product
was digested with HindIII, it was found that the product corresponded to both FRO6 and
FRO7. This result confirmed that the primers amplified both FRO6 and FRO7 and also
confirmed that the fro6-1 and fro6-2 lines express FRO6 transcript.
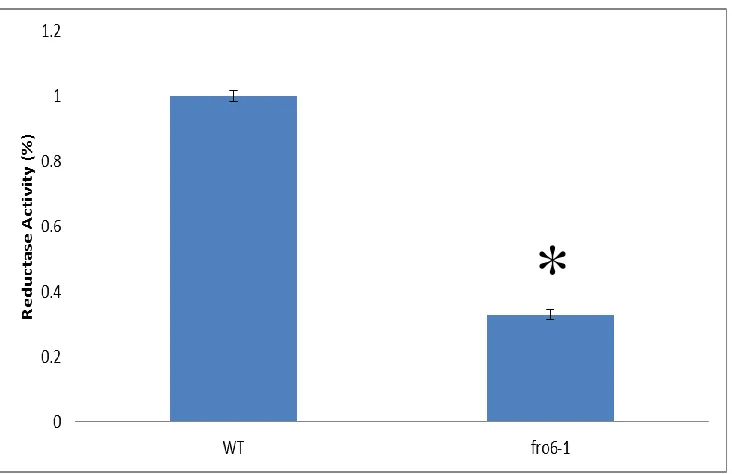
In order to determine the function of FRO6 in the leaves, we conducted a ferric
chelate reductase assay. There was a significantly less leaf ferric chelate reductase
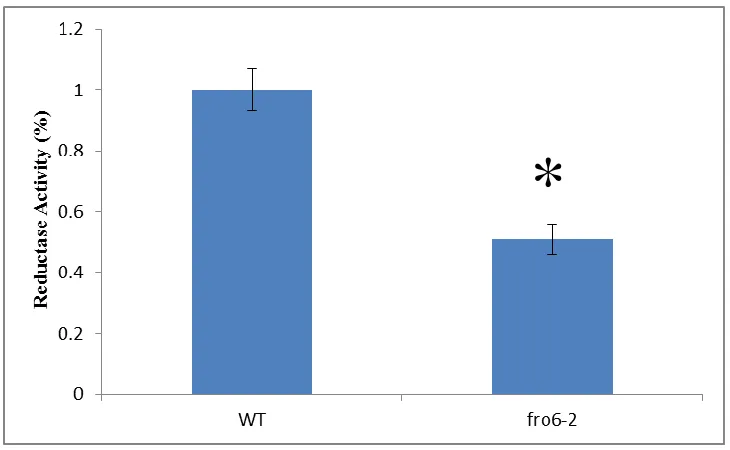
activity in fro6-1 mutants (see Figure 2.5). Additionally, there was a significantly less
leaf ferric chelate reductase activity in fro6-2 mutants as well (see Figure 2.6). In
Since other FRO mutant lines display altered flowering time, flowering time of
fro6-1 was measured. fro3 was used as a negative control, because it has been shown to
have a delayed flowering time compared to WT. The fro6-1 mutants show a significantly
faster flowering time than both WT and fro3 mutants when grown in high light conditions
(see Figure 2.8).
Root growth is used as a typical marker for a plant’s functions under conditions of
metal stress. Under both Fe sufficient and Fe deficient conditions, there was no
significant difference in the root length of the fro6-1 mutants versus WT (see Figure 2.9).
Chlorophyll content is often affected by alterations in Fe homeostasis as Fe is required
for chlorophyll synthesis. Additionally, chlorophyll requires Fe to function, so
measurement of chlorophyll may indicate whether there is proper reduction and transport
and delivery of Fe to the photosynthetic apparatus. Mutants of genes involved in Fe
homeostasis have been shown to have compromised chlorophyll content or a chlorotic
phenotype (including fro2, fit, irt1, and fro7). There was no significant difference in
35
FRO6koforward + FRO6koreverse FRO6koreverse + lbb1
FRO6koforward FRO6koreverse 1.2 Kb lbb1 W T
WT WT WT fro
6 -1 fro 6 -1 fro 6 -1 fro 6 -1 WT band 1.2 kb
fro6-1 insert 730 bp
Figure 2.1: Genotyping of fro6-1 mutants
A. Schematic of FRO6 gene and T-DNA insertion (triangle) as well as the locations of gene specific primers FRO6KOforward and FRO6KOreverse, and T-DNA specific primer lbb1 (adapted from Arabidopsis.org) (black boxes = exons, spaces = introns) (adapted from Arabidopsis.org) (black boxes = exons)
B. Agarose gel of PCR reaction using gene specific primers fro6KO forward and fro6KO reverse and T-DNA specific primer LBB1 and gene specific primer fro6KO reverse.
B .
fro6-1
W
T
WT WT WT fro
36
FRO6koforward T
lbb1
5΄UTR 3΄UTR
FRO6koreverse 370 bp 1.2 Kb WT band 1.2 kb
fro6-2 insert 370 bp W T
WT WT WT fro
6 -2 fro 6 -2 fro 6 -2 fro 6 -2 fro 6 -2 fro 6 -2 fro 6 -2 fro6-2
Figure 2.2: Genotyping of fro6-2 mutants
A. Schematic of FRO6 gene and T-DNA insertion (triangle) as well as the locations of gene specific primers FRO6KOforward and FRO6KOreverse, and T-DNA specific primer lbb1 (adapted from Arabidopsis.org) (black boxes = exons, spaces = introns) (adapted from Arabidopsis.org) (black boxes = exons)
B. Agarose gel of PCR reaction using gene specific primers fro6KO forward and fro6KO reverse and T-DNA specific primer LBB1 and gene specific primer fro6KO reverse.
FRO6koforward + FRO6koreverse
FRO6koreverse + lbb1
W T
WT WT WT fro
37
3΄UTR
FRO6RTR-3
112 bp
WT fro6-1 fro6-2 fro6-1
NoRT 29 32 35 NoRT 29 32 35 NoRT 29 32 35
WT fro6-1 fro6-2
A.
B.
Figure 2.3: Transcript Analysis
A. Schematic Drawing of FRO6 gene (black boxes = exons) (adapted from Arabidopsis.org).
B. RT-PCR transcript analysis of FRO6 transcript in Col gl-1 and fro6-1 mutant. Cycles 29, 32, 35for FRO6 transcript C. RT-PCR transcript analysis of Actin transcript in Col gl-1 and fro6-1 mutant. Cycles 23, 26, 29 for actin transcript
C.
5΄UTR
FRO6RTF-3
38
~ 3.43kb
WT fro
6
-1
fro
6
-2
FRO6RTF (HindIII)
FRO6RTR (HindIII)
300 bp HindIII Site
FRO6
300 bp (FRO7) ~200 bp (FRO6) ~100 bp(FRO6)
A
.
B
.
Figure 2.4: Digestion of RT-PCR Product with HindIII
A. Schematic of FRO6RTF (HINDIII) and FRO6RTR (HINDIII) flanking the HindIII site and the predicted band size that FRO6RTF (HindIII) and FRO6RTR (HindIII) amplify of FRO6. (adapated from Arabidopsis.org). (black boxes = exons, spaces between boxes= introns)
B. Digestion of Col-gl1 and fro6-1 mutant RT-PCR transcript using HindIII FRO7
~ 3.38kb
39
Figure 2.5: Leaf Disks Ferric Reductase Activity of fro6-1. Plants were grown on B5 medium for 2 weeks. Then transferred to soil for 2 weeks. Leaf Discs were prepared using the “Tape Sandwich” method and a hole punch. Leaf discs were then submerged in FCR assay solution and the absorbance at 562 nm was measured at 0, 20, 40, 60 minutes. Data was normalized by leaf disc weight. An asterisk indicates that there was a significant difference using a student’s t-Test for statistical analysis.
40
*
41
42
43
44
Discussion
At this time, much is known about the localization and expression pattern of
FRO6, but not much is known about the role it may play in iron uptake (Mukherjee et al.,
2006; Feng et al., 2006; Jeong et al., 2008). In protoplasts, FRO6 has been shown to
localize to the plasma membrane (Jeong et al., 2008). It is regulated in a light-dependent
manner, with its promoter containing many light responsive elements (LREs), such as the
I-box, GT1, and GATA motifs (Feng et al., 2006). While overexpression of AtFRO6 in
transgenic tobacco plants resulted in a higher rate of ferric chelate reductase activity of
leaves grown under iron sufficient and deficient conditions, there was no difference in
ferric chelate reductase (FCR) activity of the roots of the transgenic plants compared to
WT. Additionally, overexpression of FRO6 in tobacco plants, resulted in elevated Fe and
chlorophyll content (Li et al., 2010). Thus we hypothesized that FRO6 is responsible for
reducing apoplastic iron for transport across the plasma membrane in leaf cells.
The results here indicate that FRO6 is involved in reduction of iron at the leaf
PM. Ferric reductase activity is significantly reduced in the fro6-1 and fro6-2 mutants as
compared to WT, suggesting that FRO6 functions in reduction of iron at the leaf PM (see
Figure 2.4 and 2.5). However, despite the fact that the fro6-1 and fro6-2 mutants are
homozygous (see Figures 2.1B and 2.2B), the lines show detectable FRO6 transcript (see
Figure 2.3). It is possible that the transcript that is present in the fro6-1 and fro6-2