Please cite this article as: A. Yazdani, S. Razmyan, H. Baharmast Hossainabadi, Approximate Incremental Dynamic Analysis Using Reduction of Ground Motion Records, International Journal of Engineering (IJE), TRANSACTIONS B: Applications Vol. 28, No. 2, (February 2015) 190-197
International Journal of Engineering
J o u r n a l H o m e p a g e : w w w . i j e . i r
Approximate Incremental Dynamic Analysis Using Reduction of Ground Motion
Records
A. Yazdani*a, S. Razmyanb , H. Baharmast Hossainabadia
a Department of Civil Engineering, Faculty of Engineering, University of Kurdistan, Sanandaj, Iran b Department of Mathematics, Firoozkooh Branch, Islamic Azad University, Firoozkooh, Iran
P A P E R I N F O
Paper history: Received 29 July 2014
Received in revised form 22 October 2014 Accepted 13 November 2014
Keywords:
Incremental Dynamic Analysis Data Envelopment Analysis Ranking
Ground Motion
A B S T R A C T
Incremental dynamic analysis (IDA) requires the analysis of non-linear response history of a structure for an ensemble of ground motions, each scaled to multiple levels of intensity and selected to cover the entire range of structural response. Recognizing that IDA of practical structures is computationally demanding, an approximate procedure based on the reduction of the number of ground motions is developed. A methodology based on data envelopment analysis (DEA), mathematical programming that can handle large numbers of variables and relations, is proposed to reduce the number of ground motions needed for the production of a reliable median IDA curve. The IDA curves computed by the exact and approximate procedures for two different sets of ground motions for the 9-storey SAC-Los Angeles building are presented. The results demonstrate that the approximate procedure, which uses a limited number of input ground motions, is accurate enough for practical application in building evaluation and design.
doi: 10.5829/idosi.ije.2015.28.02b.04
1. INTRODUCTION1
With the advent of performance-based earthquake engineering, several forms of incremental dynamic analysis (IDA) have recently emerged for the thorough estimation of structural performance under seismic loads [1]. IDA is a parametric analysis method that estimates seismic demand and capacity by subjecting the structural model to multiple suitably scaled ground motion records, each scaled to multiple levels of intensity, thus producing several curves of response parameterized by intensity level. A series of nonlinear dynamical analyses under a suite of ground motion records is a computer-intensive procedure. Therefore, there is a great need for a simple procedure that carries the advantages of IDA while using nonlinear dynamical analyses. In an approximate method, a single degree of freedom (SDOF) system is defined to approximate the static pushover (SPO) curve for the multiple degree of
1*Corresponding Author’s Email: [email protected] (A. Yazdani)
freedom (MDOF) structure [2]. Another approximate procedure [3, 4] to reduce the computational effort required for IDA is to estimate the seismic demand for the structure by modal pushover analysis (MPA) instead of nonlinear dynamic analyses. Attempts have also been made to create summarized IDA curves with less input data, requiring less effort but maintaining acceptable accuracy [5, 6].
response is an important result, it is often more important to quantify the median response, e.g., the median IDA curve.
Data envelopment analysis (DEA) [9] is widely applied to the performance analysis of many decisional entities. The main objective of the DEA models is the evaluation of the overall efficiencies of the decision making units (DMUs) by a scalar measure with a value between zero and one that converts a set of inputs into a set of outputs. Combining various inputs and outputs into one value, such as the ratio of aggregated outputs to aggregated inputs, will allow us to evaluate and rank the performance of DMUs by their corresponding single measures. With the proposed ranking methodology, an attempt has been made to reduce the number of ground motion records required to predict the median IDA curve. The procedure based on this ranking methodology is illustrated by example computations for the 9-storey SAC-Los Angeles building using the exact and approximate procedures for two different ensembles of ground motion records.
2. FUNDAMENTALS OF RANKING IN DATA ENVELOPMENT ANALYSIS
Data envelopment analysis (DEA) is widely applied to the performance analysis of many decisional entities in different fields, such as economics, business and engineering [10-12]. DEA utilizes techniques like mathematical programming that can handle large numbers of variables and relationships (constraints), which relaxes the requirements that are often encountered when one is limited to choosing only a few inputs and outputs [13].
In DEA, the organization under study is called a DMU [9]. The use of DEA to provide an overall assessment of the performances of all efficient DMUs and ranking them has become an interesting topic. The ranking is based on a measurement of the efficiency of the DMU. The efficiency is calculated by a scalar measure with a value between zero (the worst) and one (the best) through a linear programming (LP) model, and the weights assigned to each linear aggregation are the results of the corresponding LP. Different ranking methods have been developed that use several classification criteria and are not entirely mutually exclusive [14]. Here, the slacks-based measure (SBM) [15, 16] of efficiency in DEA is used. For n DMUs with
the input mn
ij R
x
X=( )Î ´ and the output sn
ij R
y
Y=( )Î ´ , the production possibility set P is defined as follows:
} 0 ,
Yλ
y ,
Xλ
x y) {(x,
P= ³ £ l³ (1)
where λ is a non-negative vector in Rn. In the case without input (and multi-output), it can be considered an expression that describes a particular DMUk, as follows:
+
-=Y s
yk l (2)
The vector s+ÎRs indicates the output shortfall of this expression, which is called slacks [15]. The SBM returns an efficiency measure between zero and one, returning unity if and only if the DMU concerned is on the frontier of the production possibility set with no slacks. In an effort to estimate the efficiency of yk, the following linear program can be formulated:
s
r r
r 1
maximize ρ 1 (1/ s) s / y
subject to y Yλ s λ 0, s 0
k
k
+ =
+ +
= +
= - ³ ³
å
(3)where ρ is a positive index that it is equal to or smaller than unity (0<r£1), and s is the number of outputs. Given the data, we measure the efficiency of each DMU; hence, we need n optimizations, one for each DMUj (j = 1,…,n) to be evaluated.
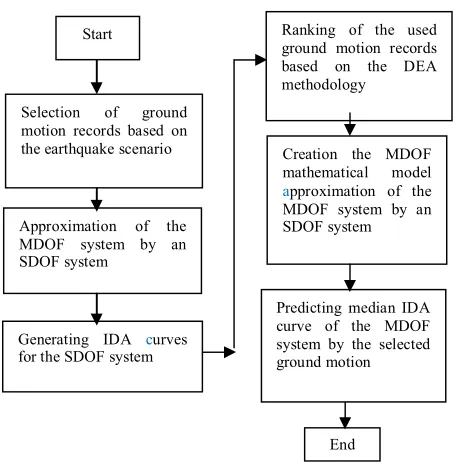
3. METHODOLOGY
An important issue in Performance-Based Earthquake Engineering (PBEE) is the estimation of the mean annual frequency (MAF) with which a specified level of structural demand or a certain limit-state capacity is exceeded. A promising method that has recently risen to meet these needs is Incremental Dynamic Analysis (IDA), which is an emerging analysis method that offers thorough seismic demand and capacity prediction capability using a series of nonlinear dynamical analyses under a multiply scaled suite of ground motion records [1]. IDA requires both creation of a MDOF mathematical model that can be used for the simulation of the realistic seismic response of the structure and selection of a suite of ground motion records to represent an earthquake scenario. Consequently, IDA is powerful tool, but in most design cases it is complex and time-consuming. The aim of this study is to decrease the number of ground motion records needed for the prediction of a median IDA curve of the MDOF system.
are run for a proper nonlinear SDOF model. The IDA curves for a simple structural model are computed for all of the ground motion records. The IDA curve is a plot of the ground motion intensity against a seismic demand parameter. In the next step, data envelopment analysis is applied to arrange the ground motion records. The measures of efficiency of different ground motions are calculated by a scalar measure between zero and one. In the final step, a single-record IDA curve for the MDOF model is computed for a limited number of ground motion records from the preceding list.
4. COMPARATIVE EVALUATION OF ANALYSIS PROCEDURES
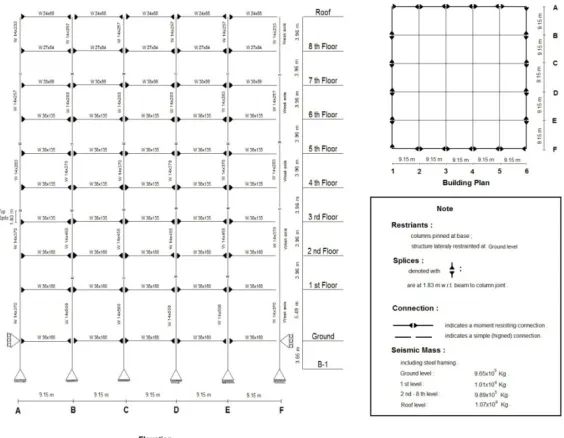
To study the application of data envelopment analysis to the number reduction of ground motion records in incremental dynamic analysis, the 9-story SAC buildings (Figure A1) are used with two different ensembles of ground motion records. The IDA can be highly dependent on the record chosen, so a sufficient number of records will be needed to cover the full range of responses. Hence, we have to resort to subject the structural model to a suite of ground motion records.
The structural systems of this model building consist of special moment-resisting frames (SMRF) along the plan perimeter and interior gravity frames. Plastic hinges at the member ends are modeled by post-yield stiffness equal to 3% of the initial stiffness.
Figure 1. Framework earthquake ground motion reduction in IDA
The P-Δ effects caused by gravity loads are included in the analysis. These structures have been described in detail in a previous study [17].
In this study, the ground motion intensity measure is characterized by Sa (T1, 5%), which is the spectral pseudo-acceleration corresponding to the first-mode elastic vibration period and the 5% damping ratio at which this IM is sensitive to the strength of the frequency content of the ground motion near its first-mode frequency. The peak roof drift ratio, θroof, which is defined as the roof displacement divided by the building height is used here as a representative demand measure [4].
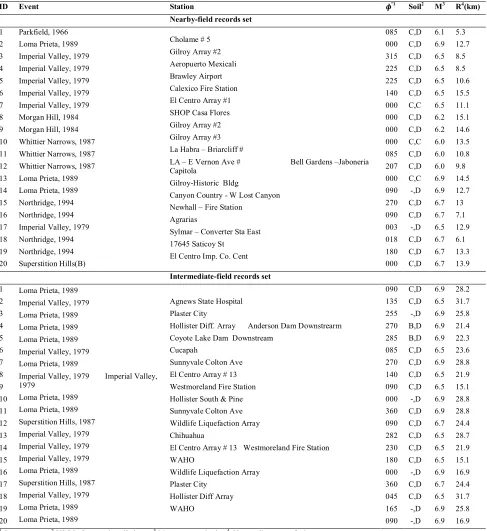
The first natural period of the structural vibration within the elastic range is 2.23 s for the 9-story building. Two different suites of twenty ground motion records (Table 1) that have been selected to represent an earthquake scenario are used [1]. Most of the earthquake ground motion records are selected from the
earthquake records comprise of two distinct sets based on their closet distances to the rupture surface, the nearby-field and intermediate-field sets. The distance range for the nearby-field set is defined to be less than 16 km [18], and the intermediate-field set is defined by ranges from 16 to 30 km. These ground motions have been recorded on firm soil during earthquakes of Mw 6.0-6.9.
4. 1. SDOF Systems The differential equations governing the response of an inelastic multistory building to horizontal earthquake ground motion
) (t
u&&g are as follows:
) ( } ]{ [ )} ( { } ]{ [ } ]{
[M u&& + C u& + Fs u =-M lu&&g t (4)
where u is the vector of N lateral floor displacements relative to the ground motion. [M] and [C] are the mass and system damping matrices. Each element of the influence vector {l} is equal to unity, and the elements {Fs(u)} are the stiffness terms expressed as the effect of the hysteretic restoring factor term for the building.
By neglecting the coupling of the N equations in the modal co-ordinates, the spatial distribution of the effective earthquake force is expanded into the modal inertia force distribution, sn. The nth-mode equation governing the response of the inelastic system is equal to the following:
) ( } { )} ( { } ]{ [ } ]{
[M u&& + C u& + Fs u =- sn u&&g t (5)
in which u(t) is governed by the equation of motion for the nth-mode non-linear SDOF system. Based on the
12 Silva, W., Strong Motion Database CD-ROM, Pacific Engineering and
Analysis, El Cerrito, California, (1999), available at
http://peer.berkeley.edu/smcat Start
End Selection of ground
motion records based on the earthquake scenario
Approximation of the MDOF system by an SDOF system
Generating IDA curves for the SDOF system
Ranking of the used ground motion records based on the DEA methodology
Predicting median IDA curve of the MDOF system by the selected ground motion
Creation the MDOF mathematical model approximation of the MDOF system by an SDOF system
pushover analysis, a suitable procedure is introduced to approximate the elastic and inelastic properties of the MDOF system to a simple SDOF model that retains conceptual simplicity and computational attractiveness in the structural analysis [3]. Both systems have the same elastic stiffness, natural frequency, and damping
ratio. The structure is pushed using a force distribution of [M][Φn], where [Φn] is the nth natural vibration mode of the structure. A trilinear idealization of the pushover curve for the first-mode is shown in Figure 2. This figure indicates the variation of the base shear against the roof displacement.
TABLE 1. Two different sets of twenty ground motion records used here
ID Event Station фº1 Soil2 M3 R4(km)
Nearby-field records set
1 2 3 4 5 6 7 8 9 10 11 12 13 14 15 16 17 18 19 20 Parkfield, 1966 Loma Prieta, 1989 Imperial Valley, 1979 Imperial Valley, 1979 Imperial Valley, 1979 Imperial Valley, 1979 Imperial Valley, 1979 Morgan Hill, 1984 Morgan Hill, 1984 Whittier Narrows, 1987 Whittier Narrows, 1987 Whittier Narrows, 1987 Loma Prieta, 1989 Loma Prieta, 1989 Northridge, 1994 Northridge, 1994 Imperial Valley, 1979 Northridge, 1994
Northridge, 1994 Superstition Hills(B)
Cholame # 5 Gilroy Array #2 Aeropuerto Mexicali Brawley Airport Calexico Fire Station El Centro Array #1 SHOP Casa Flores
Gilroy Array #2 Gilroy Array #3
La Habra – Briarcliff #
LA – E Vernon Ave # Bell Gardens –Jaboneria Capitola
Gilroy-Historic Bldg
Canyon Country - W Lost Canyon Newhall – Fire Station
Agrarias
Sylmar – Converter Sta East 17645 Saticoy St
El Centro Imp. Co. Cent 085 000 315 225 225 140 000 000 000 000 085 207 000 090 270 090 003 018 180 000 C,D C,D C,D C,D C,D C,D C,C C,D C,D C,C C,D C,D C,C -,D C,D C,D -,D C,D C,D C,D 6.1 6.9 6.5 6.5 6.5 6.5 6.5 6.2 6.2 6.0 6.0 6.0 6.9 6.9 6.7 6.7 6.5 6.7 6.7 6.7 5.3 12.7 8.5 8.5 10.6 15.5 11.1 15.1 14.6 13.5 10.8 9.8 14.5 12.7 13 7.1 12.9 6.1 13.3 13.9
Intermediate-field records set
1 2 3 4 5 6 7 8 9 10 11 12 13 14 15 16 17 18 19 20
Loma Prieta, 1989 Imperial Valley, 1979 Loma Prieta, 1989 Loma Prieta, 1989 Loma Prieta, 1989 Imperial Valley, 1979 Loma Prieta, 1989
Imperial Valley, 1979 Imperial Valley, 1979
Loma Prieta, 1989 Loma Prieta, 1989 Superstition Hills, 1987 Imperial Valley, 1979 Imperial Valley, 1979 Imperial Valley, 1979 Loma Prieta, 1989 Superstition Hills, 1987 Imperial Valley, 1979 Loma Prieta, 1989 Loma Prieta, 1989
Agnews State Hospital
Plaster City Hollister Diff. Array Anderson Dam Downstrearm Coyote Lake Dam Downstream
Cucapah
Sunnyvale Colton Ave El Centro Array # 13 Westmoreland Fire Station Hollister South & Pine Sunnyvale Colton Ave Wildlife Liquefaction Array Chihuahua
El Centro Array # 13 Westmoreland Fire Station WAHO
Wildlife Liquefaction Array Plaster City
Hollister Diff Array
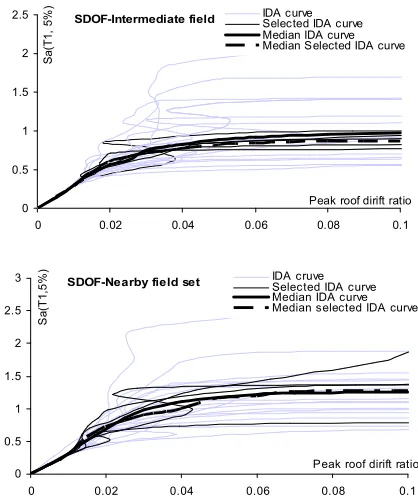
To obtain the data needed to define the precedence list of ground motion, IDA analysis was performed for the SDOF model by applying two different sets of ground motions. The single-record IDA curves and median IDA curve for both sets of ground motions are presented in Figure 3. In these curves, the ground motion intensity is characterized by Sa (2.23, 5%), and the θroof, the peak roof drift ratio can be used as the demand parameter.
4. 2. The Ranking of Ground Motion Records Based on the IDA Curves of the SDOF System The precedence list of the ground-motion records was determined for the nearby-field and intermediated-field record set using data envelopment analysis, which is described in section 2. The ID numbers of the ground motion records have been presented in Table 1 and the first and forth columns in Table 2. The data in the ranking of the ground-motion records are single record IDA curves for the SDOF system. The IDA curve for the SDOF system is assumed to be a DMU in ranking, i.e., each point in the IDA curve is assumed to be an yrk. The ranking is based on a measurement of the efficiency of the DMU. The efficiency is calculated by a scalar measure with a value between zero and one. The ranked list of ground motions is based on the corresponding ID numbers of the ground motion records from their calculated efficiency indices, indicated in Table 2. Figure 4 compares the median IDA curve of all earthquake ground motions and the median of the four selected records in the SDOF system, as indicated in Table 2. The acceptable mismatch between the two medians is shown in Figure 4. The difference between the original and selected median IDA curves is quantified by the term error. Term error can be defined as the ratio of the difference of the area corresponding to the median IDA curve of all earthquake ground motions and the median of the selected records to the area corresponding to the median IDA curve of all earthquake ground motions. The term error depends on the number of selected ground motion records. If the number of selected records is equal to the number of records in the set, the term error will be equal to zero.
0 1000 2000 3000 4000 5000 6000 7000 8000 9000 10000
0 0.02 0.04 0.06 0.08 0.1 0.12
Roof dirift ratio
Ba
se
sh
ea
r
(kN) Pushover
Idealized Trilinear
Figure 2. Properties of the first-mode inelastic SDOF system from the pushover curve
SDOF-Intermediate field set
0 0.5 1 1.5 2 2.5
0 0.02 0.04 0.06 0.08 0.1
Peak roof dirift ratio
Sa
(T
1
,5%
) IDA curve
Median IDA curve
SDOF-Nearby field set
0 0.5 1 1.5 2 2.5 3
0 0.02 0.04 0.06 0.08 0.1
Peak roof dirift ratio
Sa
(T
1,
5%
)
IDA cruve Median IDA curve
Figure 3. The single record IDA curves corresponding to the SDOF system for two different sets of ground motions
SDOF-Intermediate field
0 0.5 1 1.5 2 2.5
0 0.02 0.04 0.06 0.08 0.1
Peak roof dirift ratio
Sa
(T
1,
5%
) IDA curve
Selected IDA curve Median IDA curve Median Selected IDA curve
SDOF-Nearby field set
0 0.5 1 1.5 2 2.5 3
0 0.02 0.04 0.06 0.08 0.1
Peak roof dirift ratio
Sa
(T
1,
5%
)
IDA cruve Selected IDA curve Median IDA curve Median selected IDA curve
Figure 4. Comparison of the median IDA curve of the whole sets and the selected ground motion records, the SDOF system.
MDOF-Intermediate field
0 0.5 1 1.5 2 2.5
0 0.02 0.04 0.06 0.08 0.1
Peak roof dirift ratio
Sa
(T
1,
5%
) IDA curve
Selected IDA curve Median IDA curve Median selected IDA curve
MDOF-Nearby field
0 0.5 1 1.5 2 2.5
0 0.02 0.04 0.06 0.08 0.1
Peak roof dirift ratio
Sa
(T
1
,5%
) IDA curve
Selected IDA curve Median IDA curve Median selected IDA curve
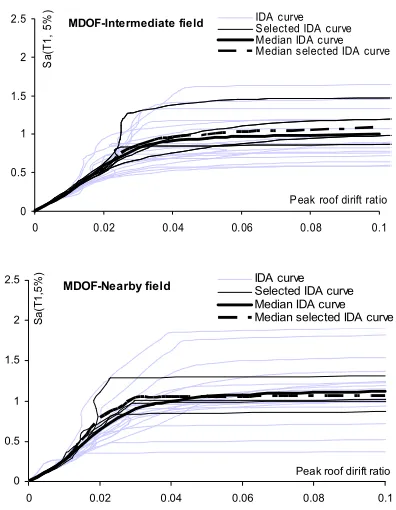
Figure 5. Comparison of the median IDA curve of whole sets and the selected ground motion records, corresponding to the MDOF system.
Figure 6. The error term versus the number of selected ground motion records, corresponding to the MDOF system.
4. 3. Assessment of the Selected Records for the MDOF System With the hunt-and-fill-tracing algorithm [1], it was possible to generate one IDA curve with approximately 12 non-linear response history analyses corresponding to 12 ground motion intensity levels. An ensemble of 20 ground motion records required approximately 240 non-linear response history analyses of the structure, which is an onerous task for actual buildings with hundreds of structural elements. To minimize the number of non-linear response history analyses based on the presented procedure, the number of ground motion records used in the analysis is reduced. To assess the validity of the presented procedure, the single-record IDA curves for the MDOF system were calculated for two different sets of ground
motion records. Figure 5 compares the median IDA curve of all earthquake ground motions with the original median, the median of the (four) selected records, and the selected median for two different sets in the MDOF system. The error of estimation of the media IDA curve for only four recorded ground motions is less than approximately 7 and 8% for the nearby-field and intermediate-field sets in the MDOF system, respectively. Figure 6 shows the error term for different numbers of ground motion records in both sets.
5. CONCLUSIONS
Incremental dynamic analysis (IDA) of practical structures is computationally demanding. Estimating the seismic demands on a structure by an approximate method leads to a highly efficient procedure, and the proposed approach offers a significant reduction of computational effort. The approximation procedure based on the reduction of the number of ground motions is accurate over the entire range of roof drift ratios, even close to collapse. Here, modal pushover analysis based on the first mode is used to estimate the base shear-roof displacement curve. This pushover curve is idealized as a trilinear force-deformation relation for the first mode inelastic SDOF system. In the proposed methodology, the response of a SDOF model is used to rank the ground motion set based on data envelopment analysis (DEA). The applicability of the proposed method has been demonstrated by the example of a nine-story-steel frame. The accuracy of the method depends on the number of selected records. For two different ground motion sets, one of which is an intermediate-field and the other is a near-field set, the accuracy of the approximate procedure for the four selected ground motions is satisfactory. It is also satisfactory for the estimation of the structural capacities for immediate occupancy, collapse prevention, and global instability limit states. The error in the prediction of the median IDA curve up to collapse, in terms of the roof displacement ratio, is less than 8%.
For different structures that are not first mode dominant, the SDOF model will not be a sufficient representation of the simple model. The proposed simplified approach applies only to median IDA curves, and it is not intended for the determination of dispersion. It is expected that further research could lead to improvements in the proposed method for structures with significantly higher mode effects and the study of dispersion in seismic response.
6. ACKNOWLEDGMENT
7. REFERENCES
1. Vamvatsikos, D. and Cornell, C.A., "Incremental dynamic analysis", Earthquake Engineering & Structural Dynamics, Vol. 31, No. 3, (2002), 491-514.
2. Vamvatsikos, D. and Allin Cornell, C., "Direct estimation of the seismic demand and capacity of oscillators with multi‐linear static pushovers through ida", Earthquake Engineering & Structural Dynamics, Vol. 35, No. 9, (2006), 1097-1117. 3. Chopra, A.K. and Goel, R.K., "A modal pushover analysis
procedure for estimating seismic demands for buildings", Earthquake Engineering & Structural Dynamics, Vol. 31, No. 3, (2002), 561-582.
4. Han, S.W. and Chopra, A.K., "Approximate incremental dynamic analysis using the modal pushover analysis procedure", Earthquake Engineering & Structural Dynamics, Vol. 35, No. 15, (2006), 1853-1873.
5. Azarbakht, A. and Dolšek, M., "Prediction of the median ida curve by employing a limited number of ground motion records", Earthquake Engineering & Structural Dynamics, Vol. 36, No. 15, (2007), 2401-2421.
6. Ghafory‐Ashtiany, M., Mousavi, M. and Azarbakht, A., "Strong ground motion record selection for the reliable prediction of the mean seismic collapse capacity of a structure group", Earthquake Engineering & Structural Dynamics, Vol. 40, No. 6, (2011), 691-708.
7. Tothong, P. and Luco, N., "Probabilistic seismic demand analysis using advanced ground motion intensity measures", Earthquake Engineering & Structural Dynamics, Vol. 36, No. 13, (2007), 1837-1860.
8. Jalayer, F. and Cornell, C.A., "A technical framework for probability-based demand and capacity factor design (DCFD) seismic formats, Pacific Earthquake Engineering Research Center, (2004).
9. Charnes, A., Cooper, W.W. and Rhodes, E., "Measuring the efficiency of decision making units", European Journal of Operational Research, Vol. 2, No. 6, (1978), 429-444. 10. Vaziri, M., "A comparative appraisal of roadway accident for
asia-pacific countries", International Journal of Engineering-Transactions A: Basics, Vol. 23, No. 2, (2010), 111-126. 11. Bashiri, M., Amiri, A., Asgari, A. and Doroudyan, M.,
"Multi-objective efficient design of np control chart using data envelopment analysis", International Journal of Engineering-Transactions C: Aspects, Vol. 26, No. 6, (2013), 621-630. 12. Amirian, H. and Sahraeian, R., "Multi-objective differential
evolution for the flow shop scheduling problem with a modified learning effect", International Journal of Engineering-Transactions C: Aspects, Vol. 27, No. 9, (2014), 1395-1404. 13. Cooper, W.W., Seiford, L.M. and Tone, K., "Data envelopment
analysis: A comprehensive text with models, applications, references and dea-solver software. Second editions", Springer, ISBN, Vol. 387452818, (2007), 490-523.
14. Adler, N., Friedman, L. and Sinuany-Stern, Z., "Review of ranking methods in the data envelopment analysis context", European Journal of Operational Research, Vol. 140, No. 2, (2002), 249-265.
15. Tone, K., "A slacks-based measure of efficiency in data envelopment analysis", European Journal of Operational Research, Vol. 130, No. 3, (2001), 498-509.
16. Tone, K., "A slackes-based measure of super-efficiency in data envelopment analysis", European Journal of Operational Research, Vol. 143, (2002), 32-41.
17. Luco, N., "Probabilistic seismic demand analysis, smrf connection fractures, and near-source effects", Stanford University, (2002).
18. Committee, S., "Recommended lateral force requirements and commentary, Structural Engineers Association of California (SEAOC), (1996).
APPENDICES
Approximate Incremental Dynamic Analysis Using Reduction of Ground Motion
Records
A. Yazdania, S. Razmyanb , H. Baharmast Hossainabadia
a Department of Civil Engineering, Faculty of Engineering, University of Kurdistan, Sanandaj, Iran b Department of Mathematics, Firoozkooh Branch, Islamic Azad University, Firoozkooh, Iran
P A P E R I N F O
Paper history: Received 29 July 2014
Received in revised form 22 October 2014 Accepted 13 November 2014
Keywords:
Incremental Dynamic Analysis Data Envelopment Analysis Ranking
Ground Motion
هﺪﯿﮑﭼ
ﻒﻠﺘﺨﻣيﺎﻫهزﺮﻟﻦﯿﻣززاياﻪﻋﻮﻤﺠﻣيازاﻪﺑهزﺎﺳﺖﺳامزﻻ،ﯽﺸﯾاﺰﻓاﯽﮑﯿﻣﺎﻨﯾدﻞﯿﻠﺤﺗزاﻞﺻﺎﺣﯽﻨﺤﻨﻣﻦﯿﯿﻌﺗرﻮﻈﻨﻣﻪﺑ دﺮﯿﮔراﺮﻗﯽﻄﺧﺮﯿﻏﯽﮑﯿﻣﺎﻨﯾدﺰﯿﻟﺎﻧآﺮﺛاﺖﺤﺗ
.
ﯽﻄﺧﺮﯿﻏوﯽﻄﺧﻒﻠﺘﺨﻣيﺎﻫهدوﺪﺤﻣردهزﺎﺳرﺎﺘﻓرﻪﮑﻨﯾاياﺮﺑﻦﯿﻨﭽﻤﻫ
ﻦﯿﻣزﻪﮐﺖﺳامزﻻ،ددﺮﮔﯽﺳرﺮﺑ ﺪﻧﻮﺷهدروآردسﺎﯿﻘﻣﻪﺑﻒﻠﺘﺨﻣﺐﯾاﺮﺿﺎﺑﻒﻠﺘﺨﻣيﺎﻫهزﺮﻟ
.
هدﺎﻔﺘﺳاﺎﺑﻪﻌﻟﺎﻄﻣﻦﯾارد
ﺎﻫهزﺮﻟﻦﯿﻣزﻪﻋﻮﻤﺠﻣردﺎﻫهزﺮﻟﻦﯿﻣززايدوﺪﺤﻣداﺪﻌﺗﺎﻫهدادﯽﺸﺷﻮﭘﻞﯿﻠﺤﺗلﺪﻣزا ﻪﮐدﻮﺷﯽﻣبﺎﺨﺘﻧايرﻮﻃ
ﺑاﺮﺑدوﺪﺤﻣيﺎﻫهزﺮﻟﻦﯿﻣزيازاﻪﺑﯽﺸﯾاﺰﻓاﯽﮑﯿﻣﺎﻨﯾدﻞﯿﻠﺤﺗزاﻞﺻﺎﺣﯽﻨﺤﻨﻣﻂﺳﻮﺘﻣ ﻞﯿﻠﺤﺗزاﻞﺻﺎﺣﯽﻨﺤﻨﻣﻂﺳﻮﺘﻣﺎﺑﺮ
ﺪﺷﺎﺑﺎﻫهزﺮﻟﻦﯿﻣزﻞﮐﻪﻋﻮﻤﺠﻣيازاﻪﺑﯽﺸﯾاﺰﻓاﯽﮑﯿﻣﺎﻨﯾد
.
ﻪﻋﻮﻤﺠﻣودوﻪﻘﺒﻃﻪﻧيدﻻﻮﻓفوﺮﻌﻣهزﺎﺳﻪﻧﻮﻤﻧناﻮﻨﻋﻪﺑ
رﺎﻬﭼ،هزﺮﻟﻦﯿﻣززاﻪﻋﻮﻤﺠﻣﺮﻫردﻪﻌﻟﺎﻄﻣﻦﯾاردهﺪﺷﻪﺋاراشورزاهدﺎﻔﺘﺳاﺎﺑوﺪﺷﻪﺘﻓﺮﮔﺮﻈﻧردهزﺮﻟﻦﯿﻣزﻒﻠﺘﺨﻣ يرﻮﻃدرﻮﮐر ردﯽﺑﺎﺨﺘﻧايﺎﻫهزﺮﻟﻦﯿﻣزوﺎﻫهزﺮﻟﻦﯿﻣزﻞﮐﻪﻋﻮﻤﺠﻣزاﻞﺻﺎﺣﻂﺳﻮﺘﻣﯽﻨﺤﻨﻣتوﺎﻔﺗﻪﮐددﺮﮔﯽﻣبﺎﺨﺘﻧا
ﺪﺷﺎﺑﯽﻟﻮﺒﻗﻞﺑﺎﻗﺪﺣ
.