579
FUZZY BP NETWORK FOR FAULT SELF-DIAGNOSIS
SYSTEM OF AUTOMATIC TRANSMISSION
XUEYUAN WANG
Economy & Management College of Neijiang Normal University, Sichuan, CHINA
ABSTRACT
According to the design procedure of fault self-diagnosis system and features of automatic transmission system, the list of relation and mapping between fault symptoms and fault causes are made in this paper. Applying the approach of fault self-diagnosis based on fuzzy neural network, fault diagnosis of the automatic transmission electronic control system is realized. The structure of fuzzy neural network and its corresponding learning method and retreating strategy about the training samples are introduced in this paper. Using MATLAB as simulation platform, this fault diagnosis method is simulated with neural networks toolbox. The simulation results show that this fault diagnosis approach is effective and applied.
Keywords: Fuzzy Logic, Neural Network Technique, Automatic Transmission (AT), Fault Diagnosis
1. INTRODUCTION
Automatic transmission is an important component of automotive power system and plays a very vital role on full-vehicle performance [1]. In the working process of automatic transmission, because of environmental influence or improper operation, transmission control unit(TCU), sensors and actuators of automatic transmission maybe have fault. If some parts are out of order, the automobile performance will decrease apparently. Even accident may take place. Therefore, the study of fault self-diagnosis of automatic transmission system has important significance. Using this system, faults can be discovered in time. Fault handling can be done simultaneously. Under some certain conditions, vehicle can still work. Therefore the personnel, equipments and environment will be protected from damage.
According to the characteristics of automatic transmission, the fault self-diagnosis technique was combined with fuzzy control and neural network technology. The fault knowledge was studied by using neural network. This method is the same with other automatic transmissions, can improve quality and efficiency of fault self-diagnosis.
A. Scheme of Fault Self-Diagnosis
Fault self-diagnosis can be regarded as a processes of two steps [2][3].
The first step is extraction of fault symptoms. It means data extraction and precondition. For automatic transmission electronic control system,
many sensors are used, the redundancy
relationships between electronic signals are very strong. Inputs of fault symptoms can be analyzed and extracted synthetically by use of these redundancy relationships and expert experiences.
The second step is the continuous mapping of fault symptom vector X and fault reason vector F. Fuzzy inference can be used, outputs of fault vector F elements are taking value in reliability region [0,1] of continuous number.
n n
X∈R ⇒ ∈F R
1 2
{ , n}, n [0,1]
F = f f f f ∈
There is fuzziness in some faults or symptoms in electronic control system, so it is not able to be described by two-valued logic simply. Fault diagnosis is based on some symptoms generally. Fault causes leading to these symptoms can be judged. So Fault diagnosis is a question of fuzzy inference. Fault diagnosis based on fuzzy inference need to solve the key problems about how to establish fuzzy diagnostic rules database. On the basis of expert experience and knowledge, fuzzy diagnostic rules are built generally. Therefore expert level of studying system performances will influence accuracy of diagnosis.
580 network self-learning. Fuzzy neural network can extract empirical rules from sample data directly; obtain fuzzy rules getting closer to the truth by learning; overcome subjectivity of fuzzy logic system to some extent. The methods converting rules and deductions into mapping of neural network will be more suitable for fault self-diagnosis of electronic control system than traditional methods.
B. Fault Self-Diagnosis Process
Fuzzy neural network fault self-diagnosis working process is as follows [4][5].
1) Working condition data is collected when fault system is running. Symptom parameters are extracted and normalized.
2) The symptom parameters normalized are blurred, and then are converted into fuzzy sets which are represented by membership.
3) Using the data fuzzed as input parameters of neural network, fault causes are reasoned from fault Symptoms by use of BP algorithm.
4) Based on outputs of network, fuzzy membership vectors of fault causes are obtain. The types of fault causes are determined by analyzing the vectors.
C. Structure of Fuzzy Neural Network
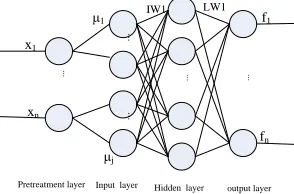
A multilayer feed forward neural network of serial-shape structure is adopted in this paper. The network is divided into four layers: pretreatment layer belonged to fuzzy part; the other three layers (i.e. input layer, hidden layer, output layer) belonged to neural network part.
x1
.. .
μ1
μj
IW1
xn
f1
fn
Pretreatment layer
LW1
Input layer Hidden layer output layer
.. .
.. .
.. .
[image:2.612.125.272.518.615.2].. .
Figure 1: Structure of fuzzy neural network
Where Xi are input variables and fn are output
fault vectors in Figure.1. j( , 1, 2 )
i i j n
µ = are
degrees of membership, i represents the i-th
variable of input, j represents fuzzy division
number of corresponding variables.
IW and LW are the connecting weights of hidden layer and the connecting weights of output layer respectively.
D. Improved neural network BP algorithm
Standard BP algorithm can be treated as a static optimization steepest descent algorithm. However, due to the number of optimization parameters is too many, and previous experiences are not considered, so that there must be a shortcoming of slow speed of convergence. The second serious defect is the problem of local extremum. There are many extreme points on hypersurface of objective function[6]. In accordance with the above optimization method, the local extremums nearby initial value are converged to usually.
To solve these problems, the additional momentum items are drawn into. The shortcoming, which BP network will fall into local minimum point, can be avoided. Weight adjustment will be made stability and smoothing. More superior solution can be got. The training time can be shortened, and convergence rate can be speeded up by adaptive learning rate. Network is built by the combination of the momentum item addition and adaptive learning rate. Combining additional momentum items with self-adaptive learning rate, Sigmoid transfer function having rich non-linear expressive ability is used to optimize BP algorithm. The convergence rate will be speeded and the accuracy of network training will be improved.
The improved BP algorithm with momentum item and self-adaptive learning rate are shown as follows:
( 1) ( ) ( )[(1 ) ( ) ( 1)]
w k+ =w k +α k −η D k +ηD k− (1)
( )k 2λ (k 1)
α = α − (2)
sgn[ ( ) (D k D k 1)]
λ= − (3)
where: w k( ) represents single connecting weight
coefficient, and also represents connecting weight
vector; ( )
( )
D k E
w k
= −∂
∂ represents negative gradient
of time k, D k( −1) represents negative gradient of
time (k-1); α represents learning rate, α0; η
represents momentum factor, 1≤η0.
581 means that the decline speed is too slow. The step length can be doubled. If the negative gradient directions of two consecutive iterations are opposite, it means that the decline speed is excessive fast. The step length can be halved.
2. FAULT SELF-DIAGNOSIS NETWORK MODEL OF AT ELECTRONIC CONTROL SYSTEM
Fault self-diagnosis requests that electronic control system has two functions: acquiring fault information real-time online and unmanned intervention reasoning automatically [7]. Making full use of acquiring field fault information to determine fault causes and fault position rapidly. Automation and intellectualization can be realized.
A. Fault symptoms and fault sets
According to comprehensive literatures and diagnosis expert advice, the several fault types of automatic transmission electronic control system can be summarized as follows:
Sensor faults: frequency signal sensor faults, such as speed sensor, engine speed sensor, input axis speed sensor; analogue signal sensor faults, such as throttle opening sensor, pedal sensor, clutch engaging sensor, choosing position sensor, shift position sensor; switching signal sensor faults, such as all kinds of on-off switch, etc..
Actuator faults: such as choosing motor fault, shifting motor fault, clutch motor fault.
Transmission control unit faults: such as power supply fault, driving chips fault, etc.
Inputs of fault symptom can be summarized as follows:
Analog signals: such as pedal position signal, throttle opening signal, clutch engaging signal, choosing position signal, shifting position signal, etc. Frequency signals:
such as speed signal, engine speed signal, input axis speed signal, transmission ratio, etc. Under different gear positions, redundant relationship is different. Therefore, transmission ratio signal symptom is drawn.
B. Symptom signals fuzzification
The deviation between real input value of electric signal in fault system and ideal value under the same gear position is used as fault symptom signal. The signal that fuzzy diagnosis network treats is fuzzy quantity, so the range of deviation value is
divided as follows: zero (ZE), positive small (PS) and positive big (PB). The specific number of fuzzy subsets of fault symptom inputs is determined by practical situation. Frequency signals, pedal signal and throttle opening signal are divided into three fuzzy subsets: zero (ZE), positive small (PS) and positive big (PB) in this paper. The residual analogue signals and transmission ratio signal are divided into a fuzzy subset PB.
The common membership functions are trigonometric function (trimf), ladder function (trapmf) and gauss type function (gaussmf). Trigonometric function and ladder function are beneficial to calculation and treatment.
They are suitable for solving questions not requiring higher completeness of fuzzy information [6]. Gauss type function is smooth and stationary. It describes fuzziness relevantly. But the calculation is complex relatively. Membership functions of fault symptom signals used in system are described in Figure.2. It is needed to point out that transmission ratio signal can be blurred directly if gear position is confirmed.
0 1/3 2/3 +1 X NE PS PB
μ
0 +1 X
PB
μ
Figure 2: Normalized Graphics Of Fuzzy Input Division
C. Analysis of Analytical Redundant Relationship between sensors and actuators
Ideal value of working condition data of automatic transmission electronic control system are acquired by a lot of experimental data statistics of sample vehicle and the analytical redundancy relationship between sensors and actuators.
Analytical redundancy is redundant functional relationship existing among measurable variables of diagnosed object. There are two types: direct
redundancy and instantaneous redundancy.
Analysis on system structure and function is precondition that determines analytical redundancy. Combined with mathematics analysis, all analytical redundancy relationships in automatic transmission electronic control system can be determined.
582 1. Suppose y t ii( )( =1, 2,... )m is i-th output of sensors, everyy ti( )≠0.
If a1 1y t( )+a y t2 2( )a y tm m( )=0, where ai is not all 0, then there are direct redundancy among these m sensors.
2. If inputs and outputs can be expressed by dynamic mathematical model, which is the CARIMA (Controlled Auto-Regressive Moving Average) model:
1 1
1 0 1
(1 az a zn n) ( )y k (b b z b zn n) ( )u k e k( )
− − − −
+ + + = + +
(4)
Where u(k)is input, y(k)is output, e(k)is noise. Transient redundancy exists between input and output for SISO (single input single output) system.
Using about mathematics analysis, main
redundant relationship can be obtained:
1. There is direct redundancy among speed sensor, engine speed sensor and input axis speed sensor.
2. There is transient redundancy among choosing motor, shifting motor, position signal, and transmission ratio.
3. There is direct redundancy between pedal sensor and throttle opening sensor.
4. There is transient redundancy between throttle opening sensor and engine speed sensor.
5. There is transient redundancy between clutch engaging sensor and clutch motor.
D. Data Acquisition and Processing
The sample data of every gear position of a failure automatic transmission system were collected under different working condition [10]. In accordance with the redundancy relationship existing among signals, and the rather accurate ideal values gotten from theoretical derivation under corresponding conditions in laboratory, the deviations were calculated.
It is difficult to store a variety of ideal values of input signals under different working condition in the TCU when the trials are done on the test vehicle. Analyzing shifting schedule, it is known that each input x has a limit scope in different gear position. It is possible to calculate the deviation using the following formulas.
max max
| |,
x x l x l
∆ = − > (5)
min max
0,
x l x l
∆ = ≤ ≤ (6)
min min
| |,
x x l x l
∆ = − < (7)
If the monitoring value is in area [lmin,lmax], it
means that the system works regularly. If not, it means that the system works irregularly.
Using the absolute values of deviations as inputs of fault symptom, fuzzy partition can be simplified. Compared with using values of deviations as inputs, it is confirmed that there is no difference on the control performance. But the number of control rules is decreased. In this way, network size is smaller and training speed is faster.
Because the value ranges of the input fault symptoms are different and numerical difference is rather large in the fault diagnosis system, it is inconvenience to calculate, and the network training time and performances will be affected. It is necessary to normalize the inputs of the network.
If the actual input x0* is in the area [x*min,xmax* ],
the universe of discourse is in the area [xmin,xmax],
then,
* *
*
min max max min
0 ( 0 )
2 2
x x x x
x = + +k x − + (8)
max min
* *
max min
x x
k
x x
− =
−
Where k is a proportion factor.
Using the above rules, the data are normalized to the area [0,1] in [6][7].
On the basis of the analysis of statistics of the experiences and expert knowledge, the distributions of membership degree of possible fault samples are given. The learning samples can be collated and organized with it for neural network.
The occasional faults exist in the actual test.
The parameter sample values of the occasional faults will have a negative impact on learning and training for the fuzzy neural network. So that there may be a local error of judgment [11][12]. To avoid the occasional faults, two solutions are proposed.
583 the size of the mean deviation. If a fault is an occasional, the mean value is a small deviation after it is preprocessed. The accuracy and reliability of the sample parameters are improved effectively.
The second is the processing of fuzzy membership vectors of output fault causes. In a testing period, if a fault membership is in area (0.05, 0.20), it means there may be an occasional fault. Delaying time retesting, if the corresponding membership degree of fault cause returns to 0 before N times detecting presetting is over, detecting is stop. The fault will be an occasional. But the counter will plus 1 at the same time. If the counted number is more than 100, the fault is not an occasional fault and needs to be processed.
E. Fault Self-diagnosis network model
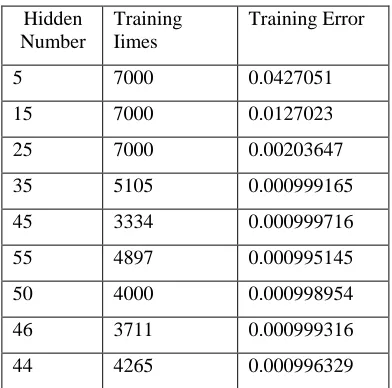
[image:5.612.98.294.437.631.2]The training sample set is made based on field and expert experiences. The simulation used the three-tier training model of BP network. The specific model is shown in Fig.1.The number of input layer neurons of diagnosis network 24 is equal to the number of fuzzy sets of fault signals symptoms. The number of hidden layer neurons is determined by trial-and-error. The network which had different hidden nodes was trained by a same sample set. The result is shown in the Table 1.
Table 1 Training Results
Table 1 shows that convergence rate of network is fastest when the number of hidden layer neurons is 45, if training error is very small. The least number of training times is only 3334.It can satisfy the system performance.
Therefore, the selected number of hidden neurons is 45. The number of output neurons is the number of fault types is 13.
Testing the performances of the network which different transfer function forms are combined, we can get a best result if input-hidden layer selects Sigmoid function and hidden-output layer selects linear function Purelin. Every output of fuzzy neural network represents a specific fault, its value is in the range of [0,1]. When the network output corresponding to the fault is 1, the fault must exist.
BP network is trained by the function Traingdx (gradient descending with momentum and self-adaptive LR return path). The training target error is 0.001, the initial learning rate is set as 0.001, the momentum factor η is 0.9, the initial weight and threshold value chooses random number between -1 to 1.
For the fault self-diagnosis system, corres- ponding to 13 kinds of common typical failures of electronic control system, 90 samples are collected and pretreated. The 45 samples are taken out to be trained, and the other samples are used for testing and simulation.
3. SIMULATION OF FAULT SELF-DIAGNOSISBASED-ONFUZZYNEURAL NETWORK
Diagnosis network is trained by learning samples. Initializing weight value and threshold value are random, therefore convergent results of diagnosis network are different every time [12][16]. By many times simulation, the optimal weight value and threshold value are stored in the end of network convergence and database of diagnosis network is established. But under the condition of the same training parameters, the network using BP algorithm can not converge. The simulation results are shown in Figure.3, Figure.4 and Figure.5. respectively. From Figure.4 and Figure.5, performance error is about 0.001 after 3334 times training has been done. The results show that the neural network structure and all kinds of parameters are relatively suitable in this paper.
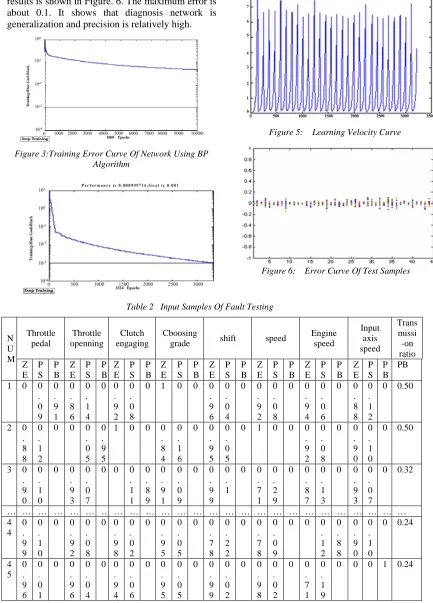
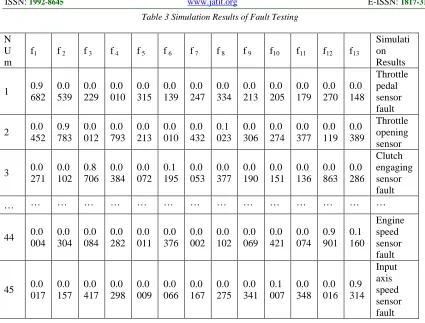
Diagnosis network is simulated for 45 fault examples of automatic transmission electronic control system. The sample symptom inputs of fault testing are shown in Table 2. The simulation results of diagnosis network are shown in Table 3. (partial samples). Comparing the diagnosis results with the fault reasons of samples, the conclusion can be drawn. The accuracy rate of fault prediction of the Hidden
Number
Training Iimes
Training Error
5 7000 0.0427051
15 7000 0.0127023
25 7000 0.00203647
35 5105 0.000999165
45 3334 0.000999716
55 4897 0.000995145
50 4000 0.000998954
46 3711 0.000999316
584
fault self-diagnosis network can reach 95%. The
error curve of the test samples simulation and actual results is shown in Figure. 6. The maximum error is about 0.1. It shows that diagnosis network is generalization and precision is relatively high.
Figure 3:Training Error Curve Of Network Using BP Algorithm
[image:6.612.93.522.87.446.2][image:6.612.83.516.123.726.2]
Figure 4: Training Error Curve
Figure 5: Learning Velocity Curve
Figure 6: Error Curve Of Test Samples
N U M Throttle pedal Throttle openning Clutch engaging Cboosing
grade shift speed
Engine speed Input axis speed Trans missi -on ratio Z E P S P B Z E P S P B Z E P S P B Z E P S P B Z E P S P B Z E P S P B Z E P S P B Z E P S P B PB
1 0 0 . 0 9 0 . 9 1 0 . 8 6 0 . 1 4
0 0 . 9 2 0 . 0 8
0 1 0 0 0 . 9 6 0 . 0 4
0 0 . 9 2 0 . 0 8
0 0 . 9 4 0 . 0 6
0 0 . 8 8 0 . 1 2
0 0.50
2 0 . 8 8 0 . 1 2
0 0 0 . 0 5 0 . 9 5
1 0 0 0 . 8 4 0 . 1 6
0 0 . 9 5 0 . 0 5
0 1 0 0 0 . 9 2 0 . 0 8
0 0 . 9 0 0 . 1 0
0 0.50
3 0 . 9 0 0 . 1 0
0 0 . 9 3 0 . 0 7
0 0 0 . 1 1 0 . 8 9 0 . 9 1 0 . 0 9
0 0 . 9 9 0 . 1
0 0 . 7 1 0 . 2 9
0 0 . 8 7 0 . 1 3
0 0 . 9 3 0 . 0 7
0 0.32
… … … … 4 4 0 . 9 9 0 . 1 0
0 0 . 9 2 0 . 0 8
0 0 . 9 8 0 . 0 2
0 0 . 9 5 0 . 0 5
0 0 . 7 8 0 . 2 2
0 0 . 7 8 0 . 0 9
0 0 0 . 1 2 0 . 8 8 0 . 9 0 0 . 1 0
0 0.24
4 5 0 . 9 6 0 . 0 1
0 0 . 9 6 0 . 0 4
0 0 . 9 4 0 . 0 6
0 0 . 9 5 0 . 0 5
0 0 . 9 9 0 . 0 2
0 0 . 9 8 0 . 0 2
0 0 . 7 1 0 . 1 9
[image:6.612.84.507.372.724.2]0 0 0 1 0.24
585
Table 3 Simulation Results of Fault Testing
Table4 Statistical Results
Because the results which the nerve network converges and looks for optimal results are not same each time, neither are the diagnosis network models. The above testing model is the optimal model got from training many times. Without loss of generality, we use same samples to test 10 networks of random training generation. The testing includes the networks using BP algorithm
and optimized BP algorithm respectively. Considering the BP algorithm can not reach a very small error, the error is chosen to 0.01 to test. Statistical results are shown in Table 4.
Statistical results show the network using optimal BP algorithm can make decision for diagnosis system.
4. CONCLUSIONS
The model of fault self-diagnosis based-on fuzzy neural network can diagnose faults in automatic transmission electronic control system effectively. Transplanting diagnosis model into TCU, states of the system can be monitored in real time. This method provides a basis for fault treatment on-line effectively. Simulation results N
U m
f1 f 2 f 3 f 4 f 5 f 6 f 7 f 8 f 9 f10 f11 f12 f13
Simulati on Results
1 0.9
682 0.0 539
0.0 229
0.0 010
0.0 315
0.0 139
0.0 247
0.0 334
0.0 213
0.0 205
0.0 179
0.0 270
0.0 148
Throttle pedal sensor fault
2 0.0
452 0.9 783
0.0 012
0.0 793
0.0 213
0.0 010
0.0 432
0.1 023
0.0 306
0.0 274
0.0 377
0.0 119
0.0 389
Throttle opening sensor
3 0.0
271 0.0 102
0.8 706
0.0 384
0.0 072
0.1 195
0.0 053
0.0 377
0.0 190
0.0 151
0.0 136
0.0 863
0.0 286
Clutch engaging sensor fault
… … … …
44 0.0
004 0.0 304
0.0 084
0.0 282
0.0 011
0.0 376
0.0 002
0.0 102
0.0 069
0.0 421
0.0 074
0.9 901
0.1 160
Engine speed sensor fault
45 0.0
017 0.0 157
0.0 417
0.0 298
0.0 009
0.0 066
0.0 167
0.0 275
0.0 341
0.1 007
0.0 348
0.0 016
0.9 314
Input axis speed sensor fault
1 2 3 4 5 6 7 8 9 10 Correct rate
Average time Optimizatio
algorithm of BP
40 43 41 42 41 42 43 42 43 40 92.7% 37.450000s
BPalgorith m
586 show that security and reliability of the system are improved.
ACKNOWLEDGMENT:
This work was supported by Tourism
Development Research Center of Sichuan under grant No. LYM12-23.
REFRENCES:
[1] Karuppan Corinne M., Karuppan Muthu, “Fault management in an automatic transmission environment”, Proceedings Annual Meeting of the Decision Sciences Institute, Vol.3, 1996, pp.1448-1450.
[2] Clark R.N, “Fault Diagnosis in Dynamic Systems”, Theory and Application, Prentice-Hall, Englewood ,1989, pp.14-19.
[3] Isermann R. Supervision, “Fault-detection and Fault-diagnosis methods-An introduction”, Control Eng. Practice, Vol. 5, No. 15, 1997, pp.639-652.
[4] Isermann R. and Ayoubi M. “Fault detection and diagnosis with neuro-fuzzy-systems,” Aachen Germany: EUFIT-96, 1996, pp.2-5. [5] Maki.Y and Loparo.K.A., “A Neural network
approach to fault detection and diagnosis in Industrial processes”, IEEE Transactions on control system technology, Vol.5, No. 6, 1997, pp.52-54.
[6] Sun Zengxin. “Theory and technology on
intelligent control”, Tsinghua university
publishing house, 1997, pp.55-136.
[6] W.B.Ribbens, “A Mathematical Model Based Method for Diagnosing Faults in Automotive Electronic Systems”, SAE 910069.
[7] Paul M Frank, “Fault Diagnosis in Dynamic Systems Using Analytical and Knowledge Based Redundancy”, A Survey and Some New Results, Automatica, No. 3,1990, pp.49-54. [8] LUO R C, “Dynamic Multi2sensor Data Fusion
System for Intelligent Robots”, IEEE Journal of Robotics and Automation, Vol.4, No. 4, 1988, pp. 386-396.
[9] Momniyama, “System and Electronic
Components of Automated Mechanical
Transmission”, HINO EE-Drive System,
Journal of JSAE, Vol.41, No.2, 1987, pp.60-65.
[10] Bernhard Wust, Manfred Bek, An., “Advanced Electronic Control and Diagnostic System for
Automatic Transmission”, SAE 942330.
[11] Shame H. Rachedi, Leonaard S. Tedesco, “Development of Diagnostic Tools in
Automotive Electronics”, SAE 871582.