DEVELOPMENT AND VALIDATION OF STABILITY
INDICATING RP-HPLC METHOD FOR THE SIMULTANEOUS
ESTIMATION OF ROSUVASTATIN AND EZETIMIBE
IN COMBINED DOSAGE FORM
M. Laksmi Monika, Sireesha D.* and Vasudha Bakshi
Department of Pharmacy, Anurag Group of Institutions (Formerly Lalitha College of Pharmacy), Venkatapur, Ghatkesar, Medchal, Telangana-500088.
ABSTRACT
A simple, accurate stability indicating reverse phase high performance liquid chromatography (RP-HPLC) method for the simultaneous estimation of Rosuvastatin and Ezetimibe has been developed and validated. Chromatographic analysis was performed on Shimadzu LC-20AD Waters X-bridge C18, 5µm (4.6 x 250mm) column at ambient temperature and a UV detector, using Acetonitrile : Methanol (30:70% v/v) as the mobile phase, with a flow rate of 1ml/min and detection wavelength at 230nm. The retention times of rosuvastatin and ezetimibe were 2.0mins and 3.0mins respectively. Calibration graphs were linear over the concentration ranges of 5-25µg/ml for both rosuvastatin and ezetimibe. The accuracy of proposed method was determined by recovery studies and was found to be 98% to 102% for both rosuvastatin and ezetimibe. To establish the stability of the
method, degradation studies were carried out in acid, base, oxidation, thermal and photolytic (UV chamber) conditions and the percent degraded was calculated.
KEYWORDS: Rosuvastatin, Ezetimibe, Degradation study, RP-HPLC.
INRODUCTION
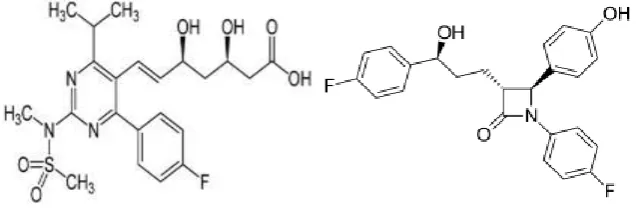
Rosuvastatin[1,2] (Fig:1) is a competitive inhibitor of HMG-CoA reductase. HMG-CoA reductase catalyzes the conversion of HMG-CoA to mevalonate, an early rate-limiting step in cholesterol biosynthesis. Chemically it is
(3R,5S,6E)-7-[4-(4-fluorophenyl)-2-(N-Volume 6, Issue 8, 2369-2381. Research Article ISSN 2277– 7105
*Corresponding Author
Sireesha D.
Department of Pharmacy,
Anurag Group of
Institutions (Formerly
Lalitha College of
Pharmacy), Venkatapur,
Ghatkesar, Medchal,
Telangana-500088. Article Received on 18 June 2017,
Revised on 09 July 2017, Accepted on 30 July 2017
methylmethanesulfonamido)-6-(propan-2-yl)pyrimidin-5-yl]-3,5-dihydroxyhept-6-enoic acid. Ezetimibe[3,4] (Fig:2) acts by decreasing cholesterol absorption in the small intestine. It may be used alone when other cholesterol lowering medications are not tolerated, or together with statins, when statins alone do not control cholesterol. Ezetimibe is also used in combination therapy with HMG-CoA reductase inhibitors. Chemically it is (3R,4S)-1-(4-fluorophenyl)-3-[(3S)-3-(4-fluorophenyl)-3-hydroxypropyl]-4-(4-hydroxyphenyl)azetidin-2-one. Ezetimibe has a mechanism of action that differs from those of other classes of cholesterol-reducing compounds (HMG-CoA reductase inhibitors, bile acid sequestrants, fibric acid derivatives, and plant stanols).
Fig. 1: Structure of Rosuvastatin. Fig. 2: Structere of Ezetimibe.
Literature survey[5-11] revealed that there were methods for estimation of Rosuvastatin(RST) and Ezetimibe (EZE) in combined dosage forms and for individual drugs using UV, HPLC and HPTLC. Here is an attempt made to develop a stability indicating RP-HPLC method for simultaneous estimation of RST and EZE. The developed method was validated according to ICH guidelines.
Experimental
MATERIALS AND METHODS
Instrumentation and apparatus: The analysis was carried out by using Shimadzu
LC-20AD HPLC with UV detector. Column used was Waters X-bridge C18, 5µm (4.6 x 250mm). All materials were weighed on SHIMADZU Electronic balance model AX 200, to dissolve the drug completely without leaving any particles Ultra Sonicator (Fast clean) model 2k811046 was used at room temperature and vaccum filter pump (PCI analytics) was also used during the analysis for degassing the mobile phase.
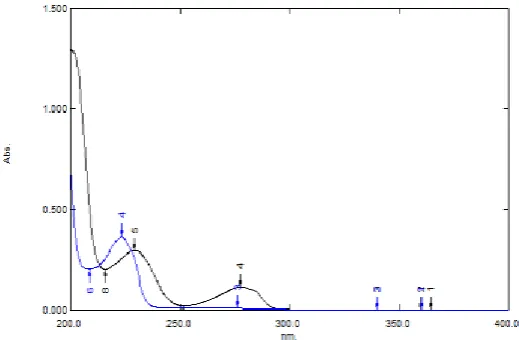
Selection of detection wavelength: The working standard solutions of RST and EZE were scanned separately in UV range. From the spectra, the detection wavelength selected was 230nm, as both the drugs are having considerable absorption (Fig.3).
Fig. 3: Overlain Normal spectra of Rosuvastatin and Ezetimibe in water.
Method Development
Preparation of Standard stock solutions
Accurately weigh and transfer 10 mg of RST and EZE into a two separate 10ml clean dry volumetric flasks, add about 5ml of the mobile phase and shake till the drug dissolves completely. API solutions of RST and EZE are not completely clear then sonicate the solutions for about 5mins and then make up to the volume with mobile phase to get 1000µg/ml of standard stock solution of both RST and EZE.
Preparation of working standard solutions
Transfer separately 1ml of standard stock solution of both RST and EZE into two separate 10ml volumetric flasks, make upto the volume to obtain the concentration of 100µg/ml of working standard solutions for both the drugs.
Preparation of Calibration graph
Fig. 4: Chromatogram of Rosuvastatin and Ezetimibe.
Fig. 5: Linearity graph of Rosuvastatin.
[image:4.595.142.455.520.706.2]Range: Range was calculated from linearity studies. It was found to be 5-25µg/ml for both RST and EZE.
Sample analysis: 10 tablets were weighed to get the average weight of each tablet. Tablets
were placed in the mortar and finely powdered. The tablet powder equivalent to 10mg of Rosuvastatin and 10mg of Ezetimibe was transferred into 10ml volumetric flask. About 5ml of mobile phase was added to the flask and sonicated for about 5mins and made up to the volume with mobile phase.
The contents were filtered through Whatmann filter paper. From this sample stock solution, 1ml was transferred into a 10ml volumetric flask. The volume was made up to the mark with mobile phase. The solution prepared was injected into the HPLC to obtain the %content of RST and EZE in the tablets (Fig.7).
Fig.7: Chromatogram of Formulation.
Forced Degradation Studies
Forced degradation studies were performed on both RST and EZE. Both the drugs were subjected to stress conditions which include acid hydrolysis (0.1N HCl), base hydrolysis (0.1N NaOH), thermal (50ºC), oxidation (3% H2O2) and photolytic (exposure to light). The
monitoring period for acid, base and oxidation was 24hrs and for thermal (50ºC in hot air oven) and photolytic (longer wavelength in UV cabinet) it was 5-6hrs. After completion of degradation processes, the solutions were neutralized and diluted with mobile phase.
Acid Hydrolysis: Accurately weighed 10mg of RST and 10mg of EZE APIs and transferred
the volume was made up to the mark with mobile phase and kept aside for 24hrs. Then, after completion of 24hrs, about 0.1ml of the above solution was transferred into 10ml of volumetric flask and diluted to 10ml using mobile phase (10µg/ml of both RST and EZE). Then this solution was injected into HPLC and chromatogram was recorded(Fig.8).
Fig. 8: Chromatogram of Rosuvastatin and Ezetimibe in acid degradation (0.1N HCl).
Base Hydrolysis: Accurately weighed 10mg of RST and 10mg of EZE APIs and transferred
into 10ml of volumetric flask to which 0.1N NaOH was added. Shaken for some time and then the volume was made up to the mark with mobile phase and kept aside for 24hrs. Then, after completion of 24hrs, about 0.1ml of the above solution was transferred into 10ml of volumetric flask and diluted to 10ml using mobile phase (10µg/ml of both RST and EZE). Then the solution was injected into HPLC and chromatogram was recorded(Fig.9).
Fig. 9: Chromatogram of Rosuvastatin and Ezetimibe in base degradation (0.1N
[image:6.595.147.446.538.710.2]Oxidative hydrolysis: Accurately weighed 100mg of RST and 100mg of EZE APIs and transferred into 100ml volumetric flask to which 30ml of 3% Hydrogen Peroxide was added. The solution was kept aside for 24hrs. at room temperature. After completion of 24hrs the volumetric flask was filled up to the mark with mobile phase. Then about 1ml of the above solution was transferred into 10ml of volumetric flask and diluted to 10ml using mobile phase (10µg/ml of both RST and EZE). Then the solution was injected into HPLC and chromatogram was recorded (Fig.10).
Fig. 10: Chromatogram of Rosuvastatin and Ezetimibe in oxidation condition.
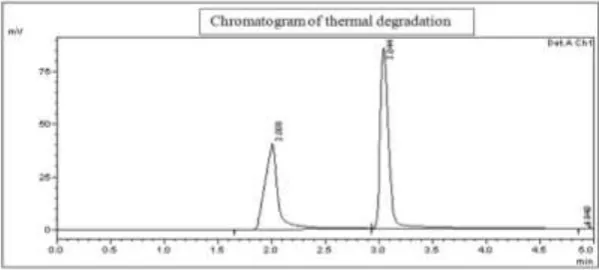
Thermal degradation: Accurately weighed 100mg of RST and 100mg of EZE APIs and
transferred into a clean, dry petri dish. Petridish was placed in the oven at a temperature of 50
0
C for 5-6 hrs. After completion of 5-6hrs the sample was removed. About 10mg of drug was transferred into 10ml volumetric flask and make up the volume with mobile phase. Then about 0.1ml is transferred into a 10ml volumetric flask and make up to the mark with mobile phase (10µg/ml of both RST and EZE). Then the solution was injected into the HPLC system and the chromatogram was recorded(Fig.11).
[image:7.595.148.448.600.735.2]
Photolytic degradation: Accurately weighed 100mg of RST and 100mg of EZE APIs and transferred into a clean, dry petri dish. Petridish was placed in the UV Cabinet at long wave for about 5-6 hrs. After completion of 5-6hrs the sample was removed. About 10mg of drug was transferred into 10ml volumetric flask and make up the volume with mobile phase. Then about 0.1ml is transferred into a 10ml volumetric flask and make up to the mark with mobile phase (10µg/ml of both RST and EZE). Then the solution was injected into the HPLC system and the chromatogram was recorded (Fig.12).
Fig. 12: Chromatogram of Rosuvastatin and Ezetimibe of Photolytic degradation.
Validation of the Method
The analytical method was validated with respect to parameters such as linearity, range, precision, accuracy, selectivity and robustness.
Linearity
The linearity of the method was determined in the concentration range of 5-25µg/ml for both RST and EZE. Each solution was injected and calibration curve was plotted using peak area versus concentration data of both the drugs shown in Fig. 5 and 6. The correlation coefficient for both the drugs was found to be 0.999 and the regression equations were y = 29944x + 34136 and y = 52859x + 54123 for RST and EZE respectively.
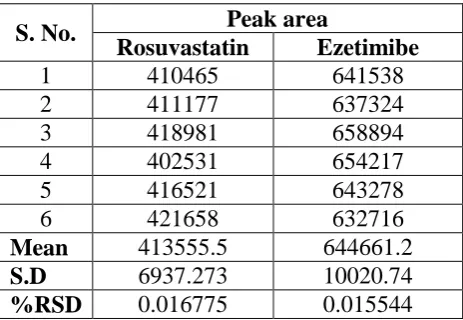
Precision
Table. 1: Intraday Precision.
S. No. Peak area
Rosuvastatin Ezetimibe
1 410465 641538 2 411177 637324 3 418981 658894 4 402531 654217 5 416521 643278 6 421658 632716
Mean 413555.5 644661.2
S.D 6937.273 10020.74
%RSD 0.016775 0.015544
Precision studies were also carried out by injecting six replicate injections of the standard drug mixture on six different days. This process is called interday precision. The results were calculated in terms of %RSD. The results are shown in Table 2.
Table. 2: Interday precision.
S. No. Peak area
Rosuvastatin Ezetimibe
1 410465 641538 2 326731 568333 3 335863 583920 4 364215 593647 5 354216 564321 6 372165 574305
Mean 360609.2 587677.3
S.D 29776.23 28457.92
%RSD 0.082572 0.048424
Accuracy: Accuracy (% Recovery) was evaluated at three different concentrations equivalent
to 50, 100 and 150% of the target concentration of active ingredients, by adding a known amount of each of the standard to a sample of known concentration of both drugs and calculating the % recovery for each concentration. The results are shown in Table 3.
Table. 3: Recovery studies.
S. No. Amount of marketed formulation (µg/ml) Amount of API added (µg/ml) Total amount (µg/ml)
Peak area at 230nm
Total amout of drug found
(µg/ml)
% Recovery
RST EZE RST EZE RST EZE
Specificity: Sample matrix did not show any interference with the analyte peaks. Retention time for RST and EZE were 2.07 and 3.02mins respectively. The degradation products formed during forced degradation studies were well separated from the analyte peak demonstrates that the developed method was specific and stability-indicating.
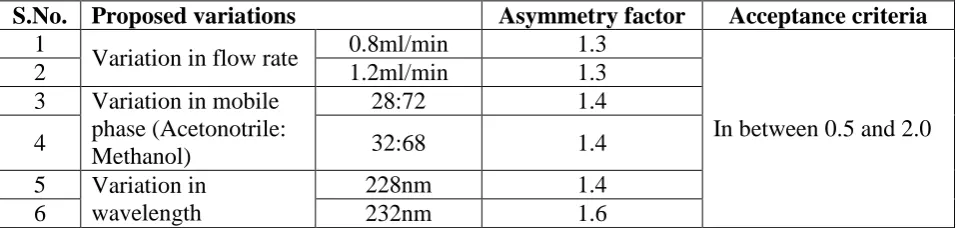
Robustness: To evaluate the robustness of the method the chromatographic conditions were
[image:10.595.48.548.345.452.2]deliberately varied and degree of reproducibility was evaluated. Robustness was carried out on standard drug solution and formulation. Robustness of the proposed method was assessed with respect to change in mobile phase composition (30:70 ± 2), change in flow rate (1ml/min ± 0.2ml/min) and change in wavelength (230nm ± 2nm). The results are shown in Table 4 and 5.
RESULTS AND DISCUSSION
Table. 4: Robustness of Rosuvastatin.
S. No. Proposed variations Asymmetry factor Acceptance criteria
1
Variation in flow rate 0.8ml/min 1.1
In between 0.5 and 2.0
2 1.2ml/min 1.1
3 Variation in mobile phase (Acetonotrile: Methanol)
28:72
4 32:68 1.3
5
Variation in wavelength 228nm 0.9
6 232nm 1.2
Table. 5: Robustness of Ezetimibe.
S.No. Proposed variations Asymmetry factor Acceptance criteria
1
Variation in flow rate 0.8ml/min 1.3
In between 0.5 and 2.0
2 1.2ml/min 1.3
3 Variation in mobile phase (Acetonotrile: Methanol)
28:72 1.4
4 32:68 1.4
5 Variation in wavelength
228nm 1.4
6 232nm 1.6
[image:10.595.59.543.483.597.2]2.0mins and for EZE at 3.0mins. The separation of RST and EZE was good with good peak shape and resolution (Table 6).
The system suitability parameters were set and were checked before starting the analysis. System suitability was performed by three replicate injections of standard solutions of RST and EZE (Table 7). The linearity was found to be 2-25µg/ml for both RST and EZE with the trend line equation of y = 29944x + 34136 (Rosuvastatin) and y = 52859x + 54123 (Ezetimibe). The regression coefficient was 0.999 for both the drugs. The method was found to be accurate as per the accuracy studies. RST was found to be 99%-102% and EZE was found to be 98%-102% which are within the acceptable range of 98%-102%. Method was found to be precise based on the %RSD values of RST and EZE. The %RSD was calculated for peak areas and was found to be within the limits (NMT 2%). The assay performed on formulation shown the % content of 99.3 and 99.6 for RST and EZE respectively (Table 8 ).
Forced degradation studies were performed on both RST and EZE. Both the drugs were subjected to stress conditions which include acid hydrolysis (0.1N HCl), base hydrolysis (0.1N NaOH), thermal (50ºC), oxidation (3% H2O2) and photolytic (exposure to light). The
[image:11.595.107.482.500.624.2]monitoring period for acid, base and oxidation was 24hrs and for thermal (50ºC in hot air oven) and photolytic (longer wavelength in UV cabinet) it was 6hrs. Effective degradation was observed with oxidation degradation for both the drugs (Table 9 and 10).
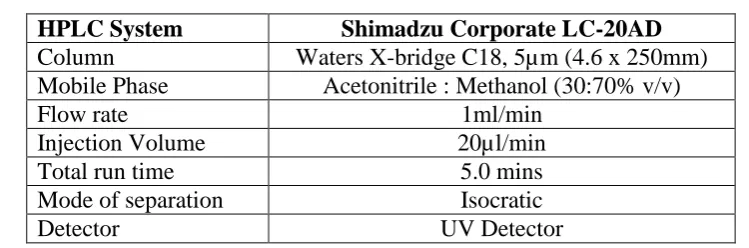
Table. 6: Chromatographic Conditions.
HPLC System Shimadzu Corporate LC-20AD
Column Waters X-bridge C18, 5µm (4.6 x 250mm) Mobile Phase Acetonitrile : Methanol (30:70% v/v) Flow rate 1ml/min
Injection Volume 20µl/min Total run time 5.0 mins Mode of separation Isocratic Detector UV Detector
Table. 7: System Suitability Test Parameters.
S. No Parameters Rosuvastatin Ezetimibe
Table. 8: Assay of formulation.
Drug Amount
labelled (mg)
Peak area Amount found
(µg/ml)
% Assay
Rosuvastatin 10.0 331570 9.93 99.3
Ezetimibe 10.0 580702 9.96 99.6
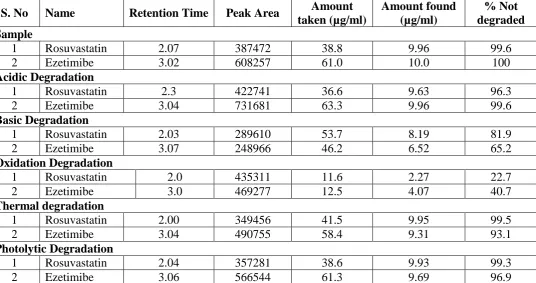
Table 9: Forced degradation studies of Rosuvastatin and Ezetimibe API.
S. No Name Retention Time Peak Area Amount
taken (µg/ml) Amount found (µg/ml) % Not degraded Sample
1 Rosuvastatin 2.07 387472 38.8 9.96 99.6 2 Ezetimibe 3.02 608257 61.0 10.0 100
Acidic Degradation
1 Rosuvastatin 2.3 422741 36.6 9.63 96.3 2 Ezetimibe 3.04 731681 63.3 9.96 99.6
Basic Degradation
1 Rosuvastatin 2.03 289610 53.7 8.19 81.9 2 Ezetimibe 3.07 248966 46.2 6.52 65.2
Oxidation Degradation
1 Rosuvastatin 2.0 435311 11.6 2.27 22.7 2 Ezetimibe 3.0 469277 12.5 4.07 40.7
Thermal degradation
1 Rosuvastatin 2.00 349456 41.5 9.95 99.5 2 Ezetimibe 3.04 490755 58.4 9.31 93.1
Photolytic Degradation
1 Rosuvastatin 2.04 357281 38.6 9.93 99.3 2 Ezetimibe 3.06 566544 61.3 9.69 96.9
Table. 10: Comparative Study on Degradation.
S. No Stress conditions % Degradation
Rosuvastatin Ezetimibe
1 Acid hydrolysis 3.3 0.4 2 Base hydrolysis 17.7 34.8 3 Oxidation 76.9 59.3
4 Thermal 0.1 6.9
5 Photolytic (UV light) 0.3 3.1
CONCLUSION
A simple, accurate stability indicating RP-HPLC analytical method has been developed and validated in tablet dosage form of RST and EZE. The results of degradation studies reveal that the drug has mostly degraded during oxidation degradation process.
ACKNOWLEDGEMENT
[image:12.595.34.571.186.469.2]REFERENCES
1. https://www.drugbank.ca/drugs/DB01098.
2. https://pubchem.ncbi.nlm.nih.gov/compound/Rosuvastatin. 3. https://www.drugbank.ca/drugs/DB00973.
4. https://pubchem.ncbi.nlm.nih.gov/compound/Ezetimibe.
5. Varghese, Sushell John, Ravi, Thengungal Kochupappy; Determination of Rosuvastatin and Ezetimibe in a Combined Tablet Dosage form using High-Performance Column Liquid Chromatography and High-Performance Thin-Layer Chromatography; Journal of AOAC International, 2010; 93(6): 1222-1227.
6. Vadthya Rajashekar, K.Rajeswar Dutt, N.Ramathilagam; RP-HPLC method development and validation for the simultaneous estimation of rosuvastatin and ezetimibe in tablet dosage form; International Journal of Pharmacy and Analytical Research, 2014; 3(1): 13-21.
7. Gajjar Anuradha K. Shah Vishal D.,Simultaneous Uvspectrophotometric Estimation Of Rosuvastatin And Ezetimibe In Their Combined Dosage Forms; International Journal of Pharmacy and Pharmaceutical Sciences, 2010; 1(2): 131-138.
8. M Pokala et al, Development and validation of RP-HPLC method for the simultaneous estimation of amlodipine and metoprolol in bulk and pharmaceutical dosage form, Indo American Journal of Pharmaceutical Research, 2015; 5(10): 3254-3260.
9. M Bhavani et al, Analytical Method Mevelopment and Validation of Doxofylline and Terbutaline Sulfate by RP-HPLC Method; International Journal of Pharma Research and Health Sciences, 2014; 2(6): 502-506.
10.S Gayathri et al, Method development and validation of RP-HPLC method for simultaneous estimation of Olmesartan medoxomil and Hydrochlorothiazide in bulk and pharmaceutical dosage form; International Journal of Pharma Research and Health Sciences, 2014; 2(6): 457-462.