Machine-learning based Hybrid Method for Surface
Defect Detection and Categorization in PU Foam
Shailendra Singh Kathait
Co-founder & Head of Analytics Valiance Solutions Pvt. Ltd.
Noida, Uttar Pradesh
Sakshi Mathur
Indian Institute of Technology, Roorkee Roorkee, Uttarakhand
ABSTRACT
Foam making is an important industry, their main applications be-ing foam mattresses. Hence, their production in the industries is subject to very strict safety checks to ensure their quality. There are many types of defects that can arise during their manufactur-ing process, like holes, cuts, a misconfiguration in the material and many more. These defects are reviewed manually which leads to an inadequate accuracy and many defects are not detected. This paper proposes a novel approach that identifies defects in the foam mate-rial and on the surface using a hybrid method. Both supervised and unsupervised approaches are used to categorize materials based on normal or defective, including the type of defect. Then the reliable model is chosen according to the precision rates of both the mod-els.
Keywords
Polymerization, Data Augmentation, Computer vision, OpenCV, Image Processing, Machine learning, Deep Learning, Convolu-tional Neural Networks
1. INTRODUCTION
Polyurethane foam is a chemically complex polymeric product hav-ing a broad range of load-bearhav-ing capability and resiliency. It is used as cushioning material for furniture, bedding, carpeting, pack-aging and automotive applications. It is best known for supporting our body for a large part of the day, in mattresses, upholstered fur-niture, and car seats. What is sometimes less known is that we enjoy the benefits of hundreds of polyurethane foam articles without even noticing. [2]
Its applications are virtually endless, ranging from small but essen-tial items such as sponges in the kitchen, medical dressings to large filters and soundproofing systems that keep our environment clean and quiet. Polyurethane is a leading member of the wide-ranging and highly diverse family of polymers or plastics. Polyurethane can be solid or can have an open cellular structure, in which case it is called foam and foams can be flexible or rigid.
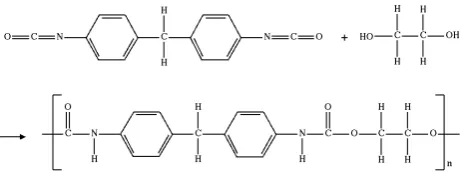
[image:1.595.320.551.262.350.2]A simple explanation, manufacturers make polyurethane foam by reacting polyols and diisocyanates, both products derived from crude oil (Figure 1). A series of additives are necessary to produce high-quality PU foam products, depending on the application the foam will be used for.
Fig. 1: Polyurethane synthesis, wherein the urethane groups NH(C=O)O link the molecular units. [16]
There are several defects that may appear in the manufacturing of polyfoams in the industries, like improper cross-linking in the poly-mer, surface defects during cutting or rolling, etc. This calls for a lot of intensive labor work to manually check each and every foam piece after it is made, which of course causes many defects to pass on without being noticed by the worker on duty. This costs losses to the industry as a lot of foam is then wasted because of such defects as this faulty foam will make a low-quality mattress and this is a complete waste. This research is an attempt to reduce the amount of manual work done by the workers and to prevent foam making industries from incurring losses. [14]
2. PROPOSED METHODOLOGY
This research work has proposed two new system for efficient de-fect detection using computer vision and image processing tech-niques, which are coupled with the pattern discovery algorithms such as predicting the color of the foam material. The new detec-tion system is developed using two different novel approaches:
(1) Computer vision and Image Analysis (2) Supervised training and categorization
2.1 Data Acquisition and processing
This is the first and foremost aspect of an algorithm. For testing the code in laboratory, different images of foam samples were taken at different angles and light conditions to train the model correctly. Foam samples were illuminated from the backside using a source of visible light.
2.2 Data Cleaning
Before an image could be used to predict something, it has to be cleaned. Data cleaning is a very important pre-processing step in machine learning. Original data will have many discrepancies that need to be removed, like having outliers, having null data etc. Data discrepancy varies for different types of data an thus there is no defined rule how to clean data and prepare it for machine learning models.[5]
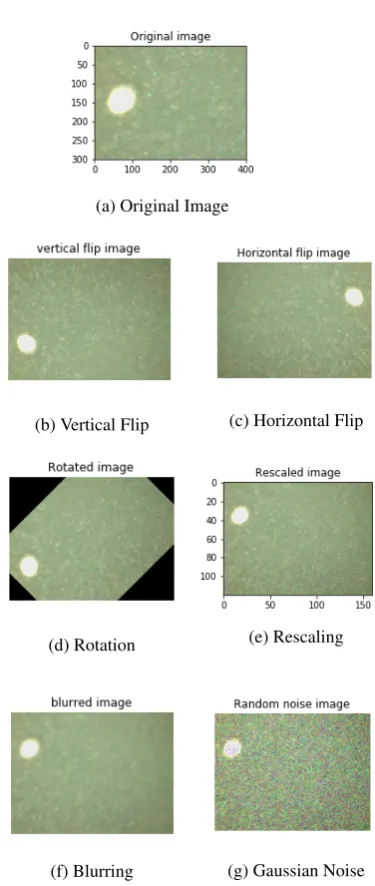
[image:2.595.339.527.192.636.2]The raw image would give inappropriate and undesired results be-cause of the presence of noise and other factors. To reduce the noise in the captured images, high-resolution cameras were used. The im-ages taken were in RGB imim-ages and there was no need of colors to determine the category of foam sample, so, they were converted into grayscale and normalized between 0 to 255 to remove outliers if any (Figure 2). The images were manually labeled according to its category to train the classifier.
Fig. 2: Data cleaning example
2.3 Data Augmentation
Since the amount of data needed to train any model and to get good accuracy is very large, data augmentation was done on the sample data from the foam making industry. It is a way to reduce over-fitting in the model and to increase the accuracy.
Data augmentation can be applied to any form of data but may be especially useful for customer data, sales patterns, product sales, where additional information can help provide more depth in-sight. In terms of images, it may mean that increasing the number of images in the dataset. In terms of traditional row/column format data, it means increasing the number of rows or objects.[15]
Some of the augmentation techniques that were used in this re-search are: (Figure 3)
—Flip: Flipping images horizontally and vertically. —Rotation: Rotating the image by finer angles. —Scale: The image can be scaled outward or inward.
—Blur: Blurring the image slightly will enhance the learning capa-bility.
—Gaussian Noise: Adding just the right amount of noise can en-hance the learning capability.
(a) Original Image
(b) Vertical Flip (c) Horizontal Flip
(d) Rotation (e) Rescaling
(f) Blurring (g) Gaussian Noise
[image:2.595.64.280.434.523.2]3. COMPUTER VISION AND IMAGE ANALYSIS
Computer vision is a field of computer science that works on en-abling computers to see, identify and process images in the same way that human vision does, and then provide the appropriate out-put. It is like imparting human intelligence and instincts to a com-puter. The human eye is a complex structure and it goes through a more complex phenomenon of understanding the environment. In a similar fashion, making machines see things and make them capa-ble enough to figure out what they are seeing and further categorize it, is still a pretty tough job.[12]
The goal of Computer Vision is to emulate human vision using dig-ital images through three main processing components, executed one after the other:
(1) Image acquisition: Image acquisition is the process of translat-ing the analog world around us into binary data composed of zeros and ones, interpreted as digital images.
(2) Image processing: The second component of Computer Vision is the low-level processing of images. Algorithms are applied to the binary data acquired in the first step to infer low-level information on parts of the image. This type of information is characterized by image edges, point features or segments, for example. They are all the basic geometric elements that build objects in images.
(3) Image analysis and understanding: The last step of the Com-puter Vision pipeline if the actual analysis of the data, which will allow the decision making. High-level algorithms are ap-plied, using both the image data and the low-level information computed in previous steps.
As our human visual understanding of the world is reflected in our ability to make decisions through what we see, providing such a vi-sual understanding of computers would allow them the same power.
3.1 Digital Image Processing
Image processing is a method to perform some operations on an image, in order to get an enhanced image or to extract some useful information from it. It is a type of signal processing in which input is an image and output may be image or characteristics/features associated with that image. Nowadays, image processing is among rapidly growing technologies. It forms core research area within engineering and computer science disciplines too.[6]
Image processing basically includes the following three steps:
—Importing the image via image acquisition tools;
—Analyzing and manipulating the image;
—Output in which result can be altered image or report that is based on image analysis.
The three general phases that all types of data have to undergo while using digital technique are pre-processing, enhancement, and dis-play, information extraction.
3.2 OpenCv
OpenCV (Open Source Computer Vision Library) is an open source computer vision and machine learning software library. OpenCV was built to provide a common infrastructure for computer vision applications and to accelerate the use of machine perception in the commercial products. The library has more than 2500 optimized algorithms, which includes a comprehensive set of both classic and state-of-the-art computer vision and machine learning algorithms.
These algorithms can be used to detect and recognize faces, identify objects, classify human actions in videos, track camera movements, track moving objects, extract 3D models of objects, produce 3D point clouds from stereo cameras, stitch images together to produce a high resolution image of an entire scene, find similar images from an image database, remove red eyes from images taken using flash, follow eye movements, recognize scenery and establish markers to overlay it with augmented reality, etc.[9]
3.3 Approach
The surface chemistry of polyurethane foam leads to it passing a few amounts of visible light illuminated on it through a light source. Also, if there is a cut or a density gradient in the surface of the foam material, this will cause a difference in light received from the foam sample. A defect area will naturally be more illuminated as com-pared to rest of the non-defective areas of the sample. We used this property of polyfoams to build a classifier which will tell whether the foam sample is defective or normal. This was an unsupervised approach of detection using computer vision techniques and thus, the defect could not be categorized into its different types. The algorithm took an image of foam and did pre-process on it like removing noise and converting it to grayscale from RGB color code. Then Gaussian blur filter was applied on the grayed image to smoothen out the edges and remove noise from the image. A series of morphological dilation and erosion were then applied on the image.[1] Dilation adds pixels to the boundaries of objects in an image, while erosion removes pixels on object boundaries. The number of pixels added or removed from the objects in an image depends on the size and shape of the structuring element used to process the image. These processes will lead to a clear distinction that a computer can visualize because of thresholding. The com-puter will then count the number of defects in the image using masking. If it is greater than 0, it means the given sample has a de-fect in it which must be checked. To detect the location of the fault, object localization technique was used. This will create a bounding circle at the given coordinates surrounding the defect which can be viewed on the screen to calculate the accuracy of our algorithm.
3.4 Evaluation and Validation
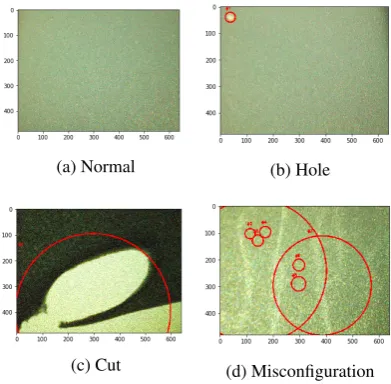
The algorithm was tested for a testing data comprising 40 illumi-nated samples’ images. The output was similar to figure 4. To evaluate the model, a confusion matrix was made. Here, faulty is considered as 1 and normal as 0. The matrix was something like this:
1 0
1 20 8
0 2 10
Precision= T P T P+F P [7]
Precision= 30
30+5 = 0.857
Recall= T P T P+F N
Recall= 3
30+1 = 0.967
F Score= 2∗ Recall∗P recision Recall+P recision
F Score= 2∗ 0.857∗0.967
(a) Normal (b) Hole
[image:4.595.74.270.67.259.2](c) Cut (d) Misconfiguration
Fig. 4: Types of different test predictions
4. SUPERVISED TRAINING AND
CATEGORIZATION
Machine learning is a core sub-area of artificial intelligence; it en-ables computers to get into a mode of self-learning without being explicitly programmed. When exposed to new data, these computer programs are enabled to learn, grow, change, and develop by them-selves. It allows computers to find insightful information without being programmed where to look for a particular piece of informa-tion; instead, it does this by using algorithms that iteratively learn from data. With the constant evolution of the field, there has been a subsequent rise in the uses, demands, and importance of machine learning. Big data has become quite a buzzword in the last few years; thats in part due to increased sophistication of machine learn-ing, which helps analyze those big chunks of big data. Machine learning has also changed the way data extraction, and interpreta-tion is done by involving automatic sets of generic methods that have replaced traditional statistical techniques.[11]
The process of learning begins with observations or data, such as examples, direct experience, or instruction, in order to look for pat-terns in data and make better decisions in the future based on the examples that we provide. The primary aim is to allow the comput-ers to learn automatically without human intervention or assistance and adjust actions accordingly.
Machine learning algorithms are often categorized as supervised or unsupervised.[17]
(1) Supervised machine learning algorithms can apply what has been learned in the past to new data using labeled examples to predict future events. Starting from the analysis of a known training dataset, the learning algorithm produces an inferred function to make predictions about the output values. The sys-tem is able to provide targets for any new input after sufficient training. The learning algorithm can also compare its output with the correct, intended output and find errors in order to modify the model accordingly.
(2) In contrast, unsupervised machine learning algorithms are used when the information used to train is neither classified nor la-beled. Unsupervised learning studies how systems can infer a
function to describe a hidden structure from unlabeled data. The system doesnt figure out the right output, but it explores the data and can draw inferences from datasets to describe hid-den structures from unlabeled data.
4.1 Deep Learning
Deep Learning, a prominent topic in Artificial Intelligence domain, has been in the spotlight for quite some time now. While traditional machine learning algorithms are linear, deep learning algorithms are stacked in a hierarchy of increasing complexity and abstraction. Each algorithm in the hierarchy applies a nonlinear transformation on its input and uses what it learns to create a statistical model as output. Iterations continue until the output has reached an accept-able level of accuracy. The number of processing layers through which data must pass is what inspired the label deep.[10]
4.2 Convolutional Neural Networks
A convolutional neural network (CNN, or ConvNet) is a class of deep, feed-forward artificial neural networks, most commonly ap-plied to analyzing visual imagery. CNN, like neural networks, are made up of neurons with learnable weights and biases. Each neu-ron receives several inputs, takes a weighted sum over them, pass it through an activation function and responds with an output. The whole network has a loss function. ConvNet architectures make the explicit assumption that the inputs are images.[13]
4.3 Approach
In order to make the foam defect detection system, first a dataset was made by collecting images from the foam manufacturing fac-tory. The experiments were focused on three different surface de-fects:
1) Holes 2) Cuts
3) Misconfiguration
To construct the dataset, 3000 images were analyzed using foam samples and applying data augmentation on those images to mul-tiply them using effects like rotation, Gaussian blurring, adding or removing noise etc. In particular, the dataset used 1500 normal im-ages, and 500 of each defect to create a balanced training data. Then the dataset was split into training and validation data in the ratio of 4:1. A testing dataset was made of 40 images to evaluate the per-formance of the model in the end. Four categories were made to classify the sample image as ”normal”, hole, cuts or misconfigu-ration. Then a sequential model was trained on a fully connected neural network [18]. The output was categorized as [0,1,2,3] indi-cating the different categories mentioned above respectively. The model consisted of 1 input layer and 4 conv layers of filter size 32,32,32,64 and 64 respectively. The input was kept to be of size (100,100,1). ReLU (Rectified Linear Unit) activation function was used for these layers, which may be defined as:
f(x) =x+= max(0, x)[3]
val-ues, where each entry is in the range (0, 1], and all the entries add up to 1. The function is given by:
σ:RK→ {σ∈RK|σ i>0,
PK
i=1σi= 1[4]
σ(z)j= e
zj PK
k=1ezk
f orj= 1, , K.
The model was compiled using an optimizer and was trained for a batch size of 86 images with total 50,000 epochs. This model was trained on a 64GB RAM computer for faster training and then the architecture and weights were saved to be loaded on any other device and testing.
4.4 Evaluation and Validation
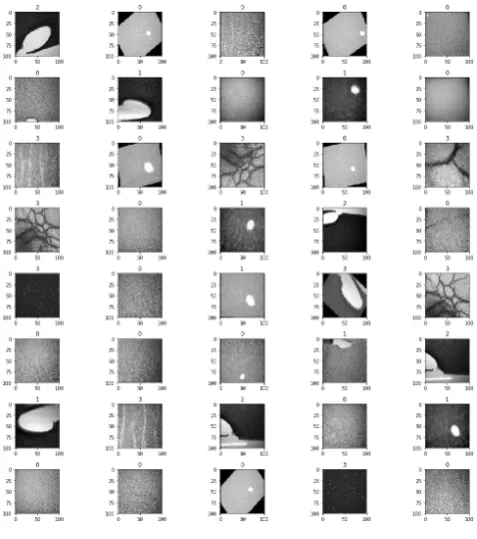
[image:5.595.54.293.307.577.2]The model gave a training accuracy of 95.18 % while a validation accuracy of 97.70 %. It was tested on the testing data which com-prised 40 random images. The results were similar to figure 5. Here 0 stands for normal images, 1 for holes, 2 for cuts and 3 for mis-configuration.
Fig. 5: Test predictions
To evaluate the model, again a confusion matrix was made. Here, faulty is considered as 1 and normal as 0. The matrix was some-thing like this:
1 0
1 20 8
0 2 10
Precision= T P T P+F P [7]
Precision= 20
20+2 = 0.909
Recall= T P T P+F N
Recall= 20
20+8 = 0.714
F Score= 2∗ Recall∗P recision Recall+P recision
F Score= 2∗ 0.714∗0.909 0.714+0.909 = 0.78
5. RESULTS
The F Score of both the approaches was quite promising and gave hope that these can be used as an industrial level to reduce manual work. The computer vision approach is an unsupervised approach and does not need a starting database. Thus it could be deployed first on the raspberry pi3 board. All the images were uploaded with their tags of being normal or defected on the Amazon S3 bucket. After running these for a couple of months, enough data was col-lected to train the neural networks classifier. The architecture and weights of the CNN model could be loaded on the raspberry pi3 board to run a real-time supervised detector.
6. CONCLUSION AND FUTURE WORK
Polyurethane foam, or foam in general, is an important sector of the industry. The uses of foams made by these industries are endless and thus there is a need to ensure the quality of foams produced. Till now these industries use manual work to detect faults and defects included in the foam product which leads to low accuracy, higher labor work and thus overall loss to the industry.
In this paper, two novel approaches are proposed based on com-puter vision and machine learning in order to detect and categorize surface defects on polyurethane foam during their manufacturing in the industries. This approach starts by retrieving sample images from the industry unit, then applying the two algorithms on these images, and finally to deploy the code to make it a real-time detec-tion system which can be installed in the industries.
The future work in this approach can be to increase the accuracy of detection, include more classes of faults and detect very minor defects that may be even hard to visualize manually also. One thing where the algorithm faced issue was detection in dim lights, which we are finding a solution for.
7. REFERENCES
[1] Morphological Processing, chapter 8, pages 197–234. Wiley-Blackwell, 2011.
[2] John Akindoyo, Md Dalour Hossen Beg, Suriati Ghaz-ali, Muhammad Islam, Nitthiyah Jeyaratnam, and Yuvaraj Ar. Polyurethane types, synthesis and applications-a review. 6:114453–114482, 11 2016.
[3] Raman Arora, Amitabh Basu, Poorya Mianjy, and Anirbit Mukherjee. Understanding deep neural networks with rec-tified linear units. InInternational Conference on Learning Representations, 2018.
[5] Xu Chu, Ihab F. Ilyas, Sanjay Krishnan, and Jiannan Wang. Data cleaning: Overview and emerging challenges. In Pro-ceedings of the 2016 International Conference on Manage-ment of Data, SIGMOD ’16, pages 2201–2206, New York, NY, USA, 2016. ACM.
[6] Rafael C. Gonzalez and Richard E. Woods.Digital image pro-cessing. Prentice Hall, Upper Saddle River, N.J., 2008. [7] Cyril Goutte and Eric Gaussier. A probabilistic interpretation
of precision, recall and f-score, with implication for evalu-ation. InProceedings of the 27th European Conference on Advances in Information Retrieval Research, ECIR’05, pages 345–359, Berlin, Heidelberg, 2005. Springer-Verlag. [8] Gareth Halfacree and Eben Upton.Raspberry Pi User Guide.
Wiley Publishing, 1st edition, 2012.
[9] Itseez.The OpenCV Reference Manual, 2.4.9.0 edition, April 2014.
[10] Alex Krizhevsky, Ilya Sutskever, and Geoffrey E Hinton. Ima-genet classification with deep convolutional neural networks. In F. Pereira, C. J. C. Burges, L. Bottou, and K. Q. Wein-berger, editors,Advances in Neural Information Processing Systems 25, pages 1097–1105. Curran Associates, Inc., 2012. [11] Thomas M. Mitchell.Machine Learning. McGraw-Hill, Inc.,
New York, NY, USA, 1 edition, 1997.
[12] Sebastian Nowozin and Christoph H. Lampert. Structured learning and prediction in computer vision.Found. Trends. Comput. Graph. Vis., 6(3–4):185–365, March 2011. [13] Keiron O’Shea and Ryan Nash. An introduction to
convolu-tional neural networks. 11 2015.
[14] Iker Pastor-Lopez, Igor Santos, Aitor Santamaria-Ibirika, Mikel Salazar, Jorge de La-PeA-Sordo, and Pablo Bringas. Machine-learning-based surface defect detection and cate-gorisation in high-precision foundry, 07 2012.
[15] Luis Perez and Jason Wang. The effectiveness of data aug-mentation in image classification using deep learning.CoRR, abs/1712.04621, 2017.
[16] Laura Rducu, Cristina Cozma, A.E.B. Stroescu, Adelaida Avino, M.D. Tanasescu, D.G. Balan, and Cristian Jecan. Our experience in chronic wounds care with polyurethane foam. 69:585–586, 03 2018.
[17] R. Sathya. Comparison of supervised and unsupervised learn-ing algorithms for pattern classification.