!
"
#"#
$ % %#
&
'
((( )
Prediction of Middle Finger Features from its Width: A Novel Approach
Manimala S.*
Department of CS & E SJCE, Mysore-570006, India
C.N. Ravi Kumar
Department of CS & E SJCE, Mysore-570006, India
Abstract:This paper focus on the prediction of geometric features of middle finger from the known width of the finger. Geometric features of both the hands from 100 people of different age group were extracted from the silhouettes. The proposed method can be used to predict middle finger length, position of knuckles and also finger width at the second knuckle using taalamana system and shilpa shastra. The estimation accuracy of more than 91% is achieved for all the estimated features of the middle finger.
Keywords:golden mean, taalamana system, iconography, human hand, feature estimation.
I. INTRODUCTION
The human hand is a masterpiece of mechanical complexity. The anatomy of the hand is complex, intricate, and fascinating. Its integrity is absolutely essential for everyday functional living. Hands may be affected by many disorders, most commonly traumatic injury. Construction of the middle finger when only fractional part of the image is available is a challenging task. In this view middle finger features are estimated using taalamana system and golden mean.
A. Taalamana system
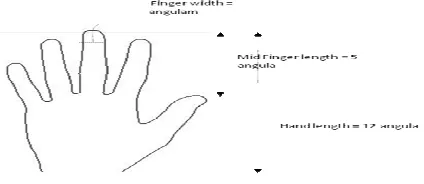
Iconography is the branch of art history which studies the identification, description, and the interpretation of the content of images. The word iconography literally means "image writing". The idea of constructing human hand is derived from Silpa Shastra. It has developed its own norms of measures and proportions. It is a complex system of iconography that defines rigid definitions [1,21,22]. The shilpa shastra normally employ divisions on a scale of one (eka tala) to ten (dasa tala). Each tala is subdivided into 12 angulas. It is called Taalamana paddathi or Taalamana system, the system of measurements by Tala, the palm of hand i.e. from the tip of the middle finger to the wrist as shown in figure 1.
B. Golden ratio
Two quantities are in the golden ratio if the ratio of the sum of the quantities to the larger quantity is equal to the ratio of the larger quantity to the smaller one. The golden section is a line segment divided according to the golden ratio. If a and b are the lengths of the larger and smaller line segments respectively, then golden ratio is represented as shown in equation 1.
In case of accidents if only partial knowledge of the finger is available, then the proposed method can be used to obtain complete knowledge of the damaged part. In medical science when it is necessary to replace any part of the
human body like fingers, it can be constructed using the proposed method for perfection in the plastic surgery.
The paper is organized into five sections. Introduction is given in first section. In the second section literature is reviewed.
Mathematical model is enumerated in section 3. In section 4 the proposed method is discussed and the simulation results are presented in section5.
Figure 1: Computation of Middle finger length
II. LITERATURE SURVEY
Geometric measurements of the human hand have been used for identity authentication in a number of commercial systems. Anil K.Jain and others have worked extensively on hand geometry specifically for identification and verification systems [6,7,8]. There is not much open literature addressing the research issues underlying hand geometry-based identity authentication; much of the literature is in the form of patents [2, 3, 4]. Hand geometry recognition systems may provide three kinds of services like verification, classification and identification [12]. A novel contact-free biometric identification system based on geometrical features of the human hand is developed by Aythami Morales and others [11]. A component-based hand verification system using palm-finger segmentation and fusion was developed by Gholamreza and others. The geometry of each component of the hand is represented using high order Zernike moments which is computed using an efficient methodology [15].
Windy and others have used geometric measurements to study the sexual orientation. The ratio of the length of the
( ) . . . (1 )
a b a
P h i
a b
+
© 2010, IJARCS All Rights Reserved 43
second digit (2D) to the length of the fourth digit (4D) is greater in women than in men. This ratio is stable from 2 years of age in humans [9,10]. Gender classification from hand images in computer vision is attempted by Gholamreza and others [16].
Issac Cohen and others have worked on 3D hand construction from silhouettes of 2D hands [13]. Digital and metacarpal formulae are morphological variables which may also have functional significance in the understanding of how certain hand forms may be ill-fitted for certain tasks [14].
T.F.Cootes and others have worked on active shape models [17,18] which laid foundations for statistical shape analysis using Procrustes analysis, tangent space projection and Principal Component Analysis[19]. Geometric hand measurements are also used in hand gesture classification using a view-based approach for representation and Artifi cial Neural Network for classification [20].
III. MATHEMATICAL MODEL
Prediction of finger length, position of knuckles and finger width at the second knuckle are computed using taala mana system and golden ratio. The finger length is compu ted as five times the finger width (FW1). Finger joints or knuckles are predicted using golden ratio rule. The golden mean or ratio can be computed mathematically as shown in equation 2 and 3. width at the second knuckle FW2 is computed as shown in equation 5.
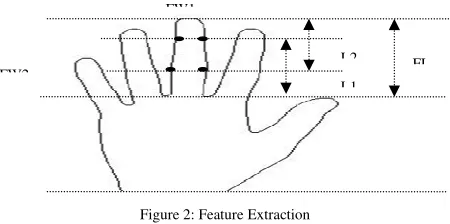
200 silhouette of both the hands of 100 users are taken on sheets of paper and features are extracted Geometric features of both the hands from 100 different people of different age group collected. At first the silhouette of hand is taken on the paper and the positions of the knuckles are marked. 24 features are extracted as shown in figure 2. For each finger five features namely finger width 1 (FW1), finger width 2 (FW2), Finger Length (FL), Position of first knuckle from bottom(L1) and position of second knuckle from finger tip (L2) are extracted. Similarly for the four fingers these five features are collected and four features for the thumb totally to 24 feature set.
From first width of the middle finger (FW1), the values of FL, L1, L2 and FW2 are estimated. The actual and estimated values of a subset of samples are tabulated in table 1 and 2 in page 5. bottom of the finger (L1) and distance of the second knuckle from the tip of the finger (L2). Total of 24 features are collected. In the current study only middle finger length is computed using our approach.
Figure 2: Feature Extraction
In statistics, the mean square error or MSE of an estimator is one of ways to quantify the difference between an estimator and the true value of the quantity being estimated. MSE is a risk function, corresponding to the expected value of the squared error loss or quadratic loss. MSE measures the average of the square of the "error." The error is the amount by which the estimator differs from the quantity to be estimated. The difference occurs because of randomness or because the estimator doesn't account for information that could produce a more accurate estimate. The square root of MSE yields the root mean squared error or RMSE. outcomes. The mean absolute error (MAE) is an average of the absolute errors computed as in equation 7, where fi is the
prediction and yi the true value.
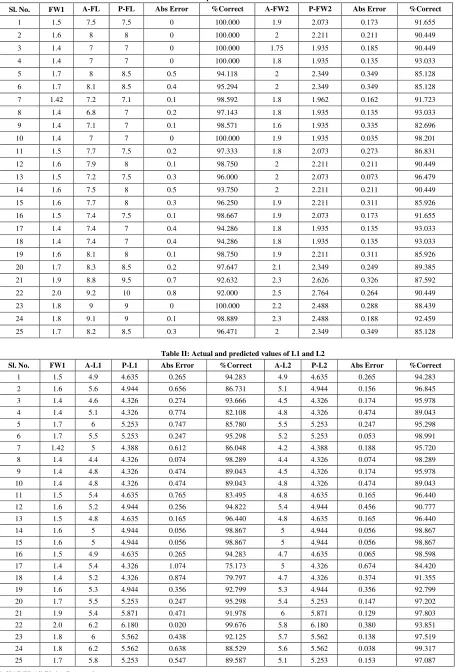
Table I: Actual and predicted values of FL and FW2
Sl. No. FW1 A-FL P-FL Abs Error %Correct A-FW2 P-FW2 Abs Error %Correct
1 1.5 7.5 7.5 0 100.000 1.9 2.073 0.173 91.655
2 1.6 8 8 0 100.000 2 2.211 0.211 90.449
3 1.4 7 7 0 100.000 1.75 1.935 0.185 90.449
4 1.4 7 7 0 100.000 1.8 1.935 0.135 93.033
5 1.7 8 8.5 0.5 94.118 2 2.349 0.349 85.128
6 1.7 8.1 8.5 0.4 95.294 2 2.349 0.349 85.128
7 1.42 7.2 7.1 0.1 98.592 1.8 1.962 0.162 91.723
8 1.4 6.8 7 0.2 97.143 1.8 1.935 0.135 93.033
9 1.4 7.1 7 0.1 98.571 1.6 1.935 0.335 82.696
10 1.4 7 7 0 100.000 1.9 1.935 0.035 98.201
11 1.5 7.7 7.5 0.2 97.333 1.8 2.073 0.273 86.831
12 1.6 7.9 8 0.1 98.750 2 2.211 0.211 90.449
13 1.5 7.2 7.5 0.3 96.000 2 2.073 0.073 96.479
14 1.6 7.5 8 0.5 93.750 2 2.211 0.211 90.449
15 1.6 7.7 8 0.3 96.250 1.9 2.211 0.311 85.926
16 1.5 7.4 7.5 0.1 98.667 1.9 2.073 0.173 91.655
17 1.4 7.4 7 0.4 94.286 1.8 1.935 0.135 93.033
18 1.4 7.4 7 0.4 94.286 1.8 1.935 0.135 93.033
19 1.6 8.1 8 0.1 98.750 1.9 2.211 0.311 85.926
20 1.7 8.3 8.5 0.2 97.647 2.1 2.349 0.249 89.385
21 1.9 8.8 9.5 0.7 92.632 2.3 2.626 0.326 87.592
22 2.0 9.2 10 0.8 92.000 2.5 2.764 0.264 90.449
23 1.8 9 9 0 100.000 2.2 2.488 0.288 88.439
24 1.8 9.1 9 0.1 98.889 2.3 2.488 0.188 92.459
25 1.7 8.2 8.5 0.3 96.471 2 2.349 0.349 85.128
Table II: Actual and predicted values of L1 and L2
Sl. No. FW1 A-L1 P-L1 Abs Error %Correct A-L2 P-L2 Abs Error %Correct
1 1.5 4.9 4.635 0.265 94.283 4.9 4.635 0.265 94.283
2 1.6 5.6 4.944 0.656 86.731 5.1 4.944 0.156 96.845
3 1.4 4.6 4.326 0.274 93.666 4.5 4.326 0.174 95.978
4 1.4 5.1 4.326 0.774 82.108 4.8 4.326 0.474 89.043
5 1.7 6 5.253 0.747 85.780 5.5 5.253 0.247 95.298
6 1.7 5.5 5.253 0.247 95.298 5.2 5.253 0.053 98.991
7 1.42 5 4.388 0.612 86.048 4.2 4.388 0.188 95.720
8 1.4 4.4 4.326 0.074 98.289 4.4 4.326 0.074 98.289
9 1.4 4.8 4.326 0.474 89.043 4.5 4.326 0.174 95.978
10 1.4 4.8 4.326 0.474 89.043 4.8 4.326 0.474 89.043
11 1.5 5.4 4.635 0.765 83.495 4.8 4.635 0.165 96.440
12 1.6 5.2 4.944 0.256 94.822 5.4 4.944 0.456 90.777
13 1.5 4.8 4.635 0.165 96.440 4.8 4.635 0.165 96.440
14 1.6 5 4.944 0.056 98.867 5 4.944 0.056 98.867
15 1.6 5 4.944 0.056 98.867 5 4.944 0.056 98.867
16 1.5 4.9 4.635 0.265 94.283 4.7 4.635 0.065 98.598
17 1.4 5.4 4.326 1.074 75.173 5 4.326 0.674 84.420
18 1.4 5.2 4.326 0.874 79.797 4.7 4.326 0.374 91.355
19 1.6 5.3 4.944 0.356 92.799 5.3 4.944 0.356 92.799
20 1.7 5.5 5.253 0.247 95.298 5.4 5.253 0.147 97.202
21 1.9 5.4 5.871 0.471 91.978 6 5.871 0.129 97.803
22 2.0 6.2 6.180 0.020 99.676 5.8 6.180 0.380 93.851
23 1.8 6 5.562 0.438 92.125 5.7 5.562 0.138 97.519
24 1.8 6.2 5.562 0.638 88.529 5.6 5.562 0.038 99.317
© 2010, IJARCS All Rights Reserved 45
Table III: Statistical Analysis
Min Max Mean Std Deviation
FW1 1.3 2.0 1.5712 0.1246
FL 6.8000 9.6000 8.0374 0.5418
FW2 1.4000 2.5000 1.7582 0.2013
L1 4.4000 6.6000 5.5226 0.4200
L2 4.2000 6.8000 5.2632 0.4563
Table IV: RMSE and MAE
MAE RMSE Estimation Accuracy
FL 0.3010 0.39881 96.03%
FW2 0.2013 0.18908 91.13%
L1 0.4199 0.42848 94.17%
L2 0.4563 0.51219 91.14%
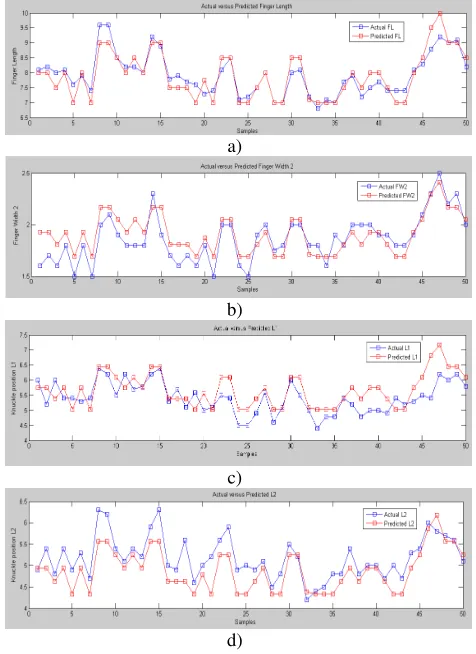
In figure 3(a-d) around 40 – 50 subset of the samples are plot indicating the actual and predicted values of FL, FW2, L1 and L2 respectively. Red line in the plot shows the actual or true values and blue line indicates the predicted values. Overlapping in the graph shows the close relation of predicted values to the actual values.
a)
b)
c)
d)
Figure 3(a-d): Plot of actual and predicted values of FL, FW2, L1 and L2
VI. CONCLUSION
To the best of our knowledge this is the first humble beginning in constructing human finger from its fractional part. In view of this Taalamana system and golden ratio are used to predict the feature values for FL, FW2, L1 and L2. The graph in figure 3 indicates close association of the actual and the estimated feature values. Estimation accuracy of 96%, 91%, 94% and 91% for FL, FW2, L1 and L2 features respectively is achieved.
VII.REFERENCES
[1] Gopinatha Rao, T. A (1920). Talamana or, Iconometry: Memoirs of the Archaeological Survey of India; no. 3. Calcutta: Supt. Govt. Print
[2] R. P. Miller, “Finger dimension comparison identify cation system", US Patent No. 3576538, 1971.
[3] R. H. Ernst, “Hand ID system", US Patent No.3576537, 1971.
[4] H. Jacoby, A. J. Giordano, and W. H. Fioretti, “Personnel Identification Apparatus", US PatentNo. 3648240, 1972.
[5] Raul Sanchez –Reillo, Carmen Sanchez-Avila, Ana Gonzalez-Macros, “Biometric identification through hand geometric measurements”, IEEE Transactions on pattern analysis and machine intelligence, Vol 22, No. 10, Oct 2000.
[6] Anil K. Jain, Arun Ross, Sharath Pankanti, “A Prototype Hand Geometry-based Verification System”, 2nd International Conference on Audio- and Video-based Biometric Person Authentication (AVBPA), Washington D.C., pp.166-171, March 22-24, 1999. [7] A.K. Jain, A. Ross, and S. Pankanti. A prototype hand
geometrybased verification system. In Proceedings of 2nd Int’l Conference on Audio- and Video-based Biometric Person Authentication, pages 166–171, March 1999.
[8] Anil K. Jain and Nicolae Duta. Deformable matching of hand shapes for verification. In Proceedings of International Conference on Image Processing, October 1999.
[9] Windy M. Brown, Melissa Hines, Briony A. Fane, S. Marc Breedlove, “ Masculinized Finger Length Patterns in Human Males and Females with Congenital Adrenal Hyperplasia”, Hormones and Behavior 42, 380–386 2002, Elsevier Science (USA)
[10]Windy M. Brown, B.A., Christopher J. Finn, B.A., Bradley M. Cooke, and S. Marc Breedlove,“Differences in Finger Length Ratios Between Self-Identified Butch and Femme Lesbians”, Archives of Sexual Behavior, Vol. 31, No. 1, February 2002, pp. 123–127
[11]Aythami Morales, Miguel A. Ferrer, Francisco Díaz, Jesús B. Alonso, Carlos M. Travieso, “Contact-free hand biometric system for real environments”.
[12]Yaroslav Bulatov, Sachin Jambawalikar, Piyush Kumar, Saurabh Sethia, “Hand recognition using geometric classifiers”
[14]Stephen Lewis “Morphological aspects of male and female hands”
[15]Gholamreza Amayeh, George Bebis, Ali Erol, Mircea Nicolescu, “A Component-Based Approach to Hand Verification”,
[16]Gholamreza Amayeh, George Bebis, Mircea Nicolescu, “Gender Classification from Hand Shape”,
[17]T. F. Cootes and Taylor, “Active shape models – smart snakes”, British Machine Vision Conference, pages 266–275, 1992.
[18]T. F. Cootes, G. J. Edwards, and C. J. Taylor, “Active appearance models”, IEEE Transactions On Pattern Recognition and Machine Intelligence, 23(6):681–685, 2001.
[19]Mikkel B. Stegmann and David Delgado Gomez, “A Brief Introduction to Statistical Shape Analysis”, a data report at http://www.imm.dtu.dk/~mbs/
[20]Sanjay Kumar, Dinesh K Kumar, Arun Sharma, and Neil McLachlan “Classification of Hand Movements Using Motion Templates and Geometrical Based Moments”, IEEE, ICISIP 2004
[21]Gift Siromoney; M. Bagavandas, S.Govindaraju (1980). "An iconometric study of Pallava sculptures". Kalakshetra Quarterly 3 (2): 7–15.
[22]http://www.cmi.ac.in/gift/Iconometry/icon_pallavasculp ture.htm
[23]Kramrisch, Stella; Raymond Burnier (1976). The Hindu Temple. Motilal Banarsidass Publ... pp. 309. ISBN 9788120802247.