Double-Blind Peer Reviewed Refereed Open Access International e-Journal - Included in the International Serial Directories
Aryabhatta Journal of Mathematics and Informatics
http://www.ijmr.net.in email id- [email protected]
Page 750 ANALYTIC STUDY OF A SYSTEM WITH CONCURRENT OPERATION OF STANDBY UNITS ANDMAINTENANCE FACILITY
Upasana Sharma*1, Gunjan Sharma*2
*
Department of Statistics, Punjabi University, Patiala, India
ABSTRACT:
aThe present paper deals with the stochastic model under which there is one main unit and two cold standby units. The maintenance facility is provided in it in order to bring out smooth functioning of the system. Initially, there is one main unit and two cold standby units. The main unit goes under maintenance solely but both the cold standby units go under maintenance together. When both main and standby unit stops functioning, the system goes to failed state. There is one repairman for repair as well as maintenance purposes. The reliability and profit analysis has also been done for the model. Various measures of system effectiveness such as MTSF and Profit are obtained using semi Markov process and Regenerative point technique.
KEYWORDS: Standby systems; semi Markov process; Regenerative point technique.
INTRODUCTION
Double-Blind Peer Reviewed Refereed Open Access International e-Journal - Included in the International Serial Directories
Aryabhatta Journal of Mathematics and Informatics
http://www.ijmr.net.in email id- [email protected]
Page 751 NOTATIONSλ Constant failure rate of main unit (Unit 1)
λ1/ λ2 Constant failure rate of cold standby units (Unit 2/3)
α1 Constant rate of Unit 1 (main unit) to go under maintenance
α2 Constant rate of Unit 2 and 3 (bothl of the standby units) to go
under maintenance
g(t)/ G(t) pdf/ cdf of repair time of the main unit at failed state (Unit 1)
g1(t)/ G1(t) pdf/ cdf of repair time of the standby unit at failed state (Unit 2)
g2(t)/ G2(t) pdf/ cdf of repair time of the standby unit at failed state (Unit 3)
h1(t)/ H1(t) pdf/ cdf of maintenance time of the main unit (Unit 1)
h2(t)/ H2(t) pdf/ cdf of maintenance time of standby units together (Unit 2,3)
OI/OII/OIII Unit 1/2/3 is in operative state
CSII/CSIII Unit 2/3 is in cold standby state
UmI/UmII/UmIII Unit 1/2/3 is under maintenance respectively
UMI/UMII/UMIII Unit 1/2/3 is under maintenance respectively from the previous state, i.e.,
maintenance is continuing from previous state
FrI/FrII/FrIII Unit 1/2/3 is under repair respectively
FwrI/FwrII/FwrIII Unit 1/2/3 is waiting for repair respectively
FRI/FRII/FRIII Unit 1/2/3 is under repair respectively from the previous state, i.e.,
repair is continuing from previous state
Double-Blind Peer Reviewed Refereed Open Access International e-Journal - Included in the International Serial Directories
Aryabhatta Journal of Mathematics and Informatics
http://www.ijmr.net.in email id- [email protected]
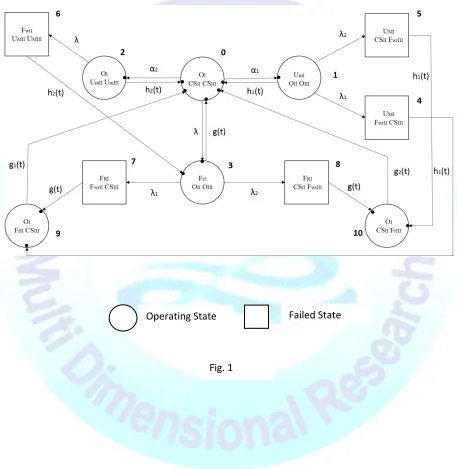
Page 752A state transition diagram in fig. 1 shows various transitions of the system. The epochs of entry into states 0,1,2,3,9 and 10 are regenerative points and thus these are regenerative states. The states 4,5,6,7 and 8 are failed states.
The non-zero elements pij , are obtained as under :
Operating State Failed State
Double-Blind Peer Reviewed Refereed Open Access International e-Journal - Included in the International Serial Directories
Aryabhatta Journal of Mathematics and Informatics
http://www.ijmr.net.in email id- [email protected]
Page 753
)
0
(
)
0
(
)
0
(
)
0
(
)
0
(
)]
(
1
[
)]
(
1
[
)
(
1
)]
(
1
[
)]
(
1
[
2 0 , 10 1 90 10 , 8 79 2 63 10 , 5 1 49 ) 8 ( 10 , 3 2 1 2 1 2 38 ) 7 ( 39 2 1 2 1 1 37 2 1 * 30 ) 6 ( 23 2 26 * 2 20 ) 5 ( 10 , 1 2 1 2 1 * 1 2 15 ) 4 ( 19 2 1 2 1 * 1 1 14 2 1 * 1 10 2 1 03 2 1 2 02 2 1 1 01
g
p
g
p
p
g
p
h
p
p
h
p
p
g
p
p
g
p
g
p
p
h
p
h
p
p
h
p
p
h
p
h
p
p
p
p
By these transition probabilities, it can be verified that
0 , 10 90 10 , 8 79 63 10 , 5 49 ) 8 ( 10 , 3 ) 7 ( 39 30 38 37 30 ) 6 ( 23 20 26 20 ) 5 ( 10 , 1 ) 4 ( 19 10 15 14 10 03 02 01
1
1
1
1
1
1
1
1
1
1
p
p
p
p
p
p
p
p
p
p
p
p
p
p
p
p
p
p
p
p
p
p
p
p
p
p
The unconditional mean time taken by the system to transit for any regenerative
Double-Blind Peer Reviewed Refereed Open Access International e-Journal - Included in the International Serial Directories
Aryabhatta Journal of Mathematics and Informatics
http://www.ijmr.net.in email id- [email protected]
Page 754 0 2 2 0 1 1 0 ) 8 ( 10 , 3 ) 7 ( 39 0 3 3 38 37 0 3 2 ) 6 ( 23 0 2 2 26 0 2 1 ) 5 ( 10 , 1 ) 4 ( 19 0 1 1 15 14 10 0 03 02 01 ) ( ) ( ) ( , ), 0 ( ' ) ( 0 dt t dt t m dt t G k where k m m m m m m m m m m m m m m m m m m m m m Thus ij q t ij dQ t ij mH
m
H
The mean sojourn time in the regenerative state i ( μi ) is defined as the time of stay in that state before
transition to any other state, then we have -
)
0
(
)
0
(
)
0
(
)
0
(
)
0
(
)
(
1
)
(
1
)
(
1
1
2 10 1 9 8 7 2 6 5 1 4 2 1 2 1 3 * 2 2 2 1 2 1 * 1 1 2 1 0
g
g
g
h
h
g
h
h
MEAN TIME TO SYSTEM FAILURE
Double-Blind Peer Reviewed Refereed Open Access International e-Journal - Included in the International Serial Directories
Aryabhatta Journal of Mathematics and Informatics
http://www.ijmr.net.in email id- [email protected]
Page 755D N T0
where 30 03 20 02 10 10 03 3 02 2 01 1 0
1
p
p
p
p
p
p
D
p
p
p
N
EXPECTED UP-TIME OF THE SYSTEM
The steady state availability of the system is given by
1 1 0
D
N
A
where)]
(
[
)]
(
[
]
[
)]
(
[
)]
(
[
) 6 ( 23 02 03 ) 8 ( 10 , 3 ) 5 ( 10 , 1 01 2 ) 6 ( 23 02 03 ) 7 ( 39 ) 4 ( 19 01 1 ) 6 ( 23 02 03 02 2 01 1 0 1 ) 6 ( 23 02 03 ) 8 ( 10 , 3 ) 5 ( 10 , 1 01 2 ) 6 ( 23 02 03 ) 7 ( 39 ) 4 ( 19 01 1 03 3 02 2 01 1 0 1p
p
p
p
p
p
k
p
p
p
p
p
p
k
p
p
p
k
p
m
p
m
D
p
p
p
p
p
p
k
p
p
p
p
p
p
k
p
p
p
N
Double-Blind Peer Reviewed Refereed Open Access International e-Journal - Included in the International Serial Directories
Aryabhatta Journal of Mathematics and Informatics
http://www.ijmr.net.in email id- [email protected]
Page 756The steady state busy period of the system is given by:
1 2
D
N
B
R
Where
)] (
[
)] (
[ ] [
) 6 ( 23 02 03 ) 8 (
10 , 3 ) 5 (
10 , 1 01 10
) 6 ( 23 02 03 ) 7 ( 39 ) 4 ( 19 01 9 ) 6 ( 23 02 03 3 2
p p p p p p W
p p p p p p W p
p p W N
and D1 is already specified.
BUSY PERIOD OF A REPAIRMAN (MAINTENANCE ONLY)
The steady state busy period of the system is given by:
and D1 is already specified.
EXPECTED NO. OF VISITS OF REPAIRMAN 02
2 01 1 3
1 3
p
W
p
W
N
where
D
N
B
M
Double-Blind Peer Reviewed Refereed Open Access International e-Journal - Included in the International Serial Directories
Aryabhatta Journal of Mathematics and Informatics
http://www.ijmr.net.in email id- [email protected]
Page 757The steady state expected no. of visits of the repairman is given by:
1
03 02 01 4
1 4
p
p
p
N
where
D
N
V
Rand D1 is already specified.
PROFIT ANALYSIS
The expected profit incurred of the system is -
R M
R
C
B
C
V
B
C
A
C
P
0 0
1
2
3C0 = Revenue per unit up time of the system
C1 = Cost per unit up time for which the repairman is busy in repair
C2 = Cost per unit up time for which the repairman is busy doing maintenance
C3 = Cost per visit of the repairman
GRAPHICAL INTERPRETATION AND CONCLUSION
Double-Blind Peer Reviewed Refereed Open Access International e-Journal - Included in the International Serial Directories
Aryabhatta Journal of Mathematics and Informatics
http://www.ijmr.net.in email id- [email protected]
Page 758t
t t
t t
e
t
h
e
t
h
e
t
g
e
t
g
e
t
g
2 2 2
1 1 1
2 2 2
1 1 1
)
(
)
(
)
(
)
(
)
(
Graphical study has been made for the profit with respect to failure rate of main unit (λ), w.r.t. revenue per unit uptime of the system (C0) for different values of rate of failure rate of main unit (λ) and w.r.t.
cost of repairman for busy in doing maintenance (C2) for different values of rate of failure rate of main
Double-Blind Peer Reviewed Refereed Open Access International e-Journal - Included in the International Serial Directories
Aryabhatta Journal of Mathematics and Informatics
http://www.ijmr.net.in email id- [email protected]
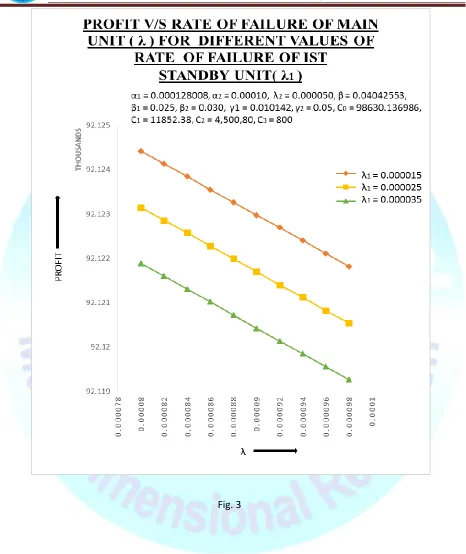
Page 759Fig. 3
Fig. 3 shows the behaviour of profit w.r.t. the failure rate of main unit (λ) for different values of failure rate of Ist standby unit (λ1). As the values of failure rate of main unit (λ) increases, the
Double-Blind Peer Reviewed Refereed Open Access International e-Journal - Included in the International Serial Directories
Aryabhatta Journal of Mathematics and Informatics
http://www.ijmr.net.in email id- [email protected]
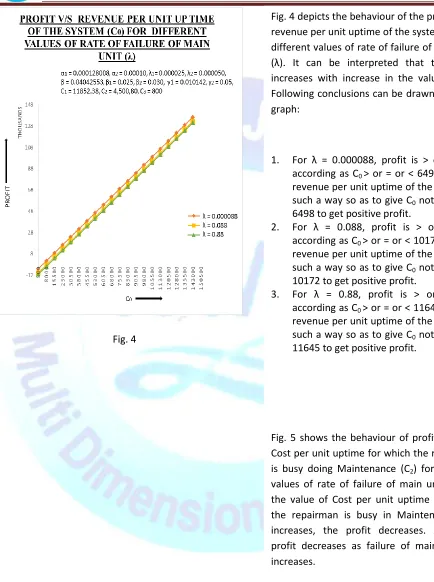
Page 760Fig. 4
Fig. 4 depicts the behaviour of the profit w.r.t. revenue per unit uptime of the system (C0) for
different values of rate of failure of main unit (λ). It can be interpreted that the profit increases with increase in the values of C0.
Following conclusions can be drawn from the graph:
1. For λ = 0.000088, profit is > or = or < according as C0 > or = or < 6498, i.e. the
revenue per unit uptime of the system in such a way so as to give C0 not less than
6498 to get positive profit.
2. For λ = 0.088, profit is > or = or < according as C0 > or = or < 10172, i.e. the
revenue per unit uptime of the system in such a way so as to give C0 not less than
10172 to get positive profit.
3. For λ = 0.88, profit is > or = or < according as C0 > or = or < 11645, i.e. the
revenue per unit uptime of the system in such a way so as to give C0 not less than
11645 to get positive profit.
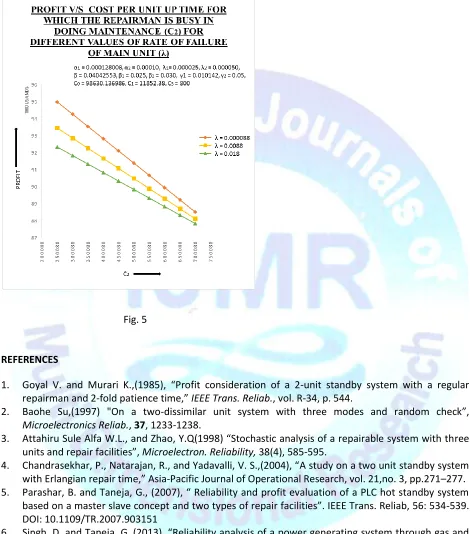
Fig. 5 shows the behaviour of profit w.r.t. to Cost per unit uptime for which the repairman is busy doing Maintenance (C2) for different
values of rate of failure of main unit (λ). As the value of Cost per unit uptime for which the repairman is busy in Maintenance (C2)
Double-Blind Peer Reviewed Refereed Open Access International e-Journal - Included in the International Serial Directories
Aryabhatta Journal of Mathematics and Informatics
http://www.ijmr.net.in email id- [email protected]
Page 761 REFERENCES1. Goyal V. and Murari K.,(1985), “Profit consideration of a 2-unit standby system with a regular repairman and 2-fold patience time,” IEEE Trans. Reliab., vol. R-34, p. 544.
2. Baohe Su,(1997) "On a two-dissimilar unit system with three modes and random check”,
Microelectronics Reliab., 37, 1233-1238.
3. Attahiru Sule Alfa W.L., and Zhao, Y.Q(1998) “Stochastic analysis of a repairable system with three units and repair facilities”, Microelectron. Reliability, 38(4), 585-595.
4. Chandrasekhar, P., Natarajan, R., and Yadavalli, V. S.,(2004), “A study on a two unit standby system with Erlangian repair time,” Asia-Pacific Journal of Operational Research, vol. 21,no. 3, pp.271–277. 5. Parashar, B. and Taneja, G., (2007), “ Reliability and profit evaluation of a PLC hot standby system
based on a master slave concept and two types of repair facilities”. IEEE Trans. Reliab, 56: 534-539. DOI: 10.1109/TR.2007.903151
6. Singh, D. and Taneja, G.,(2013), “Reliability analysis of a power generating system through gas and steam turbines with scheduled inspection,” Aryabhatta Journal of Mathamatics and Informatics, 373-380.
7. Sharma, U. and Kaur, J., (2016) “Profit Evaluation of Three Units Compressor Standby System”, in International Journal of Advanced Research Trends in Engineering and Technology (IJARTET) ,Vol. 3, No. 05, 26-30.