P R O C E E D I N G S
Open Access
Nonlinear gene cluster analysis with labeling for
microarray gene expression data in organ
development
Martin Ehler
1,2*, Vinodh N Rajapakse
2, Barry R Zeeberg
3, Brian P Brooks
4, Jacob Brown
4, Wojciech Czaja
2,
Robert F Bonner
1From
6th International Symposium on Bioinformatics Research and Applications (ISBRA
’
10)
Storrs, CT, USA. 23-26 May 2010
Abstract
Background:The gene networks underlying closure of the optic fissure during vertebrate eye development are not well-understood. We use a novel clustering method based on nonlinear dimension reduction with data labeling to analyze microarray data from laser capture microdissected (LCM) cells at the site and developmental stages (days 10.5 to 12.5) of optic fissure closure.
Results:Our nonlinear methods created clusters of genes that mapped onto more specific biological processes and functions related to eye development as defined by Gene Ontology at lower false discovery rates than conventional linear cluster algorithms. Our new methods build on the advantages of LCM to isolate pure phenotypic populations within complex tissues in order to identify systems biology relationships among critical gene products expressed at lower copy number.
Conclusions:The combination of LCM of embryonic organs, gene expression microarrays, and nonlinear dimension reduction with labeling is a potentially useful approach to extract subtle spatial and temporal co-variations within the gene regulatory networks that specify mammalian organogenesis and organ function. Our results motivate further analysis of nonlinear dimension reduction with labeling within other microarray data sets from LCM dissected tissues or other cell specific samples to determine the more general utility of our method for uncovering more specific biological functional relationships.
Background
Common variations in genetic and epigenetic patterns among humans are associated with variations in risk for developing all common chronic diseases, a few of which have been identified from genome-wide polymorphism screens [1,2]. The functional biological robustness or its failure in disease is most likely not just reflected in a few dominant components, but in many complex inter-actions within gene regulatory networks. Due to the overwhelming complexity, the deeper understanding of
such networks remains a major challenge in modern systems biology, a field that aims to discover and itera-tively refine mechanistic models of biological processes. Biological knowledge is typically encoded in the struc-ture and parameterization of these models. The Gene Ontology project [3,4] can help to incorporate the known biological details of gene functions into such analysis. The challenge is to reasonably approximate attributes in such models using experimental data that is complex, noisy, and often incomplete. For the purpose of acquiring biologically rich data sets, laser capture microdissection (LCM) has proven a powerful tool to isolate pure cell populations from complex heteroge-neous tissue specimens [5-7]. In combination with microarray technologies, that allow the simultaneous * Correspondence: [email protected]
1National Institutes of Health, Eunice Kennedy Shriver National Institute of
Child Health and Human Development, Section on Medical Biophysics, Bethesda MD 20892, USA
Full list of author information is available at the end of the article
measurement of expression levels for thousands of genes, LCM enables identifying critical gene products even if expressed at low copy numbers. Our work aims to facilitate efforts in systems biology by organizing data in ways that can suppress noise and better reveal latent, biologically meaningful structure. Coloboma is a not uncommon congenital defect of human ocular develop-ment resulting in large retinal holes which often signifi-cantly affect vision. The present paper focuses on refinements in the analysis of a temporal series of microarray data obtained from microdissected sites of retinal fissure closure in normal mouse embryos. This data was previously analyzed [8] to identify a putative repressive transcription factor, nlz2 (zinc finger protein 503), which, when its expression was blocked in zebra-fish embryos, led to incomplete optic fissure closure, a coloboma model. The interaction of transcription fac-tors, binding sites and gene networks involving nlz2 and related genes, however, are poorly understood [8]. The present paper is dedicated to develop a novel pipeline for the analysis of microarray gene expression data that complements standard approaches and provides a list of candidate genes guiding further experimental analysis of genetic variations.
By developing and applying a novel clustering scheme, we have identified a 50 per cent larger gene cluster (in comparison to PCA and previous hierarchical cluster analyses [8]), whose spatio-temporal gene expressions correlate with nlz2. According to GoMiner, a computa-tional high-throughput tool for biological interpretation of genomic, transcriptomic, and proteomic data, that identifies the biological processes, functions and compo-nents of gene clusters [9,10], this larger cluster still shows gene enrichment for its specific functions in the context of Gene Ontology.
Next, using GoMiner, we sought to identify those gene clusters whose co-expressions correlate with processes in eye development. First, we apply a novel clustering scheme that builds on the intertwining of Laplacian Eigenmaps, a nonlinear geometrical data transformation, with k-means and hierarchical clustering. To validate the findings, we also use two standard clustering schemes, basick-means and principal component analy-sis combined with k-means and hierarchical clustering. All three methods identify gene clusters enriched for functional GoMiner categories related to eye develop-ment, but the proposed nonlinear scheme leads to lower false discovery rates. Secondly, we have proposed a mechanism that allows experts to introduce their input in form of additional, labeled information by means of a potential on a data-dependent graph in [11] to improve the dimension reduction and clustering process. Dis-tances between certain labeled genes are forced to appear closer than normally while others are increased.
In the present paper, we aim to label genes that are highly connected and thus constitute hubs within the regulatory network. Such genes appear to promote coherence within a gene cluster and would thus be ideal candidates for labeling to obtain a more meaningful and coherent clustering. There are many ways to extract genes of high connectivity, and we use the weights that are generated by the Laplacian on the regulatory net-work and alternatively weighted correlation netnet-works as described in [12]. Identified gene hubs are then labeled to incorporate regulatory network characteristics into the labeled Laplacian clustering. This novel clustering scheme based on nonlinear dimension reduction and involving labeled data further improves the biological specificity according to GoMiner analysis.
Starting from experimental work based on LCM and microarray technologies in organogenesis, we obtain a list of candidate genes that could be significant in nor-mal development of optic fissure closure and could be useful in guiding analysis of genetic variations in humans with coloboma.
Materials and methods
be further steered by involving labels [11] that are either derived from weighted correlation networks analysis [12] or from the Laplacian analysis. We intertwine this new data representation with k-means [15], a widely used clustering scheme. GoMiner [9,10] is then used to identify genes within clusters that are associated with particular biological processes or function. Let us list the steps of our proposed scheme:
1. Expression vectors:Each gene’s expression over the 8 time points builds a vector. They constitute a col-lection {x1,…, xn} of 8-dimensional vectors, where nis the number of considered expressions
2.Nonlinear dimension reduction:Choose a target dimensiond <D, and obtain a newd-dimensional data representation {y1,…, yn} of the originalD-dimensional vectors {x1,…,xn}
3. k-means:Run k-means on {y1,…,yn} to obtain the final clustering
4.GoMiner:Feed the clusters into GoMiner to evalu-ate their biological relevance
Step 2 in the above scheme is specified in two differ-ent ways: First, we use a nonlinear dimension reduction method without labeling (unsupervised):
2.A Laplacian Eigenmaps:Choose the numberm of gene neighbors and a target dimensiond<D, then apply Laplacian Eigenmaps to obtain a new d-dimensional data representation {y1,…,yn} of the original D -dimen-sional vectors {x1,…,xn}
Alternatively, we may want to incorporate further input into the dimension reduction process by using labeled data. We then identify step 2 with the following supervised procedure:
2.B a)Identifying highly connected genes:Apply an R package for weighted correlation network analysis (WGCNA) [12] to identify genes that are highly con-nected within the gene regulatory network and that act as hubs. Alternatively, use the Laplacian analysis to identify highly connected genes
2.B b) Schroedinger Eigenmaps: Gene hubs are labeled by means of a potential term. Choose the num-ber m of gene neighbors and a target dimensiond <D. The application of Laplacian Eigenmaps with potentials [11] yields a newd-dimensional data representation {y1,
…,yn} of the originalD-dimensional vectors {x1,…,xn} In the following, we present the components of the above scheme in more detail. For comparison we also applied PCA andk-means and therefore briefly discuss these conventional methods too.
Principal component analysis
PCA [16] is a statistical tool that linearly transforms the data into an orthogonal coordinate system whose axes correspond to the principal components in the data, i.e., the first principal component accounts for as much
variance in the data as possible and, successively, further components capture the remaining variance. Through an eigenanalysis, the principal components are deter-mined as eigenvectors of the dataset’s covariance matrix and the corresponding eigenvalues refer to the variance that is captured within each eigenvector. After subtract-ing the mean of the dataset, PCA is performed on vec-tors {x1,…,xn} by first diagonalizing the covariance matrix cov(X) = E(XX⊤), whereX = (x1…xn) is the zero mean data matrix. The eigenvectors p1,…,pD-the prin-cipal components ordered according to the magnitude of their eigenvalues - provide the transformed dataY= W⊤X, whereW= (p1…pD). We obtain the collection of d-dimensional vectors {y1,…,yn} whose first entries represents the abundance of the primary principal. The second entries are each datapoint’s projection along the second eigenvector and so forth.
Laplacian Eigenmaps
Laplacian Eigenmaps (LE) [13,14] is a nonlinear geo-metric tool that transforms data into a new representa-tion in a nonlinear fashion. Given points {x1,…,xn}⊂ℝD, we assume that they are steered by dlatent variables, and aim to find a new data representation {y1,…, yn}⊂
ℝd
. We briefly recall the three step procedure of Lapla-cian Eigenmaps.
Step 1: Adjacency graph, m-nearest neighborsWe build a graphG, whose nodes iandjare connected ifxi is among the m-nearest neighbors of xjor vice versa. The distance between data points is measured by the Euclidean metric. The graphGrepresents the connectiv-ity of the data vectors.
Step 2: Heat kernel as weights Next, we weight the edges of the graph and focus on the diffusion weight matrix Wgiven by
The number of neighbors mcontrols the sparsity of W.
Step3: Solving an eigenvalue problem We denote a potential new data representation by y = (y1,…,yn)⊤, where each row is considered as a vector in ℝd, and we then consider the following minimization problem
eigenvalue solutions ofLx =lDxunder the constraint y⊤Dy =I, where Idenotes the identity matrix, i.e., the minimizer y’s columns are the d eigenvectors with respect to the smallest eigenvalues. If the graph is con-nected, then1 = (1,…,1)⊤is the only eigenvector with eigenvalue 0, and we exclude it. Instead of (2), we try to find the minimizer of
By applying the change of variables z = D1/2y, this yields
eigenvectors with smallest nonzero eigenvalue, and we obtain thed-dimensional representation {y1,…,yn} fromy =D-1/2z.
Identifying highly connected genes
Weighted gene co-expression network analysis is a sys-tems biology tool that allows to identify highly con-nected genes within a regulatory network. An R package implementation WGCNA is available with an accompa-nying tutorial [12]. Alternatively, the matrixDin (2) is a measure of the connectivity within the network and can be used to identify highly connected genes within the Laplacian framework directly.
Schroedinger Eigenmaps
Based on the Laplacian matrix Lin (3), a flexible poten-tial, that can capture additional labels, has been intro-duced in [11]. The matrix L is replaced with a Schroedinger type matrix E = L + V, where V is a potential matrix that encodes labels. One then aims to minimize
The result is a new Schroedinger Eigenmaps method that allows for input in an otherwise fully automated dimension reduction process [11]. Here, labels are uti-lized to emphasize“important” genes, and we use the connectivity of genes as a measure of their importance in the description of the regulatory network.
Standard cluster analysis
For hierarchical clustering, we refer to [17], and we also apply a shape similarity-based clustering as introduced
in [18]. k-means is a method of cluster analysis which aims to partitionnobservations intokclusters {c1,…,ck}, where khas to be chosen a-priori [15], i.e., one aims at minimizing algorithm requires the target number of clusters to be specified as a parameter.
Thek-means algorithm begins with a data set, a target number of clustersk, and a set ofs1,…,sk initial cluster centroids. It then iteratively assigns points to clusters by centroid proximity, and then adjusts centroids to reflect changes in cluster membership. The algorithm termi-nates either after a specified number of iterations, or once the cluster centroids/membership no longer change. Although optimal results cannot be guaranteed, the algorithm is quite fast, and many runs can be effi-ciently computed, with the best clustering taken as an overall result.
GoMiner
GoMiner provides a quantitative and statistical analysis-tool for biological interpretation of genomic, transcrip-tomic, and proteomic data, commonly derived from gene expression microarray experiments. It classifies genes into biologically coherent categories and then uses the Gene Ontology project to identify the biological pro-cesses, functions and components of genes within these categories [9,10]. A one-sided Fisher’sp-value is used to determine the significance and biological enrichment levels within a category.
Clustering with Genesis
Clustered image maps (CIMs) were first introduced in [19] and are produced here with the Genesis program [20]. We select the Euclidean distance metric and average linkage for hierarchal clustering. To facilitate visualization, a recently-added feature of GoMiner has been implemented that removes large generic categories from all CIMs.
Silhouette coefficient
The silhouette coefficient is a measure for the coherence of clusters. If we take a clusteringCto be a mapping from a data setX = {x1,…,xn} to the integers 1, 2,…,k (wherekis the total number of clusters), we can define the silhouette coefficientsil(x) for each pointxinXto be
sil x B x A x A x B x
( ) ( ) ( )
max( ( ), ( )),
where A(x) is the average distance between x and other points in its cluster, and B(x) is the average dis-tance between xand the points in the nearest neighbor-ing cluster, cf. [21]. The silhouette coefficient sil(i)for a clusteriis the average of the coefficients for its consti-tuent points. We similarly define the silhouette coeffi-cient sil for an entire clustering to the average silhouette coefficient over all data set points. A clustering with a silhouette coefficient closer to 1 will contain more cohe-sive and well-separated clusters. For our experiments, we use the squared Euclidean distance for the computa-tions indicated above, as well as for the data clustering algorithms.
Description of the approach
Microarray data from LCM isolated cells in a mouse model of coloboma as described in the present Section are analyzed by using standard cluster analysis and a novel gene clustering scheme. We derive a coherent clustering and make use of GoMiner to identify those genes identified in public databases as being associated with eye development or function as a measure of the quality of the other members in the cluster. We used GoMiner to identify the degree of association of clusters obtained by all methods with early stage retinal develop-ment, and, in particular, with the closure of the optic fissure, see Figures 1, 2, 3, 4, 5. Fork-means, we set the target number of clusters to be 24, based on previous work with the current data set [8] that yielded biologi-cally meaningful (but smaller and fewer) cluster results. The maximal silhouette coefficient sil specifies the best k-means clustering over 100 repeated runs, starting in
each case from different randomly selected initial cen-troids. The maximum was stable over different 100 run sets, suggesting that an at least near optimal clustering was being obtained. Since the parameter space is too big for an exhaustive search in the dimension reduction process, we fixs= 1/8 in (1) and assess remaining para-meters (number of nearest neighbors and target dimen-sion) over>m = 5,…, 10, 12, 15, 20, 25, 50, 100 andd = 1, …, 10, 12, 16. The idea is that parameter combina-tions that yield better cluster structure in the mapped data {y1,…,yn} might be better tuned to resolve possible intrinsic structure in the original data {x1…,xn}. Silhou-ette coefficients suggest valuesm= 10 andd= 2, which additionally provide excellent GoMiner gene identifications.
Results
We aim to increase our understanding of the gene net-work underlying the closure of the optic fissure during vertebrate eye development:
Enlarged cluster containing nlz2
We have identified a 50 per cent larger gene cluster than with hierarchical clustering in [8] whose spatio-temporal gene expressions significantly correlate with nlz2, a gene which when previously inhibited in zebra-fish induced coloboma. The latter cluster is associated with 210 Affymetrix probes corresponding to 169 genes, nlz2 was among them. See Figures 6 and 7 for gene expression profiles and its set of enriched functional categories. GoMiner assigns the functional category of
‘gene silencing’, indicating the repressive influence of
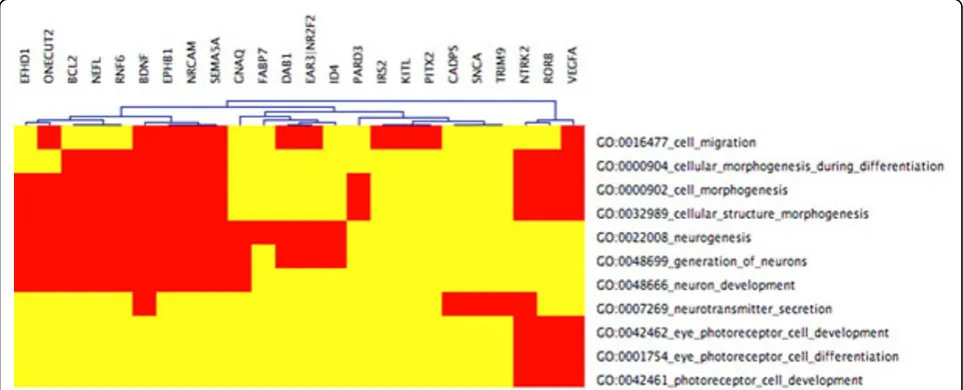
Figure 2CIM cluster 22 with relaxedFDR portion CIM for LE+k-means cluster 22 with functional categories related to eye development (the entire CIM contains 74 GO categories). The input cluster for the present CIM is the same as for Figure 1. By choosing the less stringent FDR< 0.15, more GO categories are statistically enriched, and 36 genes (only 24 in Figure 1) are mapped to these GO categories. Beside the eye related categories in Figure 1, there are additionally eye morphogenesis, eye development, and sensory organ development.
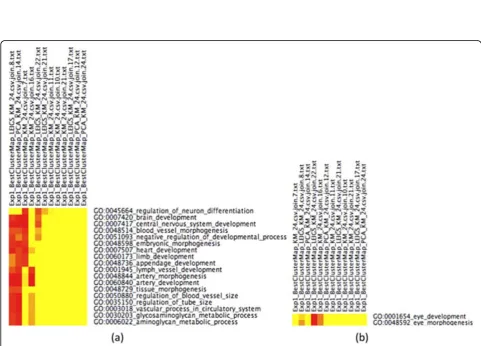
Figure 3CIMs across methodsEnriched GoMiner categories that are shared among clustering methods. Each of the 3 different clustering methods (LEIGS KM 24, PCA KM 24, KM 24) produced 24 clusters. We picked 12 among the 72 clusters that seemed to show significant enrichment by means of GO categories. (Yellow means no association. The darker red, the stronger the association between cluster and category) Cluster 22 from Laplacian Eigenmaps+k-means has shown eye related GO categories in Figures 1 and 2 with very stringent FDR. Figures 3 a)-b) verify that these categories have not been picked by chance and that the proposed Laplacian-based scheme leads to lower false discovery rates than the other methods and hence appears to provide greater biological specificity and sensitivity. (a) GO categories that are shared by at least three clusters, FDR< 0.10. First, cluster 8 of Laplacian Eigenmaps+k-means appears to be closely related to cluster 14 derived from PCA+k-means. Cluster 22 from Laplacian Eigenmaps+k-means shares few biological functions with cluster 7 ofk-means. However, GO categories that are related to eye development are not shared by any other method at FDR< 0.10. Recall that cluster 22 from Laplacian Eigenmaps+k-means has shown enrichment for these categories already at FDR< 0.05 in Figure 1. (b) The portion CIM with FDR< 0.20 that is associated to additional eye development categories that weren’t present in Figure 3a). They are shared by the Laplacian+k-means cluster 22, by
nlz2 and co-varying genes. Previous biological studies have shown nlz2 gene product to repress gene transcrip-tion of a number of genes regulated hindbrain develop-ment possibly as part of a transcription factor complex consistent with its H2N2 zinc finger domain and its binding site for histone deacetylase. Consistent with this hypothesis, we also identify an additional cluster that varies inversely with the primary ‘nlz2 cluster’ gene silencing, suggestive of the previously documented role of nlz2 in suppression of gene transcription, cf. Figure 8.
One complementary cluster
We have found a large cluster whose shape is distinct from nlz2 by applying the similarity-based shape cluster-ing in [18]. GoMiner assigns a number of significantly associated functions to this large cluster including retina morphogenesis (vertebrate eye),generation of neurons, cellular morphogenesis during differentiation, photoreceptor differentiation, cell motility, neuron dif-ferentiation, cell projection organization, and biogenesis. The highlighted functions are specifically associated
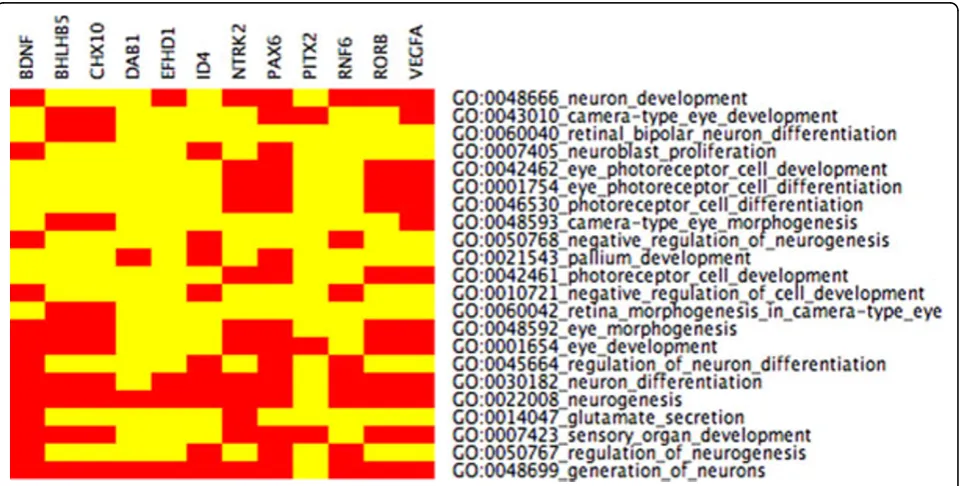
Figure 4CIM Schroedinger Eigenmaps ISeven highly connected genes from Figures 11 and 12 were labeled in Schroedinger Eigenmaps. After clustering, all seven labeled genes are contained in the same cluster with 145 other genes. The cluster is enriched for categories (eye morphogenesis, eye development) that are more specific to eye development than the results without labeling suggesting that data-dependent gene labeling can increase the biological specificity.
with CHX10, a gene in this cluster that has previously been identified in retinal development, see, for instance, [22,23].
Collection of enriched clusters
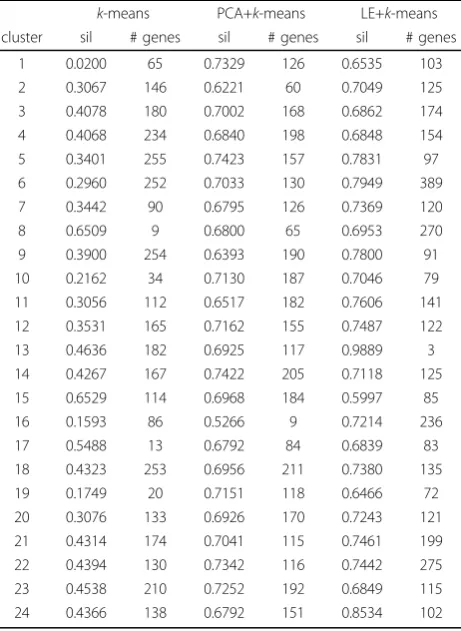
We also applyk-means on the original data set and on PCA and LE reduced data. The selected‘best’k-means result applied directly to the original data has an overall silhouette coefficient of 0.38. To evaluate PCA+k-means, for each possible number of retained principal compo-nents, the mapped data is clustered, and overall silhou-ette scores are obtained. The best results refer to the mapping based on principal components capturing about 85% of the variance, with the best overall silhou-ette score being 0.698. The silhousilhou-ette scores in the mapped data are substantially higher than those obtained following clustering of the original data, illus-trating the fact that Laplacian Eigenmaps enhance clus-ter structure, see Table 1 for more details.
We find that PCA+k-means, basic k-means, and LE +k-means yield several significantly enriched gene clus-ters (out of a total of 24) associated with
developmental processes, cf. Table 2. Cluster 22 of the Laplacian Eigenmaps-based approach reveals a cluster significantly enriched (with a false discovery rate (FDR) of less than 0.05) for genes specifically implicated in eye development - which is the focus of the experi-mental work underlying the data set considered in this study. These functional categories (in GoMiner termi-nology) are
(i) GO:0042462 eye photoreceptor cell development, (ii) GO:0001754 eye photoreceptor cell differentiation, (iii) GO:0042461 photoreceptor cell development. When slightly relaxing the FDR up to < 0.15, this clus-ter 22 shows gene enrichment for further eye specific developmental functions:
(iv) GO:0048592 eye morphogenesis, (v) GO:0001654 eye development,
(vi) GO:0046530 photoreceptor cell differentiation, see also Figures 1 and 4. These categories are neither hit by k-means nor PCA+k-means clustering when restricting the FDR to < 0.05. By relaxing the FDR, how-ever, both k-means and PCA+k-means clustering show gene enrichment for eye specific functions. This verifies that the eye specific functions in LE+k-means cluster 22 are real and have not been picked up by chance. To support the latter claim, we compare the enriched cate-gories in the LE+k-means cluster 22 with the clusters of the other two clustering methods with relaxed FDR. It turns out that specific eye development functions are present in all three clustering methods, but our pro-posed Laplacian-based scheme leads to lower false dis-covery rates, see also Table 2. Potential nonlinear structures in the data could be an explanation for this observation, see Figure 9. A nonlinear dimension reduc-tion method would clearly be better suited to fit non-linear structures than non-linear methods. CIMs in Figures 3 a)-b) indicate which clusters across the three methods share common GoMiner categories. It enables us to identify categories that are more specific to one method than to the others. Based on Table 1 the fraction of genes, that are associated to biological functions, are computable for each cluster, method, and false discovery rate.
Note on LE+k-means
We note that relatively unusual expression patterns are often mapped to distinct, outlying clusters by the Lapla-cian Eigenmaps approach. For example, the three expression patterns indicated in Figure 8 form a distinct cluster under the Laplacian Eigenmaps data representa-tion. They are not as well separated in the original and PCA-mapped data, and are consequently misplaced in inappropriate clusters. This could be a technical expla-nation for greater biological specificity of Laplacian Eigenmaps clustering.
Schroedinger Eigenmaps
We first label a collection of transcription factors that are known to be annotated to eye development. Enriched GO categories, however, appear generic when applying Schroedinger Eigenmaps with such labels, cf. Figure 10. To obtain more meaningful labels, that are directly extracted from the data rather than from the lit-erature, we identify a set of highly connected genes through the weighted correlation analysis described in [12], see Figures 11 and 12. These“hub genes”are then labeled by means of the potential to steer Schroedinger Eigenmaps utilizing the gene network topology. This labeling seems to further improve the biological specifi-city, cf. Figure 4. Alternatively, the matrix D in (2) is a natural measure of the connectivity within the Laplacian framework. According to D, we use highly connected genes as labels within the LE cluster 22, cf. Figure 13, providing the highest biological specificity, cf. Figure 5. Enriched GO categories that are derived from super-vised and unsupersuper-vised dimension reduction are shown in Table 3. The supervised procedure Schroedinger Eigenmaps identifies more categories specific to early
Figure 7CIM containing nlz2Clustered Image Map (produced by GoMiner) showing enriched functional categories for the cluster that contains nlz2 and 168 other genes. More genes in this cluster have been associated to the 5 above GO categories (gene silencing is among them) than one would expect by chance. The 7 genes (DNMT1,…,TOPBP1) above are mapped to these GO categories within the GoMiner database. Red indicates that genes were mapped to GO categories. Yellow means no annotation. Due to gene expression co-variation within the cluster, other genes in the cluster could possibly related to the above GO categories too. Since gene silencing is associated to this cluster, one may speculate that nlz2 and co-varying genes have repressive function and that there is a cluster that shows the reverse expression profile, see Figure 8.
Figure 8outliersOutliers that LE+k-means captures into a separate cluster, the associated Affymetrix probes are 1427262_at,
retinal development and the optic fissure closure than the unsupervised approach.
Discussion
Obtaining a clearer understanding of the gene regulatory network underlying optic fissure closure during eye development will be a long process involving genetic analysis of humans with coloboma and studies of eye development in animal models. Our present analysis and results focus on expanding a list of candidate genes that could be critical for normal fissure closure and in coloboma patients may contain mutations. Compared with conventional clustering algorithms that we tested, our new method is able to identify larger clusters asso-ciated either with the nlz2 gene expression or with a distinctly complementary pattern enriched with associa-tions to eye development gene ontologies. It also uniquely identifies the ‘nlz2-repressed’pattern as a dis-tinct cluster, cf. Figure 2. The large temporally covarying gene cluster in Figure 7 is identified by GoMiner as being significantly associated with gene silencing, sug-gestive of a gene regulatory network that represses alter-native fates until optic fissure closure is successfully completed (day 11.5 in the mouse). The pattern of genes in Figure 2 could represent such genes that are transiently repressed only when the nlz2 cluster is high. Using temporal pattern-based similarity clustering [18] allows identification of other distinct clusters (i.e., not containing nlz2) in which GoMiner identifies significant associations with specific developmental functions in databases.
Distinct biological specificity for our data set is obtained when labeling highly connected genes and encoding these labels in the potential term. The GO categorieseye morphogenesis, retina morphogenesis in camera type eye, and camera type eye morpho-genes, for instance, reflect the optic fissure closure and are identified by Schroedinger Eigenmaps suggesting that nonlinear dimension reduction with labeled data can improve the biological specificity in gene cluster analysis, cf. Figure 5 and Table 3.
Clearly, our new mathematical approach to identify new components of gene regulatory networks control-ling development is preliminary and would need further validation to claim its usefulness in more generality. We anticipate improvements in our analysis methods based on nonlinear dimension reduction with connectivity analysis and labeled data.
Conclusions
Microarray data are commonly used for global searches for gene expression changes that might be associated Table 1 comparison for unsupervised methods:
Silhouette coefficients and number of genes for each cluster and unsupervised clustering method (no labels).
Laplacian Eigenmaps+k-means leads to higher silhouette
coefficients
k-means PCA+k-means LE+k-means cluster sil # genes sil # genes sil # genes
1 0.0200 65 0.7329 126 0.6535 103
2 0.3067 146 0.6221 60 0.7049 125
3 0.4078 180 0.7002 168 0.6862 174
4 0.4068 234 0.6840 198 0.6848 154
5 0.3401 255 0.7423 157 0.7831 97
6 0.2960 252 0.7033 130 0.7949 389
7 0.3442 90 0.6795 126 0.7369 120
8 0.6509 9 0.6800 65 0.6953 270
9 0.3900 254 0.6393 190 0.7800 91
10 0.2162 34 0.7130 187 0.7046 79
11 0.3056 112 0.6517 182 0.7606 141
12 0.3531 165 0.7162 155 0.7487 122
13 0.4636 182 0.6925 117 0.9889 3
14 0.4267 167 0.7422 205 0.7118 125
15 0.6529 114 0.6968 184 0.5997 85
16 0.1593 86 0.5266 9 0.7214 236
17 0.5488 13 0.6792 84 0.6839 83
18 0.4323 253 0.6956 211 0.7380 135
19 0.1749 20 0.7151 118 0.6466 72
20 0.3076 133 0.6926 170 0.7243 121
21 0.4314 174 0.7041 115 0.7461 199
22 0.4394 130 0.7342 116 0.7442 275
23 0.4538 210 0.7252 192 0.6849 115
24 0.4366 138 0.6792 151 0.8534 102
Table 2 The number of enriched Go-categories are counted over all 24 clusters at a false discovery rate of
0.05 which is the default configuration of GoMiner.k
-means and PCA+k-means do not show any eye specific
enrichement in any of the clusters. Only LE+k-means
provides one cluster that is enriched for 3 categories specific to eye development. These categories would have even been picked at an FDR of 0.01 suggesting
strong statistical support for the LE+k-means
performance. Potential nonlinear structures in the data could be an explanation for this observation, see Figure 13
# enriched Go-categories 55 17 27
# enriched Go-categories specific to eye development
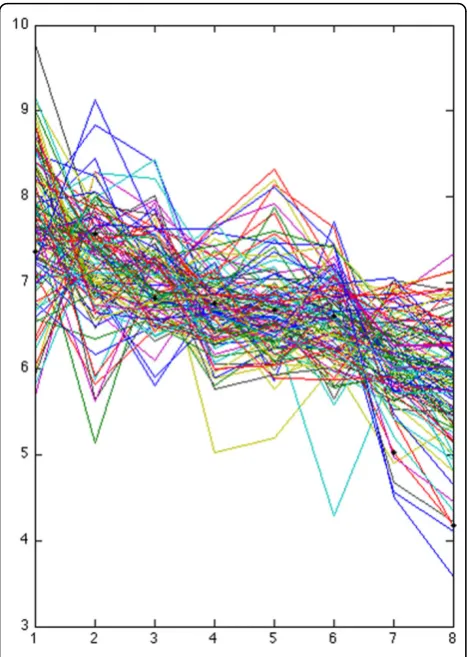
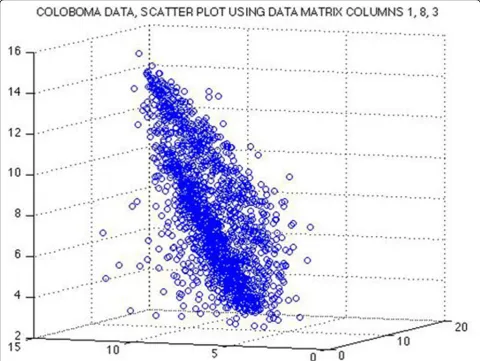
Figure 9The 8-dimensional data are projected onto a 3-dimensional subspaceThe 3-dimensional subspace is spanned by their 1st, 3rd, and 8th coordinates. If the data would lie on a linear subspace inℝ8, then the projected data must show a linear pattern. However, the actual projection of our data does not show a linear pattern but rather two cones next to each other. A nonlinear approach like Laplacian Eigenmaps could be useful to recover nonlinear structure of the data manifold.
with a perturbation of a cell state or in pathology. In organ development, temporal and spatial patterns accessible through microdissection are associated with reproducible changes in gene expression of even larger numbers of genes. More efficient analysis of microar-ray data from such microdissected samples could pro-vide improved understanding of cell fate and organogenesis as well as elaboration of gene expression covariance networks. Our nonlinear analysis scheme based on Laplacian Eigenmaps and labeling highly con-nected genes through a potential appears to offer advantages over standard clustering algorithms in the
sense of greater biological specificity and sensitivity. Our results motivate further analysis of nonlinear dimension reduction with labeling within other micro-array data sets from LCM dissected tissue or other phenotypically specific cell samples to potentially vali-date its biological specificity in more generality. Together with LCM-focused gene expression
Figure 11plot of connectivity scores in increasing order for WGCNA weightsTo derive gene labels directly from the measured Affymetrix data rather than from the literature, we aim to identify co-varying genes with high connectivity in the regulatory network. The plot shows the connectivity of Affymetrix probes within a cluster enriched for eye development computed by WGCNA. Rank index refers to Affymetrix probes. The associated most highly connected genes according to WGCNA are Cdh4, Dll1, Tox, Onecut2, Dcc, Epha5, Cadps.
Figure 12connectivity network for WGCNA weightsPortion of the thresholded weighted correlation network derived from WGCNA. In the entire connectivity network, each of the genes to be labeled (Cdh4, Dll1, Tox, Onecut2, Dcc, Epha5, Cadps) would have more than 16 connections, see also Figure 11.
Figure 13plot of connectivity scores in increasing order for LE weights, LE cluster 22We aim to further improve the biological specificity of cluster 22 derived from Laplacian Eigenmaps +k -means. To identify co-varying genes with high connectivity in the regulatory network of cluster 22, we measure connectivity by means of the weight matrix D in (2). The connectivity of Affymetrix probes within LE+KM cluster 22 are shown. The most highly connected genes in cluster 22 are Etv3, Zfp386, Kdm4c, Eea1, Fyttd1, which can be used as labels in Schroedinger Eigenmaps.
Table 3 Comparison between supervised and unsupervised methods: GO categories related to the optic fissure closure that are associated to clusters derived from unsupervised (no data labels) and
supervised (labeled data) methods. Using labels that are computed directly from the measured data appears to provide more biological meaningful associations than unsupervised methods
Unsupervised methods Schroedinger Eigenmaps + WGCNA / D-labels
eye morphogenesis eye development eye photoreceptor cell development eye photoreceptor cell differentiation photoreceptor cell development
embryonic morphogenesis morphogenesis of a branching structure
sensory organ development
camera type eye morphogenesis retina morphogenesis in camera type eye
microarray measurements, our proposed analysis could be part of an iterative process to more completely identify additional elements in gene regulatory net-works underlying mammalian organogenesis.
Acknowledgements
The research was funded by intramural research funds from the National Institute of Child Health and Human Development, National Institutes of Health. WC is supported, in part, by NSF (CBET0854233), by NGA (HM15820810009), and by ONR (N000140910144). ME is supported by the NIH/DFG Research Career Transition Awards Program (EH 405/1-1/575910). This article has been published as part ofBMC ProceedingsVolume 5 Supplement 2, 2011: Proceedings of the 6th International Symposium on Bioinformatics Research and Applications (ISBRA’10). The full contents of the supplement are available online at http://www.biomedcentral.com/1753-6561/5?issue=S2.
Author details
1
National Institutes of Health, Eunice Kennedy Shriver National Institute of Child Health and Human Development, Section on Medical Biophysics, Bethesda MD 20892, USA.2University of Maryland, Department of Mathematics, Norbert Wiener Center, College Park MD 20742, USA.3National Institutes of Health, National Cancer Institute, Laboratory of Molecular Pharmacology, Genomics & Bioinformatics Group, Bethesda MD 20892, USA. 4National Institutes of Health, National Eye Institute, Ophthalmic Genetics
and Visual Function Branch, Bethesda MD 20892, USA.
Authors’contributions
ME, WC, and RFB made substantial contributions to conception and design of the study. BPB and JB acquired the primary expression data. ME, VNR, and BRZ analyzed the data. ME, VNR, and RFB contributed to the interpretation of the data. ME and RFB wrote the manuscript, and ME, VNR, BRZ, WC, and RFB have been involved in revising it critically.
Competing interests
The authors declare that they have no competing interests.
Published: 28 April 2011
References
1. Mordantameron DJ, Yang Z, Gibbs D, Chen H, Kaminoh Y, Jorgensen A, Zeng J, Luo L, Brinton E, Brinton G, Bernstein PS JMB, Zabriskie NA, Tang S, Constantine R, Tong Z, Zhang K:HTRA1 variant confers similar risks to geographic atrophy and neovascular age-related macular degeneration. Cell Cycle2007,6(9):1122-1125.
2. Yang Z, Camp NJ, Sun H, Tong Z, Gibbs D, Cameron DJ, Chen H, Zhao Y, Pearson E, Li X, Chien J, Dewan A, Harmon J, Bernstein PS, Shridhar V, Zabriskie NA, Hoh J, Howes K, Zhang K:A variant of the HTRA1 gene increases susceptibility to age-related macular degeneration.Science
2006,314(5801):992-993.
3. Ashburner M, Ball CA, Blake JA, Botstein D, Butler H, Cherry JM, Davis AP, Dolinski K, Dwight SS, Eppig JT, Harris MA, Hill DP, Issel-Tarver L, Kasarskis A, Lewis S, Matese JC, Richardson JE, Ringwald M, Rubin GM, Sherlock G:Gene ontology: tool for the unification of biology. The Gene Ontology Consortium.Nat. Genet.2000,25:25-9.
4. Gene Ontology Consortium:The Gene Ontology project in 2008.Nucleic Acids Res2008,36:D440-4.
5. Bonner RF, Emmert-Buck M, Cole K, Pohida T, Chuaqui R, Goldstein S, Liotta LA:Laser capture microdissection: molecular analysis of tissue. Science1997,21(278):1481-1483.
6. Goldstein SR, McQueen OG, Bonner RF:Thermal modeling of laser capture microdissection.Appl. Opt.1998,37(31):7378-91.
7. Suàrez-Quian CA, Goldstein SR, Bonner RF:Laser capture microdissection: a new tool for the study of spermatogenesis.J. Androl.2000,21(5):601-8. 8. Brown JD, Dutta S, Bharti K, Bonner RF, Munson PJ, Dawid IB, Akhtar AL,
Onojafe IF, Alur RP, Gross JM, Hejtmancik JF, Jiao X, Chan W, Brooks BP:
Expression profiling during ocular development identifies 2 Nlz genes with a critical role in optic fissure closure.Proc. Nat. Acad. Sci. USA2009,
106(5):1462-7.
9. Zeeberg B, Feng W, Wang G, Wang MD, Fojo AT, Sunshine M, Narasimhan S, Kane DW, Reinhold WC, Lababidi S, Bussey KJ, Riss J, Barrett JC, Weinstein JN:GoMiner: a resource for biological interpretation of genomic and proteomic data.Genome Biol2003,4(4):R28.
10. Zeeberg B, Qin H, Narasimhan S, Sunshine M, Cao H, Kane DW, Reimers M, Stephens RM, Bryant D, Burt SK, Elnekave E, Hari DM, Wynn TA,
Cunningham-Rundles C, Stewart DM, Nelson D, Weinstein JN: High-Throughput GoMiner, an’industrial-strength’integrative gene ontology tool for interpretation of multiple-microarray experiments, with application to studies of Common Variable Immune Deficiency (CVID). BMC Bioinformatics2005,6:168.
11. Czaja W, Ehler M:Schroedinger Eigenmaps for the analysis of bio-medical data.submitted to IEEE T. Pattern Anal.2010.
12. Langfelder P, Horvath S:WGCNA: an R package for weighted correlation network analysis.BMC Bioinformatics2008,9.
13. Belkin M, Niyogi P:Laplacian eigenmaps and spectral techniques for embedding and clustering.NIPS2002,14.
14. Belkin M, Niyogi P:Laplacian eigenmaps for dimensionality reduction and data representation.Neural. Comput.2003,15(6):1373-1396.
15. Lloyd SP:Least-squares quantization in PCM.IEEE Trans. Inform. Theory
1982,28(2):129-137.
16. Pearson K:On lines and planes of closest fit to systems of points in space.Philosophical Magazine1901,2(7-12):559-572.
17. Hastie T, Tibshirani R, Friedman J:The Elements of Statistical Learning
Springer; 2009.
18. Hestilow T, Huang Y:Clustering Of Gene Expression Data Based On Shape Similarity.EURASIP J. Bioinform. Syst. Biol.2009.
19. Weinstein JN, Myers TG, O’Connor PM, Friend SH, Fornace JAJ, Kohn KW, Fojo T, Bates SE, Rubinstein LV, Anderson NL, Buolamwini JK, van Osdol WW, Monks AP, Scudiero DA, Sausville EA, Zaharevitz DW, Bunow B, Viswanadhan VN, Johnson GS, Wittes RE, Paull KD:An information-intensive approach to the molecular pharmacology of cancer.Science
1997,275(5298):343-9.
20. Sturn A, Quackenbush J, Trajanoski Z:Genesis: cluster analysis of microarray data.Bioinformatics2002,18:207-8.
21. Kaufman L, Rousseeuw P:Finding Groups in Data: An Introduction to Cluster AnalysisLondon: John Wiley and Sons; 1990.
22. Reichman S, Kalathur RKR, Lambard S, Aït-Ali N, Yang Y, Lardenois A, Ripp R, Poch O, Zack DJ, Sahel J, Léveillard T:The homeobox gene CHX10/VSX2 regulates RdCVF promoter activity in the inner retina. Hum.Mol. Genet.
2010,19(2):250-61.
23. Sigulinsky CL, Green ES, Clark AM, Levine EM:Vsx2/Chx10 ensures the correct timing and magnitude of Hedgehog signaling in the mouse retina.Dev. Biol.2008,317(2):560-75.
doi:10.1186/1753-6561-5-S2-S3
Cite this article as:Ehleret al.:Nonlinear gene cluster analysis with labeling for microarray gene expression data in organ development. BMC Proceedings20115(Suppl 2):S3.
Submit your next manuscript to BioMed Central and take full advantage of:
• Convenient online submission
• Thorough peer review
• No space constraints or color figure charges
• Immediate publication on acceptance
• Inclusion in PubMed, CAS, Scopus and Google Scholar
• Research which is freely available for redistribution