Graph Analysis and
Applications in Clustering and
Content-based Image Retrieval
HONGLEI ZHANG
Tampere University Dissertations 101
HONGLEI ZHANG
Graph Analysis and
Applications in Clustering and
Content-based Image Retrieval
ACADEMIC DISSERTATION To be presented, with the permission of
the Faculty of Information Technology and Communication Sciences of Tampere University,
for public discussion in the Auditorium S3 of the Sähkötalo building, Korkeakoulunkatu 3, Tampere,
Finland
Responsible supervisor or/and Custos
Prof. Dr. Moncef Gabbouj Tampere University Finland
Supervisor Prof. Dr. Serkan Kiranyaz
Qatar University Qatar
Pre-examiners Prof. Dr. Hichem Frigui
University of Louisville USA
Prof. Dr. Amel Benazza-Benyahia University of Carthage
Tunisia
Opponents Prof. Dr. Mikko Kivelä
Aalto University Finland
The originality of this thesis has been checked using the Turnitin OriginalityCheck service.
Copyright ©2019 author Cover design: Roihu Inc.
ISBN 978-952-03-1183-4 (print) ISBN 978-952-03-1184-1 (pdf) ISSN 2489-9860 (print) ISSN 2490-0028 (pdf) http://urn.fi/URN:ISBN:978-952-03-1184-1 PunaMusta Oy – Yliopistopaino Tampere 2019
i
ABSTRACT
About 300 years ago, when studying Seven Bridges of Königsberg problem - a famous problem concerning paths on graphs - the great mathematician Leonhard Euler said, “This question is very banal, but seems to me worthy of attention”. Since then, graph theory and graph analysis have not only become one of the most important branches of mathematics, but have also found an enormous range of important applications in many other areas. A graph is a mathematical model that abstracts entities and the relationships between them as nodes and edges. Many types of interactions between the entities can be modeled by graphs, for example, social interactions between people, the communications between the entities in computer networks and relations between biological species. Although not appearing to be a graph, many other types of data can be converted into graphs by cer-tain operations, for example, the k-nearest neighborhood graph built from pixels in an image.
Cluster structure is a common phenomenon in many real-world graphs, for example, social networks. Finding the clusters in a large graph is important to understand the underlying relationships between the nodes. Graph clustering is a technique that partitions nodes into clus-ters such that connections among nodes in a cluster are dense and connections between nodes in different clusters are sparse. Various approaches have been proposed to solve graph clustering problems. A common approach is to optimize a predefined clustering metric using different optimization methods. However, most of these optimization problems are NP-hard due to the discrete set-up of the hard-clustering. These optimization problems can be relaxed, and a sub-optimal solu-tion can be found. A different approach is to apply data clustering algorithms in solving graph clustering problems. With this approach,
one must first find appropriate features for each node that represent the local structure of the graph. Limited Random Walk algorithm uses the random walk procedure to explore the graph and extracts ef-ficient features for the nodes. It incorporates the embarrassing parallel paradigm, thus, it can process large graph data efficiently using mod-ern high-performance computing facilities. This thesis gives the details of this algorithm and analyzes the stability issues of the algorithm. Based on the study of the cluster structures in a graph, we define the authenticity score of an edge as the difference between the actual and the expected number of edges that connect the two groups of the neighboring nodes of the two end nodes. Authenticity score can be used in many important applications, such as graph clustering, outlier detection, and graph data preprocessing. In particular, a data clus-tering algorithm that uses the authenticity scores on mutualk-nearest neighborhood graph achieves more reliable and superior performance comparing to other popular algorithms. This thesis also theoretically proves that this algorithm can asymptotically find the complete re-covery of the ground truth of the graphs that were generated by a stochasticr-block model.
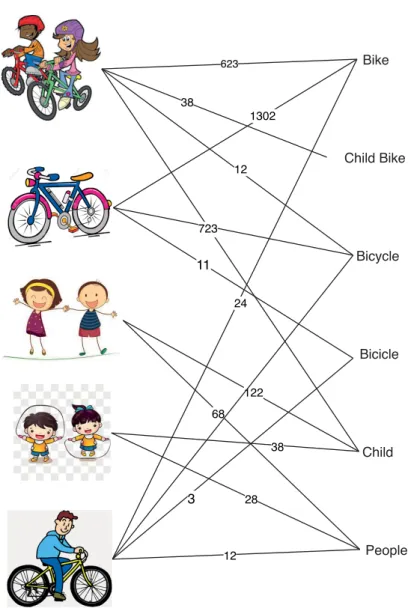
Content-based image retrieval (CBIR) is an important application in computer vision, media information retrieval, and data mining. Given a query image, a CBIR system ranks the images in a large image database by their “similarities” to the query image. However, because of the ambiguities of the definition of the “similarity”, it is very diffi-cult for a CBIR system to select the optimal feature set and ranking algorithm to satisfy the purpose of the query. Graph technologies have been used to improve the performance of CBIR systems in var-ious ways. In this thesis, a novel method is proposed to construct a visual-semantic graph—a graph where nodes represent semantic con-cepts and edges represent visual associations between concon-cepts. The
iii constructed visual-semantic graph not only helps the user to locate the target images quickly but also helps answer the questions related to the query image. Experiments show that the efforts of locating the target image are reduced by 25% with the help of visual-semantic graphs.
Graph analysis will continue to play an important role in future data analysis. In particular, the visual-semantic graph that captures impor-tant and interesting visual associations between the concepts is worthy of further attention.
v
PREFACE
Firstly, I would like to express my deep gratitude to my supervisor Prof. Dr. Moncef Gabbouj for his continuous support, his patience, encouragement, and guidance along the years of my study. Prof. Gab-bouj is not only a great supervisor but also a great person from whom I have learned so much. I have enjoyed every single moment work-ing with him. I would also like to thank Prof. Dr. Serkan Kiranyaz for his valuable guidance, encouragement and inspiration during my Ph.D. study.
My sincere thanks also give to the pre-examiners Prof. Dr. Amel Benazza-Benyahia and Prof. Dr. Hichem Frigui for their careful re-view of the draft of this thesis, the valuable comments, and insightful suggestions.
I would especially like to thank my dear colleagues Dr. Stefan Uhlmann, Dr. Jenni Raitoharju, Dr. Guanqun Cao, Dr. Kaveh Samiee, Dr. Iftikhar Mohamed, Mr. Waris Adeel Mohamad, Dr. Ezgi Ozan, Mr. Morteza Zabihi, Mr. Anton Murvev, Dr. Alexandros Iosifidis, Mr. Dat Tranthanh, Ms. Lei Xu, and Mr. Mohammad Fathi Al-Sa’d for great working atmosphere, generous help and excellent teamwork. I would always remember the moment we spend together and the cher-ished friendship you have given me. I would also like to thank other colleagues who are working or had been working in the MUVIS team for their great support and kind help.
I would also like to thank my beloved wife Dr. Jinghuan Wang and my son Yuhao Zhang for their support and incent towards my goal. I’d like to give special thanks to my father Shudong Zhang, my mother Xiulan Dong, my brother Hongsheng Zhang and my sister Hongbo
Zhang. They have helped me through my life and answered my re-quests whenever I needed them.
Last but not least I would like to thank D2I and CVDI projects for giv-ing financial support, CSC and TCSC for providgiv-ing computgiv-ing service to complete my research work.
Tampere, July 2019 Honglei Zhang
vii
CONTENTS
Abstract . . . i Preface . . . v List of Symbols . . . ix List of Abbreviations . . . xiList of Publications . . . xiii
Author’s Contribution . . . xv
1. Introduction . . . 1
1.1 Brief history of graph theory . . . 1
1.2 Introduction of graph analysis in machine learning . . 3
1.3 Objectives and thesis overview . . . 7
2. Graph Theory . . . 11
2.1 Basic concepts and graph representations . . . 11
2.2 Graph attributes and definitions . . . 12
2.3 Metrics . . . 14
2.4 Random graph generation models . . . 17
3. Graph Clustering and Graph-based Data Clustering . . . . 21
3.1 Graph clustering . . . 21
3.2 Evaluation of graph clustering algorithms . . . 22
3.4 Random walk-based graph clustering . . . 35
3.5 Graph-based data clustering . . . 45
3.6 Summary . . . 59
4. Content-based Image Retrieval with Graph Techniques . . 63
4.1 Introduction to content-based image retrieval . . . 63
4.2 Visual-semantic graph . . . 70
4.3 Using visual-semantic graph in CBIR systems . . . 81
4.4 Summary . . . 89
5. Conclusions . . . 93
Bibliography . . . 96
ix
LIST OF SYMBOLS
|S| cardinality of set S|x| absolute value of variable x
·1 L1 norm
∩ intersection of two sets ∪ union of two sets n
k
the number of k-combinations of a set of nelements
A adjacency matrix
A\B relative complement of set A inB A(eij) authenticity score of edge eij ab edge that connects nodes aandb a, b, c,· · · nodes in a graph
D degree matrix
Dout out-degree matrix
di the degree of node ni E the set of edges in a graph
E+ the set of edges that two ends nodes are in the same cluster
E− the complementary set of E+
E(·) the expected value of a random variable
eij edge that connects nodes iandj
G(V, E) graph Gwith the set of nodeV and the set of edge E H(X) entropy of random variable X
H(X|Y) conditional entropy of random variable X given random variable
Y
H(X, Y) joint entropy of random variables X andY
I(X, Y) mutual information of two random variables X and Y Kc complement of set K
ka the degree of node a L Laplacian matrix
ni node i
Na the neighboring nodes of node a
O(·) Big O notation indicates that a function is as the order of another function
P transition matrix of a Markov process
V the set of nodes in a graph
x(t) a vector of variables at time t x(∗) a fixed-point of variablex
π equilibrium state of a Markov process
xi
LIST OF ABBREVIATIONS
APL Average Path Length ARI Adjusted Rand Index BRkNN Binary Relevancek-NNCBIR Content-based Image Retrieval CNN Convolutional Neural Network
DBSCAN Density-based Spatial Clustering of Applications with Noise EBGM Elastic Bunch Graph Matching
gCBIR Graph-enhanced CBIR GDL Graph Degree Linkage GN Girvan Newman Algorithm HPC High-performance Computing ID Identification
IRD Inverse Relative Density KNN k-Nearest Neighbor
LDA Linear Discriminant Analysis LLE Local Linear Embedding LRW Limited Random Walk MCL Markov Cluster Algorithm
MCVS Microsoft Clickture-lite Visual Semantic MIR Mean Inverse Rank
MIT Massachusetts Institute of Technology MKNN Mutual k-Nearest Neighbor
MLkNN Multilabel k-NN N-Cut Normalized Cut
NMI Normalized Mutual Information PA Preference Attachment
PCA Principle Component Analysis
xiii
LIST OF PUBLICATIONS
[P1] Honglei Zhang, Jenni Raitoharju, Serkan Kiranyaz, and Moncef Gabbouj. Limited random walk algorithm for big graph data clustering. Journal of Big Data, 3(1):26, 2016.
[P2] Honglei Zhang, Serkan Kiranyaz, and Moncef Gabbouj. Outlier edge detection using random graph generation models and appli-cations. Journal of Big Data, 4(1):11, April 2017.
[P3] Honglei Zhang, Serkan Kiranyaz, and Moncef Gabbouj. A k-nearest neighbor multilabel ranking algorithm with application to content-based image retrieval. In 2017 IEEE International Conference on Acoustics, Speech, and Signal Processing, ICASSP
2017 - Proceedings, pages 2587–2591. IEEE, 2017.
[P4] Honglei Zhang, Serkan Kiranyaz, and Moncef Gabbouj. Data Clustering Based on Community Structure in Mutual k-Nearest Neighbor Graph. International Conference on
Telecommunica-tions and Signal Processing (TSP), 2018.
[P5] Honglei Zhang and Moncef Gabbouj. Feature Dimensionality Reduction with Graph Embedding and Generalized Hamming Distance. IEEE International Conference on Image Processing
xv
AUTHOR’S CONTRIBUTION
Publication [P1] presents the Limited Random Walk (LRW) graph clustering algorithm that achieves the state-of-the-art accuracy and can be implemented in an embarrassing parallel paradigm. Honglei Zhang conceived the idea, performed the implementation and compu-tation, and wrote the first draft of the manuscript.
Publication [P2] studies the authenticity of the edges in a graph and gives the definition of the authenticity score. It also shows various applications that benefit from the analysis of the authenticity scores. Honglei Zhang conceived the idea, developed the theorem and perform the experiments. Honglei Zhang wrote the manuscript in consultation with the co-authors.
Publication [P3] presents a multilabel ranking algorithm and its ap-plication in content-based image retrieval. The proposed algorithm is evaluated using a big image dataset and shows significant improve-ment compared to the other instance-based multilabel ranking algo-rithms. Honglei Zhang conceived the idea, perform the experiments and drafted the manuscript.
Publication [P4] extends the idea of data clustering using authenticity scores and presents a method to determine the number of clusters. Honglei Zhang conceived the idea, performed the experiments and drafted the manuscript.
Publication [P5] presents a dimensionality reduction method using graph embedding and generalized Hamming distance. The method uses information embedded in multilabel data and gives better per-formance compared to other competing methods. Honglei Zhang con-ceived the idea, perform the experiments and drafted the manuscript.
1
1.
INTRODUCTION
1.1 Brief history of graph theory
The study of graph theory dated back to Leonhard Euler in the six-teenth century when he studied the problem of the Seven Bridges of Königsberg—finding a route by which one can visit every part of the city and cross each of the seven bridges once and only once [1, 2]. Euler said [3]:
“This question is so banal, but seemed to me worthy of attention in that [neither] geometry, nor algebra, nor even the art of counting was sufficient to solve it.”
In the past hundreds of years, with the help of the great efforts by mathematicians and scientists in many fields, graph theory has not only become an important branch of mathematics but also a funda-mental tool in areas such as physics, biology, social science, and infor-mation technology [4, 5, 6, 7]. Besides the “Seven Bridges” problem, many other famous problems and conjectures, including the four color theorem [8] and traveling salesman problem [9], have greatly aroused the interests of scientists in graph theories and made graph theory one of the most active topics in mathematics [4, 5, 7]. One of the recent and important advances in graph theory is the random graph model, which is a combination of graph theory and probability theory [10]. A graph is a mathematical model that abstracts entities as vertices
Figure 1.1 A sketch of the Seven Bridges of Königsberg by Euler (E53 of MAA Eurler Archive [2])
(nodes) and their relations as edges (links). Graphs can be catego-rized in many different ways, such as directed and undirected graph, weighted and unweighted graph, finite and infinite graph [7]. Tree and forest can also be considered as special types of graphs.
Because of the huge volumes of data in various applications that can be modeled in a graph structure, graph analysis has become more and more important in fields other than mathematics. For example, in social science, the relationships between people form social networks where each vertex represents a person and each edge indicates the relationship between the two connected people [11, 12, 13]. Similarly, a transport system can be modeled as a graph where the vertices are the cities and the edges are the roads [14]. Even though the data being analyzed are not explicitly organized as graphs, very often they can be transformed, and the graph techniques can be used to analyze the data. For example, a metabolic system is a very complex system that is comprised of organs, hormones, and enzymes. This system can be represented by a directed bipartite graph where the vertices are reactions and the chemicals produced and/or consumed by reactions, and the directed edges indicate whether a metabolite is a substrate
1.2. Introduction of graph analysis in machine learning 3 (input) or a product (output) of a reaction [7]. The Reactome pathway knowledge base is a collection of relations between human proteins and reactions. The relations have been modeled as graphs for the public to discover information in gene expression pattern or somatic mutation from tumor cells [15].
1.2 Introduction of graph analysis in machine learning
The combination of graph analysis and machine learning is essential and beneficial since they both study the relations between given en-tities. For many applications, especially when the data is in a graph structure, it is sometimes difficult to separate the two methodologies. For example, graph clustering in graph analysis and data clustering in machine learning have a similar target. Techniques from one field were thus used to solve problems in the other field. In many real-world graphs, especially in social networks, the vertices form communities— the links among the vertices inside a community are much denser than the links connecting vertices in different communities [16]. Finding these communities is important to understand the underlying rela-tions among the vertices [P1, 17, 18, 19, 20, 21]. Graph clustering is a technique to find communities in big networks. Fig. 1.2 shows the graph of Zachary’s karate club, which was used in the earliest re-searches in this subject [22]. Each vertex represents a member of the club and the links indicate the members have interactions outside of the club. The club split into two groups due to the conflicts between the two administrators. The color of the vertices shows how the club was split at that time. Many graph clustering algorithms have been used to interpret and predict this split [P1, 18, 23]. Graph partition, which is closely related to graph clustering, aims to partition a big graph into smaller components of roughly equal sizes such that the links between any two partitions are minimized. Graph partition is crucial for processing and analyzing big graph data in a distributed
1 2 3 4 5 6 7 8 9 10 11 12 13 14 15 16 17 18 19 20 21 22 23 24 25 26 27 28 29 30 31 32 33 34
Figure 1.2 Graph of Zachary’s karate club [22]
system [24, 25, 26].
Data clustering is an important task use in many fields, such as ma-chine learning, pattern recognition, information retrieval [27]. Various methods that use graph clustering techniques have been proposed to solve the problem [28, 29, 30, 31]. Given the data samples, these al-gorithms first construct a k-nearest neighbor graph (KNN) or mutual
k-nearest neighbor graph (MKNN). Then graph clustering techniques can be applied to find the clusters in the constructed graph. In [P2], Zhang et al. proposed an approach to split the graph into compo-nents by iteratively removing the edges according to their authenticity scores. The number of clusters can be determined by analyzing the sizes or the properties of the components that are formed during the collapsing process.
Graph analysis has also found further use in an important machine learning problem, namely the embedding method for dimensionality reduction. Yan et al. unified different dimensionality reduction meth-ods, including Principle Component Analysis (PCA), Linear
Discrim-1.2. Introduction of graph analysis in machine learning 5 inant Analysis (LDA), Local Linear Embedding (LLE) and IsoMap, within a common framework called graph embedding [32]. An intrin-sic graph and a penalty graph are constructed from the data samples. The objective of the algorithms is to find lower dimension represen-tations of the data samples that preserve the relationships of the ver-tices in the intrinsic graph and the penalty graph. This framework has inspired many researchers to develop new dimensionality reduc-tion algorithms [33, 34, 35]. For example, Zhang et al. constructed an intrinsic graph using generalized Hamming distance as the weights to model the similarity of the labels in multi-label data analysis [P5]. Social networks are important graph structure because of their broad and important applications [36, 37, 38]. One of the most important applications is to find the strategy that maximizes the influence of an idea through social networks [39, 40]. Since a decision made by an individual is frequently affected by people connected to him/her, the effectiveness of propagating an idea through the social network is greatly affected by the strategy of selecting the target individuals. In-creasing the acceptance of those influential people may lead to faster and broader acceptance through the whole society. A related topic is to slow down or stop the propagation of a virus through a network, for example, an infectious disease among social networks or computer virus through computer networks [41, 42]. Node centrality [7] and other measurements [39, 40] have been used to evaluate the influential power of each individual. PageRank is a measurement that evaluates the importance of a web page according to its relations to other web pages in the web graph—a graph whose nodes are web pages and edges are the hyperlinks between the pages [43]. Ranking entities according to certain criteria is what learning to rank, another important ap-plication in machine learning [44], deals with. PageRank and other graph-based features have proved to be effective for this application [45].
Graph techniques have also been extensively used in computer vision tasks [46]. Wiskott et al. developed an elastic bunch graph match-ing (EBGM) algorithm to recognize human faces [47]. First, feature vectors of fiducial points (eyes, mouth, etc) are extracted using Gabor filters. Then the bunch graph is constructed from these fiducial points and a face is recognized using a similarity function that combines the similarity of the fiducial points and the distortion of the image grid in the graph. Dealing with the image segmentation problem, Boykov et al. used graph cuts to minimize the energy function defined for a segmentation, where the graph is constructed from the pixel lattice of an image with the addition of two terminal nodes [48]. To estimate human pose in an image that contains multiple people, Cao et. al. ap-plied graph matching technique for part association [49]. Zhang and Shah modeled the human parts by a relational graph and a hypothe-sis graph and used a tree-based optimization method to estimate the human pose from a sequence of the frames in a video [50].
Content-based image retrieval (CBIR) system helps users to efficiently retrieve information from a large image dataset based on the content of query images [51, 52]. It is another important application in machine learning and computer vision [53]. Graph techniques have also shown great importance in CBIR systems. Cai et. al. constructed image graph based on the hyperlinks between the web pages on the Internet and proposed to represent an image by its visual feature, textual fea-ture and graph-based feafea-ture [54]. Using these three representations, images retrieved from a search engine can be clustered into semantic clusters and presented to the users for better clarity, simplicity, and consistency. Graph-ranking model, for example, the aforementioned PageRank, decides the importance of a vertex according to the graph structure [55]. Xu developed a graph-based ranking model called Effi-cient Manifold Ranking that can effiEffi-ciently construct the image graph and compute the ranking scores for a CBIR system [56].
1.2. Introduction of graph analysis in machine learning 7 Deep neural networks have undoubtedly gained the most attention in the area of machine learning for the last couple of years [57, 58]. An artificial neural network can be modeled by a directed graph where each node represent an artificial neuron and each edge indicates the connection from the output of a neuron to the input of another neu-ron [59]. Graph-based methods are used to study linearly separable Boolean functions, which an important problem in the research of neu-ral networks [60, 61]. Another important combination of graph theory and neural networks is to apply neural networks, in particular, con-volutional neural networks, on the data that are represented in graph structures. Kipf and Welling proposed a graph-based semi-supervised classification method to classify the node in a graph where only a small subset of nodes are annotated [62]. To execute convolution operations on a graph, Niepert et. al. construct a node sequence via a graph la-beling procedure and a graph normalization that imposes an order of the neighborhood graph [63]. The proposed method can be used in the graph classification problem where each graph structure is assigned to a label. Zhang et. al. applied an evolutionary method to find efficient graph structures of deep convolutional networks for image classifica-tion problems. The top-performing graph structures found during the evolution show some properties of the graph structure that greatly affect the performance of a deep convolutional neural network (CNN) [64].
The combination of graph-based techniques and machine learning is far beyond what has been discussed above. Graph theory has gained great attention from the researchers in machine learning and becomes a fundamental mathematical tool in this field.
1.3 Objectives and thesis overview
During the last decades, with the rapid development of the Internet and computer technologies, the size of data to be processed has in-creased dramatically. For example, a visual-semantic graph build for a CBIR application may contain millions of nodes and tens of millions of edges. New algorithms are required to tackle the difficulties caused by the large graph data to efficiently use graph techniques in different applications.
The objectives of this thesis are to develop a novel mathematical for-mulation for graph clustering, graph analytics, and graph-based data clustering for large graph data and use these formulations to improve graph-based CBIR system’s efficiency compared to traditional CBIR approaches. The main research questions the thesis aims to answer are: what new insights graph-based approaches can provide us when dealing with large-scale datasets when the latter are represented by graphs? how can graph analytics solve image content-based indexing and retrieval in large-scale databases?
The 5 publications included in this thesis answer these research ques-tions from different direcques-tions. Publication [P1] answers the research questions by presenting an efficient graph clustering algorithm, named the Limited Random Walk algorithm, for large graph data that achieves the state-of-the-art accuracy and can be implemented in an embarrass-ing parallel manner. Publication [P2] studies the authenticity of edges in a graph and shows various applications that benefit from this anal-ysis, in particular when dealing with large-scale graphs. Publication [P4] extends the idea of [P2] and presents a method to cluster data using graph techniques. Publication [P3] and [P5] answer the research question by presenting a multilabel ranking algorithm and a dimen-sionality reduction method that are based on graph techniques and serve as critical enablers for content-based image retrieval in
large-1.3. Objectives and thesis overview 9 scale databases.
The rest of the thesis is organized as follows:
Chapter 2 gives a brief introduction of some basic concepts and defini-tions used in graph theory. Some attributes and properties for nodes and edges are also described in this chapter. Metrics that evaluate density, centrality, and authenticity are discussed. The last section of this chapter describes some important random graph generation models that are used in the remaining chapters.
Chapter 3 describes some important algorithms for graph clustering and graph-based data clustering problems. It first explains differ-ent types of graph clustering problems and some metrics to evaluate, either externally or internally, the performance of graph clustering algorithms. Then an overview of spectral graph clustering, fitness function optimization, data-based, and model-based clustering tech-niques are given. This chapter gives a detailed explanation of random walk-based clustering algorithms. The stability and complexity of the limited random walk algorithm are discussed. Next, the data cluster-ing algorithms that use graph analysis techniques are described. This chapter also gives a detailed discussion about the data clustering algo-rithm that is based on the authenticity scores of the edges in a mutual
k-nearest neighbor graph. The sufficient condition that guarantees the complete recovery of the ground truth is proved.
Chapter 4 discusses the benefits of using graph techniques in the area of CBIR. It first describes some challenges that a general CBIR system faces, for example, the difficulty of annotating a large dataset, and the ambiguity of the intention of a query. Then the system architecture of a CBIR system is briefly described. To capture the visual relations of semantic concepts, this chapter shows a method to construct a visual-semantic graph from a large database of clickture data. Later, a
graph-enhanced CBIR (gCBIR) system is described and the performance is compared to the tradition CBIR systems.
Finally, the conclusion of the thesis and the expected directions of future research about graph and data clustering, as well as gCBIR systems are discussed in Chapter 5.
11
2.
GRAPH THEORY
2.1 Basic concepts and graph representations
A graph is a data structure that represents the relationship between objects. Let G(V, E) be a graph, where V is the set of nodes and E
is the set of edges. Letni ∈V be the a node andeij ∈E be the edge that connects nodesniandnj, wherei, j = 1,2,· · ·, N. For simplicity, we also use italic letters to denote nodes and an overline above two italic letters to denote the edge that connects the two end nodes. For example, arepresents node a and abis the edge that connects nodes
a and b. Note that parallel edges—edges that have the same end nodes—are not allowed in our definition.
Depending on the data, graphs can be categorized in different ways. If each edge is associated with a weight, the graph is a weighted graph. The weights can be either integer or real numbers. If each edge is associated with a direction, the graph is a directed graph. A bipar-tite graph is a graph that contains two disconnected sets of nodes. For example, the relationship between customers and products can be rep-resented by a bipartite graph that contains the nodes of customers and the nodes of products. An edge links a customer node and a product node if the customer purchased the product. Trees and forests can also be considered a type of graph—a graph without cycles. A hypergraph is a generalization of the graph, where an edge may link two sets of nodes. Unless otherwise stated, a graph refers to an undirected and
unweighted graph in this thesis.
A graph is normally represented by its adjacency matrix. The columns and the rows represent the nodes in a graph. The elements in the adjacency matrix indicate whether the two nodes are connected by an edge. For a weighted graph, the value of the elements indicate the weights of the edges. Other than the adjacency matrix, edge list (or adjacency list) is also used to represent a graph. Each row in an edge list is a pair of nodes that are connected by an edge. For a weighted graph, the weights of the edges are shown in the third column. Fig. 2.1 shows a graph, the adjacency matrix representation, and the edge list representation. The adjacency matrix is used in graph analysis because of the mathematical advances in matrix analysis. While the edge list is more suitable for storage for its compact form.
⎡ ⎢ ⎢ ⎢ ⎢ ⎢ ⎢ ⎣ 0 1 1 0 1 0 1 0 1 0 0 0 1 1 0 1 0 1 0 0 1 0 0 1 1 0 0 0 0 1 0 0 1 1 1 0 ⎤ ⎥ ⎥ ⎥ ⎥ ⎥ ⎥ ⎦ 1 2 1 3 1 5 2 3 3 4 3 6 4 6 5 6 (a) (b) (c)
Figure 2.1 A unidrected graph (a), its adjacency matrix (b) and edge list (c) representations
2.2 Graph attributes and definitions
In this section, some basic definitions and attributes that are used in this thesis are explained.
The degree of a node is defined as the number of edges that are con-nected to the node. Given the adjacency matrixA, the degree of node
2.2. Graph attributes and definitions 13 ni can be calculated by di= N j=1 Aij. (2.1)
For a directed graph, in-degree and out-degree are defined as the num-ber of edges that point to the node or leave from the node. Eq. 2.1 can be generalized to define the weighted degree of a node in a weighted graph. Weighted in-degree and weighted out-degree can be defined in a similar way.
Walk, trial and path are useful terms when studying the movement of an agent or the distance between the nodes in a graph. A walk is a sequence of nodes where the adjacent nodes in the sequence must be connected by an edge. A walk can be considered as the record of the visited nodes and edges when an agent travels on the graph. A trial is a walk without duplicate edges. A path is a trial without duplicate nodes. The length of a path is the number of edges in a path. The distance of two nodes is defined as the length of the shortest path that connects the two nodes.
A connected graph is a graph that any pair of nodes in the graph is connected by at least one path. A subgraph of graph G(V, E) is a graph in which the set of nodes and the set of edges are subsets of
V and E respectively. An induced graph of G(V, E) is a subgraph of G(V, E) that contain all the edges inE that link the nodes in the induced graph. A component of graphG(V, E)is a connected induced graph ofG(V, E), and there is no edge inE that connects a node in the component to a node that is not in the component. The concept of the component is mainly used to analyze a disconnected graph since a connected graph has one component, which is the graph itself. Ego-graph of a node is the induced graph that contains the node and
its neighboring nodes. Edge-ego-graph is the induced graph of the two end nodes of an edge and all the neighboring nodes of these two end nodes.
The Laplacian matrix of graphG is defined as
L=D−A, (2.2)
where D is the degree matrix which is a diagonal matrix and the diagonal elements of this matrix are the degrees of the nodes as defined in Eq. 2.1, and A is the adjacency matrix. Laplacian matrix is a representation of a graph that has been extensively used in graph analysis, especially spectral graph theory and graph clustering [65].
2.3 Metrics
A number of attributes and metrics have been defined to describe or evaluate the properties of a graph.
The density of a graph is defined as
density (G) = |E|
|V|(|V| −1). (2.3) The diameter of a graph is the longest distance of any pair of nodes in a graph. Note that the diameter of a disconnected graph can be undefined or defined as infinite.
The connectivity of a graph determines the efficiency of information diffusion on a graph. The algebraic connectivity of a graph is defined as the second smallest eigenvalue of its Laplacian matrix, whose smallest eigenvalue being zero [66]. The larger the algebraic connectivity is, the better a graph is connected. If the graph is not connected, the
2.3. Metrics 15 value of its algebraic connectivity is zero.
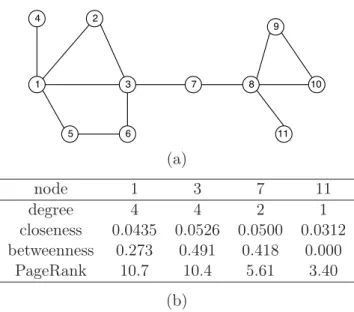
Clustering or community structure is a very common phenomenon in social networks [16, 67, 68]. As often seen in daily life, a group of closely related people is likely to be mutual friends. Similarly, for many types of graphs, the connections among the nodes in a cluster are much denser than the connections between nodes in different clusters. When the role of a node is studied, its centrality is an important prop-erty [69]. A node with a larger centrality value plays a more important role when information flows on the graph. A simple measurement of the node centrality is to use its degree. However, a node with a large degree value is not necessarily a critical node. For example, node 7 in graph (a) in Fig. 2.2 has a low degree, but all information flows between the left and right side of the graph has to pass through it. For this reason, other centrality metrics have been introduced. Closeness centrality is defined as the average shortest path length of a node to other nodes in the graph. Betweenness centrality of a node is defined as the number of times that the shortest path of any pair of nodes passes through the node. Another important measurement is PageR-ank centrality. PageRPageR-ank centrality of a node in a directed graph is defined as xi=α j∈Nin(i) Aij xj kout j +1−α N , (2.4)
wherexiandxjare the PageRank value of nodesiandj,respectively,Nin(i) is the set of nodes that connect to node i by a outgoing edge, kjout is the out-degree of nodej,N is the number of nodes, andα is a damp-ing factor that controls the scope of neighbordamp-ing nodes that contribute to the PageRank value. Eq. 2.4 has the analytical solution as follows:
wherex = [x1, x2,· · · , xN]T is the vector of PageRank values of each node, Dout is a diagonal matrix of out-degrees. If the graph is an undirected graph and the damping factor α is set to1, the PageRank measurement is simply the degree centrality [7].
Fig. 2.2 shows a graph and the centrality measurement of some nodes. Notice that the PageRank centrality is roughly proportional of the degree centrality on an undirected graph [70].
(a) node 1 3 7 11 degree 4 4 2 1 closeness 0.0435 0.0526 0.0500 0.0312 betweenness 0.273 0.491 0.418 0.000 PageRank 10.7 10.4 5.61 3.40 (b)
Figure 2.2 A graph and the centrality measurements of some nodes. The PageRank values are calculated with a damping factorα= 0.85.
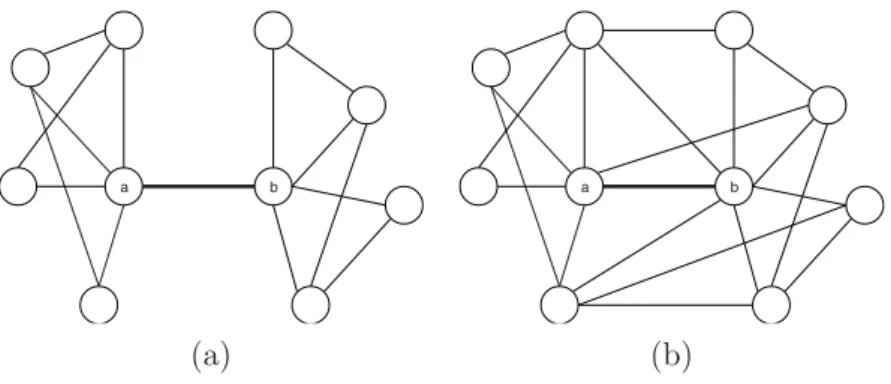
The centrality of the nodes is another important property that has been extensively studied. However, there have been very limited stud-ies on the centrality or other measurements for edges [71]. Some cen-trality measurements for nodes can be applied to edges. For example, the betweenness centrality of an edge is defined in the same way as the betweenness centrality of nodes. Meo et. al. [72] defined k-path
2.4. Random graph generation models 17 centrality for node as
Ck(ni) = s∈V σks(ni) σk s , (2.6)
whereσks(ni)is the number ofk-paths (a path of length k) originating from nodesand passing through node ni, and σks is the total number of k-paths originating from node s. k-path centrality of an edge is defined by replacing the node with an edge in the previous definition. Corresponding to the degree centrality of a node, the degree product of an edge—the product of the degrees of the two end nodes of the edge—is used as a centrality measurement for edges.
Authenticity measures whether an edge follows the clustering proper-ties in a graph or not. Zhang et. al. [P2] defined the authenticity score as
aeij =meij−eeij, (2.7) wheremeij is the actual number of edges that connect the two groups of the neighboring nodes of the two end nodes of edge eij, and eeij
is the expected number of edges between these two groups of nodes. Edge authenticity can be used for graph clustering, outlier detection, and graph data preprocessing [P2, P4].
2.4 Random graph generation models
Random graph generation model has been an important research topic for the last several decades [73]. Numerous models have been proposed to generate graphs by stochastic processes to simulate or mimic real-world graphs. The most important aspect of a good random graph generation model is that the generated graphs show similar properties as those real-world graphs. This section will not give a thorough review of these models. Instead, we will only discuss some graph generation
models that have a huge impact on the research in this field and the models that are used in other sections of this thesis.
Erdős–Rényi model is the first random graph generation model and the most well-studied one [10]. A commonly used Erdős–Rényi model is G(n, p) model where a graph of nnodes is generated by randomly connecting two nodes by an edge with probability p. Many impor-tant properties have been found about the graphs generated by the Erdős–Rényi model. For example, ln(nn) is the sharp threshold of the connectedness of graph G(n, p). If p > ln(nn), G(n, p) is almost sure to be connected. Otherwise, it is almost surely to be disconnected. However, random graphs generated by the Erdős–Rényi model lack many important properties that a real-world graph has. One signifi-cant shortcoming is that the generated graphs do not show clustering structure. Another important defect is that the degree distribution of the nodes is binomial, whereas the degree distribution of real-world graphs often follows the power law [74]. To overcome these short-comings, many other random graph generation models have been pro-posed.
Preferential attachment, also named as “the rich get richer” or “cumu-lative advantage”, is a principle that an entity gets more of a certain asset if it has already possessed more of this asset. Barabási and Al-bert applied this principle to the random graph growth process in their model [75, 76]. The generation process starts from a single node and the nodes are added one by one. Every time a node is added, the probability that the new node is connected to nodeni is proportional to the degree of node ni. The degree distribution of the graph gener-ated by the Barabási–Albert model follows the power law in the form of p(k) = k−3. The Barabási–Albert model is a very simple process that whenever a node is added to the graph, edges can only be added to connect the newly added node. Also, whenever an edge is added,
2.4. Random graph generation models 19 it can not be removed from the graph anymore. This is obviously not the case in many real-world graphs such as social network or web page graphs. Many extensions have been proposed to address these limitations [77, 78].
Small-world is another interesting property that many real-world graphs have [38, 79]. Small-world means that the average distance between any pair of nodes in a graph is limited by a small number. It is also known as “six degrees of separation” for social networks. A small-world graph is a graph where the average path length (APL) of any pair of nodes is proportional to log(N). APL of a graph generated by the Erdős–Rényi model follows AP LER ∝ log(log(Nk)), where k is the average number degree. APL of a graph generated by the Barabási–Albert model follows AP LBA ∝ log log(log(NN)) [79, 80, 81]. Watts and Strogatz proposed a model that generate graphs with not only the small-world property but also a constant clustering coefficient. With the Watts-Strogatz model, a ring type of lattice graph is first constructed. Then a process, similar to the Erdős–Rényi model, is applied to randomly rewire the edges with a certain probability.
Stochastic block model aims at generating graphs with another im-portant property of real-world graphs: clustering. With this model, nodes are first divided into r groups. Then ar×r probability matrix
P is defined such that the element Pij defines the probability of an edge is generated to connect nodes between groupiandj. This model can be viewed as a generalization of the Erdős–Rényi model where all elements in matrix P are identical.
Fig. 2.3 shows the samples of random graphs generated by different random graph generation models.
(a) Erdős–Rényi model (b) Barabási–Albert model
(c) Watts-Strogatz model (d) Stochastic block model
21
3.
GRAPH CLUSTERING AND
GRAPH-BASED DATA CLUSTERING
3.1 Graph clustering
Most graph data, especially graphs of social networks, are heterogeneous— the graph contains communities such that the density of edges in a community is much higher than the overall density of the whole graph [12, 18, 82, 83, 84]. Finding these communities is not only important to understand the underlying relationship between nodes, but also ben-eficial to computation and storage. Graph clustering is a technique to organize nodes into clusters such that the densely connected nodes are assigned to the same cluster and the connections between different clusters are sparse.
Graph clustering is a general term for many related techniques. Graph partition is a technique that divides nodes into a number of compo-nents such that the compocompo-nents are balanced—each component con-tains roughly the same number of nodes [24, 85, 86]. Graph partition becomes important in a distributed system when the graph data is too big to fit into the resource of a single computing unit. In this situa-tion, the big graph data will be partitioned into a certain number of components and each component is processed separately by a single unit. To minimize the communication cost between different units, the links between the components must be minimized [87, 88].
If each node belongs to only one cluster, this type of clustering is called hard clustering. There are also situations when one node may belong to more than one cluster, this clustering technique is called soft clustering (also referred to as fuzzy clustering) [89]. Graph partition is normally hard clustering. Sometimes, some nodes may not belong to any cluster, this technique is called graph clustering with outlier detection. The nodes that are not associated with any cluster are recognized as outliers. Within the scope of this thesis, we only discuss the techniques related to hard clustering.
In many applications, it is not necessary to cluster the whole graph, or it is impractical to cluster the whole graph due to its size. Instead, we may be only interested in finding the cluster that contains a certain node. This technique is called local graph clustering (or community detection in some literature) [90, 91, 92, 93, 94].
The next section will discuss how to evaluate the performance of graph clustering algorithms and later show how the techniques are used in graph clustering.
3.2 Evaluation of graph clustering algorithms
It is a challenging task to evaluate the performance of different graph clustering algorithms [95, 96, 97]. The definition of the cluster struc-ture in a graph is heuristic and many different mathematical models have been developed and applied. Depending on the actual appli-cation, one has to choose suitable models that match the expected cluster structure. We can use two types of methods to evaluate graph clustering algorithms depending on whether or not the ground truth data is available: external evaluation and internal evaluation.
3.2. Evaluation of graph clustering algorithms 23
3.2.1 External evaluation
For some applications, clusters in the graph may be known from other sources [98]. For example, the graph structure of a synthetic graph is known if the graph is generated by a predefined clustering generation model, such as a stochastic block model (see Section 2.4) or caveman graph model [99]. For a real-world graph, the graph structure may be annotated by human experts or the structure is revealed by other hints. For example, it is well known that the clustering structure of Zachary’s karate club graph (as described in Section 1.2) is the same as how the club was split. The social network service website Facebook encourages its users to organize their friends into “circles”. Ego-Facebook is the graph data that were collected from the circles of 10 Facebook end users. The 10 clusters as the data were collected are used as the ground truth of this graph data. Fig 3.1 shows the ground truth of ego-Facebook graph.
When the ground truth data is available, clustering results can be evaluated using external evaluation methods. The external evaluation compares the partition of the nodes given by the clustering algorithms to the partition in the ground truth. Let X = {X1, X2,· · ·, Xr} be the partition of the nodes given by a clustering algorithm, whereXi is the set of the nodes in clusteri, andr is the number of clusters. Each node ni ∈ G(V, E) belongs to one of the partitions in X. Similarly, let Y = {Y1, Y2,· · ·, Ys} be the partition of the nodes in the ground
truth and s is the number of clusters. The performance of a graph clustering algorithm can be evaluated by the following metrics.
• Rand index
Rand index uses pairs of nodes to evaluate partition X and the ground truth Y [100]. For every pair of nodes in V, if
1 2 3 4 5 6 7 8 9 10 11 12 13 14 15 16 17 18 19 20 21 22 23 24 25 26 27 28 29 30 31 32 33 34 35 36 37 38 39 40 41 42 43 44 45 46 47 48 49 50 51 52 53 54 55 56 57 58 59 60 61 62 63 64 65 66 67 68 69 70 71 72 73 74 75 76 77 78 79 80 81 82 83 8685 84 87 88 89 90 91 92 93 94 95 96 97 98 99 100 101 102 103 104 105 106 107 108 109 110 111 112 113 114 115 116 117 118 119 120 121 122 123 124 125 126 127 128 129 130 131 132 133 134 135 136 137 138 139 140 141 142 143 144 145 146 147 148 149 150 151 152 153 154 155 156 157 158 159 160 161 162 163 164 165 166 167 168 169 170 171 172 173 174 175 176 177 178 179 180 181 182 183 184 185 186 187 188 189 190 191 192 193 194 195 196 197 198 199 200 201 202 203 204 205 206 207 208 209 210 211 212 213 214 215 216 217 218 219 220 221 222 223 224 225 226 227 228 229 230 231 232 233 234 235 236 237 238 239 240 241 242 243 244 245 246 247 248 249 250 251 252 253 254 255 256 257 258 259 260 261 262 263 264 265 266 267 268 269 270 271 272 273 274 275 276 277 278 279 280 281 282 283 284 285 286 287 288 289 290 291 292 293 294 295 296 297 298 299 300 301 302 303 304 305 306 307 308 309 310 311 312 313 314 315 316 317 318 319 320 321 322 323 324 325 326 327 328 329 330 331 332 333 334 335 336 337 338 339 340341 342 343 344 345 346 347 348 349 350 351 352 353 354 355356 357 358 359 360 361 362 363 364 365 366 367 368 369 370 371 372 373 374 375 376 377 378 379 380 381 382 383 384 385 386 387 388 389 390 391 392 393 394 395 396 397 398 399 400 401 402 403 404 405 406 407 408 409 410 411 412 413 414 415 416 417 418 419 420 421 422 423 424 425 426 427 428 429 430 431 432 433 434 435 436 437 438 439 440 441 442 443 444 445 446 447 448 449 450 451 452 453 454 455 456 457 458 459 460 461 462 463 464 465 466 467 468 469 470 471 472 473 474 475 476 477 478 479 480 481 482 483 484 485 486 487 488 489 490 491 492 493 494 495 496 497 498 499 500 501 502 503 504 505 506 507 508 509 510 511 512 513 514 515516 517 518 519 520 521 522 523 524 525 526 527 528 529 530 531 532 533 534 535 536 537 538 539 540 541 542 543 544 545 546 547 548 549 550 551 552 553 554 555 556 557 558559 560 561 562 563 564 565 566 567 568 569 570 571 572 573 574 575 576 577 578 579 580 581 582 583 584 585 586 587 588 589590 591 592 593 594 595 596 597 598 599 600601 602 603 604 605 606 607 608 609 610 611 612 613 614 615 616 617 618 619 620 621 622 623 624 625 626 627 628 629 630 631 632 633 634 635 636 637 638 639 640 641 642 643 644 645 646 647 648 649 650 651 652 653 654 655 656 657 658 659660 661 662663 664 665 666 667 668 669 670 671 672 673 674 675 676 677 678 679 680 681 682 683 684 685 686 687 688 689 690 691 692 693 694 695 696 697 698 699 700 701 702 703 704 705 706 707 708 709 710 711 712 713 714 715 716 717 718 719 720 721 722 723 724 725 726 727 728 729 730 731 732 733 734 735 736 737 738 739 740 741 742 743 744 745 746 747 748 749 750 751 752 753 754 755 756 757 758 759 760 761 762 763 764 765 766 767 768 769 770 771 772 773 774 775 776 777 778 779 780 781 782 783 784 785 786 787 788 789 790 791 792 793 794 795 796 797 798 799 800 801 802 803 804 805 806 807 808 809 810 811 812 813 814 815816 817 818 819 820 821 822 823 824 825 826 827 828 829 830 831 832 833 834 835 836 837 838839 840 841 842 843 844 845846 847 848 849 850 851852 853 854 855 856 857 858 859 860 861 862 863 864 865 866 867 868 869 870 871 872 873874 875 876 877 878 879 880 881 882 883 884 885 886 887 888 889 890 891 892 893 894 895 896 897 898 899 900 901 902 903 904 905 906 907 908 909 910 911 912 913 914 915 916 917 918 919 920 921 922 923 924 925 926 927 928 929 930 931 932 933 934 935 936 937 938 939 940 941 942 943 944 945 946 947 948 949 950 951 952 953 954 955 956 957 958 959 960 961 962 963 964 965 966 967 968 969 970 971 972 973 974 975 976 977 978 979 980 981 982 983 984 985 986 987 988 989 990 991 992 993 994 995 996 997 998 999 1000 1001 1002 1003 1004 1005 1006 1007 1008 1009 1010 10111012 1013 1014 1015 1016 1017 1018 1019 1020 1021 1022 1023 1024 1025 1026 1027 1028 1029 1030 1031 1032 1033 1034 1035 1036 1037 1038 1039 1040 1041 1042 1043 1044 1045 1046 1047 1048 1049 1050 1051 1052 1053 1054 1055 1056 1057 1058 1059 1060 1061 1062 1063 1064 1065 1066 1067 1068 1069 1070 1071 1072 1073 1074 1075 1076 1077 1078 1079 1080 1081 1082 1083 1084 1085 1086 1087 1088 1089 1090 1091 1092 1093 1094 1095 1096 1097 1098 1099 1100 1101 1102 1103 1104 1105 1106 1107 1108 1109 1110 1111 1112 1113 1114 1115 1116 1117 1118 1119 1120 1121 1122 1123 1124 1125 1127 1126 1128 1129 1130 1131 1132 1133 1134 1135 1136 1137 1138 1139 1140 1141 1142 1143 1144 1145 1146 1147 1148 1149 1150 1151 1152 1153 1154 1155 1156 1157 1158 1159 1160 1161 1162 1163 1164 1165 1166 1167 1168 1169 1170 1171 1172 1173 1174 1175 1176 1177 1178 1179 1180 1181 1182 1183 1184 1185 1186 1187 1188 1189 1190 1191 1192 1193 1194 1195 1196 1197 1198 1199 1200 1201 1202 1203 1204 1205 1206 1207 1208 1209 1210 1211 1212 1213 1214 1215 1216 1217 1218 1219 1220 1221 1222 1223 1224 1225 1226 1227 1228 1229 1230 1231 1232 1233 1234 1235 1236 1237 1238 1239 1240 1241 1242 1243 1244 1245 1246 1247 1248 1249 1250 1251 1252 1253 1254 1255 1256 1257 1258 1259 1260 1261 1262 1263 12641265 1266 1267 1268 1269 1270 1271 1272 1273 1274 1275 1276 1277 1278 1279 1280 1281 1282 1283 1284 1285 1286 1287 1288 1289 1290 1291 1292 1293 1294 1295 1296 1297 1298 1299 1300 1301 1302 1303 1304 1305 1306 1307 1308 1309 1310 1311 1312 1313 1314 1315 1316 1317 1318 1319 1320 1321 1322 1323 1324 1325 1326 1327 1328 1329 1330 1331 1332 1333 1334 1335 1336 1337 1338 1339 1340 1341 1342 1343 1344 1345 1346 1347 1348 1349 1350 1351 1352 1353 1354 1355 1356 1357 1358 1359 1360 1361 1362 1363 1364 1365 1366 1367 1368 1369 1370 1371 1372 1373 1374 1375 1376 1377 1378 1379 1380 1381 1382 1383 1384 1385 1386 1387 1388 1389 1390 1391 1392 1393 1394 1395 1396 1397 1398 1399 1400 1401 1402 1403 1404 1405 1406 1407 1408 1409 1410 1411 1412 1413 1414 1415 1416 1417 1418 1419 1420 1421 1422 1423 1424 1425 1426 1427 1428 1429 1430 1431 1432 1433 1434 1435 1436 1437 1438 1439 1440 1441 1442 1443 1444 1445 1446 1447 1448 1449 1450 1451 1452 1453 1454 1455 1456 1457 1458 1459 1460 1461 1462 1463 1464 1465 1466 1467 1468 1469 1470 1471 1472 1473 1474 1475 1476 14771478 1479 1480 1481 1482 1483 1484 1485 1486 1487 1488 1489 1490 1491 1492 1493 1494 1495 1496 1497 1498 1499 1500 1501 1502 1503 1504 1505 1506 1507 1508 1509 1510 1511 1512 1513 1514 1515 1516 1517 1518 1519 1520 1521 1522 1523 1524 1525 1526 1527 1528 1529 1530 1531 1532 1533 1534 1535 1536 1537 1538 1539 1540 1541 1542 1543 1544 1545 1546 1547 1548 1549 1550 1551 1552 1553 1554 1555 1556 1557 1558 1559 1560 1561 1562 1563 1564 1565 1566 1567 1568 1569 1570 15711572 1573 1574 1575 1576 1577 1578 1579 1580 1581 1582 1583 1584 1585 1586 1587 1588 1589 1590 1591 1592 1593 1594 1595 1596 1597 1598 1599 1600 1601 1602 1603 1604 1605 1606 1607 1608 1609 1610 1611 1612 1613 1614 1615 1616 1617 1618 1619 1620 1621 1622 1623 1624 1625 1626 1627 1628 1629 1630 1631 1632 1633 1634 1635 1636 1637 1638 1639 1640 1641 1642 1643 1644 1645 1646 1647 1648 1649 1650 1651 1652 16531654 1655 1656 1657 1658 1659 1660 1661 1662 1663 1664 1665 1666 1667 1668 1669 1670 1671 1672 1673 1674 1675 1676 1677 1678 1679 1680 1681 1682 1683 1684 1685 1686 1687 1688 1689 1690 1691 1692 1693 1694 1695 1696 1697 1698 1699 1700 1701 1702 1703 1704 1705 1706 1707 1708 1709 1710 1711 1712 1713 1714 1715 1716 1717 1718 1719 1720 1721 1722 1723 1724 1725 1726 1727 1728 1729 1730 1731 1732 1733 1734 1735 1736 1737 1738 1739 1740 1741 1742 1743 1744 1745 1746 1747 1748 1749 1750 1751 1752 1753 1754 1755 1756 1757 1758 1759 1760 1761 1762 1763 1764 1765 1766 1767 1768 1769 1770 1771 1772 1773 1774 1775 1776 1777 1778 1779 1780 1781 1782 1783 1784 1785 1786 1787 1788 1789 1790 1791 1792 1793 1794 1795 1796 1797 1798 1799 1800 1801 1802 1803 1804 1805 1806 1807 1808 1809 1810 1811 1812 1813 1814 1815 1816 1817 1818 1819 1820 1821 1822 1823 1824 1825 1826 1827 1828 1829 1830 1831 1832 1833 1834 1835 1836 1837 1838 1839 1840 1841 1842 1843 1844 1845 1846 1847 1848 1849 1850 1851 1852 1853 1854 1855 1856 1857 1858 1859 1860 1861 1862 1863 1864 1865 1866 1867 1868 1869 1870 1871 1872 1873 1874 1875 1876 1877 1878 1879 1880 1881 1882 1883 1884 1885 1886 1887 1888 1889 1890 1891 1892 1893 1894 1895 1896 18971898 1899 1900 1901 1902 1903 1904 1905 1906 1907 1908 1909 1910 1911 1912 1913 1914 1915 1916 1917 1918 1919 1920 1921 1922 1923 1924 1925 1926 1927 1928 1929 1930 1931 1932 1933 19341935 1936 1937 1938 1939 1940 1941 1942 1943 1944 1945 1946 1947 1948 1949 1950 1951 1952 1953 1954 1955 1956 1957 19581959 1960 1961 1962 1963 1964 1965 1966 1967 1968 1969 1970 1971 1972 1973 1974 1975 1976 1977 1978 1979 1980 1981 1982 1983 1984 1985 1986 1987 1988 1989 1990 1991 1992 1993 1994 1995 1996 1997 1998 1999 2000 2001 2002 2003 2004 2005 2006 2007 2008 2009 2010 2011 20122013 2014 2015 2016 2017 2018 2019 2020 2021 2022 2023 2024 2025 2026 2027 2028 2029 2030 2031 2032 2033 2034 2035 2036 2037 2038 2039 2040 2041 2042 2043 2044 2045 2046 2047 2048 2049 2050 2051 2052 2053 2054 2055 20562057 2058 2059 2060 2061 2062 2063 2064 2065 2066 2067 2068 2069 2070 2071 2072 2073 2074 2075 2076 2077 2078 2079 2080 2081 2082 2083 2084 2085 2086 2087 2088 2089 2090 2091 2092 2093 2094 2095 2096 2097 2098 2099 2100 2101 2102 2103 2104 2105 2106 2107 2108 2109 2110 2111 2112 2113 2114 2115 2116 2117 2118 2119 2120 2121 2122 2123 2124 2125 2126 2127 2128 2129 2130 2131 2132 2133 2134 2135 2136 2137 2138 2139 2140 2141 2142 2143 2144 2145 2146 2147 2148 2149 2150 2151 2152 2153 2154 2155 2156 2157 2158 2159 2160 2161 2162 2163 2164 2165 2166 2167 2168 2169 2170 2171 2172 2173 2174 2176 2175 2177 2178 2179 2180 2181 2182 2183 2184 2185 2186 2187 2188 2189 2190 2191 2192 2193 2194 2195 2196 2197 2198 2199 2200 2201 2202 2203 2204 2205 2206 2207 2208 2209 2210 2211 2212 2213 2214 2215 2216 2217 2218 2219 2220 2221 2222 2223 2224 2225 2226 2227 2228 2229 2230 2231 2232 2233 2234 2235 2236 2237 2238 2239 2240 2241 2242 2243 2244 2245 2246 22472248 2249 2250 2251 2252 2253 2254 2255 2256 2257 2258 2259 2260 2261 2262 2263 2264 2265 2266 2267 2268 2269 2270 2271 2272 2273 2274 2275 2276 2277 2278 2279 2280 2281 2282 2283 2284 2285 2286 2287 2288 2289 2290 2291 2292 2293 2294 2295 2296 2297 2298 2299 2300 2301 2302 2303 2304 2305 2306 2307 2308 2309 2310 2311 2312 2313 2314 2315 2316 2317 2318 2319 2320 2321 2322 2323 2324 2325 2326 2327 2328 2329 2330 2331 2332 2333 2334 2335 2336 2337 2338 2339 2340 2341 2342 2343 2344 2345 2346 2347 2348 2349 2350 2351 2352 2353 2354 2355 2356 2357 2358 2359 2360 2361 2362 2363 2364 2365 2366 2367 2368 2369 2370 2371 2372 2373 2374 2375 2376 2377 2378 2379 2380 2381 2382 2383 2384 2385 2386 2387 2388 2389 2390 2391 2392 2393 2394 2395 2396 2397 2398 2399 2400 2401 2402 24032404 2405 2406 2407 2408 2409 2410 2411 2412 2413 2414 2415 2416 2417 2418 2419 2420 2421 2422 2423 2424 2425 2426 2427 2428 2429 2430 2431 2432 2433 2434 2435 2436 2437 2438 2439 2440 2441 2442 2443 2444 2445 2446 2447 2448 2449 2450 2451 2452 2453 2454 2455 2456 2457 2458 2459 2460 2461 2462 2463 2464 2465 2466 2467 2468 2469 2470 2471 2472 2473 2474 2475 2476 2477 2478 2479 2480 2481 2482 2483 2484 2485 2486 2487 2488 2489 2490 2491 2492 2493 2494 2495 2496 2497 2498 2499 2500 2501 2502 2503 2504 2505 2506 2507 2508 2509 2510 2511 2512 2513 2514 2515 2516 2517 2518 2519 2520 2521 2522 2523 2524 2525 2526 2527 2528 2529 2530 2531 2532 2533 2534 2535 2536 2537 2538 2539 2540 2541 2542 2543 2544 2545 2546 2547 2548 2549 2550 25512552 2553 2554 2555 2556 2557 2558 2559 2560 2561 2562 2563 2564 2565 2566 2567 2568 2569 2570 2571 2572 2573 2574 2575 2576 2577 2578 2579 2580 2581 2582 2583 2584 2585 2586 2587 2588 2589 2590 2591 2592 2593 2594 2595 2596 2597 2598 2599 2600 2601 2602 2603 2604 2605 2606 2607 2608 2609 2610 2611 2612 2613 2614 2615 2616 2617 2618 2619 2620 2621 2622 2623 2624 2625 2626 2627 2628 2629 2630 2631 2632 2633 2634 2635 2636 2637 2638 2639 2640 2641 2642 2643 2644 2645 2646 2647 26482649 2650 2651 2652 2653 2654 2655 2656 2657 2658 2659 2660 2661 2662 2663 2664 2665 2666 2667 2668 2669 2670 2671 2672 2673 2674 2675 2676 2677 2678 2679 2680 2681 2682 2683 2684 2685 2686 2687 2688 2689 2690 2691 2692 2693 2694 2695 2696 2697 2698 2699 2700 2701 2702 2703 2704 2705 2706 2707 2708 2709 2710 2711 2712 2713 2714 2715 2716 2717 2718 2719 2720 2721 2722 2723 2724 2725 2726 2727 2728 2729 2730 2731 2732 2733 2734 2735 2736 2737 2738 2739 2740 2741 2742 2743 2744 2745 2746 2747 2748 2749 2750 2751 2752 2753 2754 2755 2756 2757 2758 2759 2760 2761 2762 2763 2764 2765 2766 2767 2768 2769 2770 2771 2772 2773 2774 2775 2776 2777 2778 2779 2780 2781 2782 2783 2784 2785 2786 2787 2788 2789 2790 2791 2792 2793 2794 2795 2796 2797 2798 2799 2800 2801 2802 2803 2804 2805 2806 2807 2808 2809 2810 2811 2812 2813 2814 2815 2816 2817 2818 2819 2820 2821 2822 2823 2824 2825 2826 2827 2828 2829 2830 2831 2832 2833 2834 2835 2836 2837 2838 2839 2840 2841 2842 2843 2844 2845 2846 2847 2848 2849 2850 2851 2852 2853 2854 2855 2856 2857 2858 2859 2860 2861 2862 2863 2864 2865 2866 2867 2868 2869 2870 2871 2872 2873 2874 2875 2876 2877 2878 2879 2880 2881 2882 2883 2884 2885 2886 2887 2888 2889 2890 2891 2892 2893 2894 2895 2896 2897 2898 2899 2900 2901 2902 2903 2904 2905 2906 2907 2908 2909 2910 2911 2912 2913 2914 2915 2916 2917 2918 2919 2920 2921 2922 2923 2924 2925 2926 2927 2928 2929 2930 2931 2932 2933 2934 2935 2936 2937 2938 2939 2940 2941 2942 2943 2944 2945 2946 2947 2948 2949 2950 2951 2952 2953 2954 2955 2956 2957 2958 2959 2960 2961 2962 2963 2964 2965 2966 2967 2968 2969 2970 2971 2972 2973 2974 2975 2976 2977 2978 2979 2980 2981 2982 2983 2984 2985 2986 2987 2988 2989 2990 2991 2992 2993 29942995 2996 2997 2998 2999 3000 3001 3002 3003 3004 3005 3006 3007 3008 3009 3010 3011 3012 3013 3014 3015 3016 3017 3018 30193020 3021 3022 3023 3024 3025 3026 3027 3028 3029 3030 3031 3032 3033 3034 3035 3036 3037 3038 3039 3040 3041 3042 3043 3044 3045 3046 3047 3048 3049 3050 3051 3052 3053 3054 3055 3056 3057 3058 3059 3060 3061 3062 3063 3064 3065 3066 3067 3068 3069 3070 3071 3072 3073 3074 3075 3076 3077 3078 3079 3080 3081 3082 3083 3084 3085 3086 3087 3088 3089 3090 3091 3092 3093 3094 3095 3096 3097 3098 3099 3100 3101 3102 3103 3104 3105 3106 3107 3108 3109 3110 3111 3112 3113 3114 3115 3116 3117 3118 3119 3120 3121 3122 3123 3124 3125 3126 3127 3128 3129 3130 3131 3132 3133 3134 3135 3136 3137 3138 3139 3140 3141 3142 3143 3144 3145 3146 3147 3148 3149 3150 3151 3152 3153 3154 3155 3156 3157 3158 3159 3160 3161 3162 3163 3164 3165 3166 3167 3168 3169 3170 3171 3172 3173 3174 3175 3176 3177 3178 3179 3180 3181 3182 3183 3184 3185 3186 3187 3188 3189 3190 3191 3192 3193 3194 3195 3196 3197 3198 3199 3200 3201 3202 3203 3204 3205 3206 3207 3208 3209 3210 3211 3212 3213 3214 3215 3216 3217 3218 3219 3220 3221 3222 3223 3224 3225 3226 3227 3228 3229 3230 3231 3232 3233 3234 3235 3236 3237 3238 3239 3240 3241 3242 3243 3244 3245 3246 3247 3248 3249 3250 3251 3252 3253 3254 3255 3256 3257 3258 3259 3260 3261 3262 3263 3264 3265 3266 3267 3268 3269 3270 3271 3272 3273 3274 3275 3276 3277 3278 3279 3280 3281 3282 3283 3284 3285 3286 3287 3288 3289 3290 3291 3292 3293 3294 3295 3296 3297 3298 3299 3300 3301 3302 3303 3304 3305 3306 3307 3308 3309 3310 3311 3312 3313 3314 3315 3316 3317 3318 3319 3320 3321 3322 3324 3323 3325 3326 3327 3328 3329 3330 3331 3332 3333 3334 3335 3336 3337 3338 3339 3340 3341 3342 3343 3344 33453346 3347 3348 3349 3350 3351 3352 3353 3354 3355 3356 3357 3358 3359 3360 3361 3362 3363 3364 3365 3366 3367 3368 3369 3370 3371 3372 3373 3374 3375 3376 3377 3378 3379 3380 3381 3382 3383 3384 3385 3386 3387 3388 3389 3390 3391 3392 3393 3394 3395 3396 3397 3398 3399 3400 3401 3402 3403 3404 3405 3406 3407 3408 3409 3410 3411 3412 3413 3414 3415 3416 3417 3418 3419 3420 3421 3422 3423 3424 3425 3426 3427 3428 3429 3430 3431 3432 3433 3434 3435 3436 3437 3438 3439 3440 3441 3442 3443 3444 3445 3446 3447 3448 3449 3450 3451 3452 3453 3454 3455 3456 3457 3458 3459 3460 3461 3462 3463 3464 3465 3466 3467 3468 3469 3470 3471 3472 3473 3474 3475 3476 3477 3478 3479 3480 3481 3482 3483 3484 3485 3486 3487 3488 3489 3490 3491 3492 3493 3494 3495 3496 3497 3498 3499 3500 3501 3502 3503 3504 3505 3506 3507 3508 3509 3510 3511 3512 3513 3514 3515 3516 3517 3518 3519 3520 3521 3522 3523 3524 3525 3526 3527 3528 3529 3530 3531 3532 3533 3534 3535 3536 3537 3538 3539 3540 3541 3542 3543 3544 3545 3546 3547 3548 3549 3550 3551 3552 3553 3554 3555 3556 3557 3558 3559 3560 3561 3562 3563 3564 3565 3566 3567 3568 3569 3570 3571 3572 3573 3574 3575 3576 3577 3578 3579 3580 3581 3582 3583 3584 3585 3586 3587 3588 3589 3590 3591 3592 3593 3594 3595 3596 3597 3598 3599 3600 3601 3602 3603 3604 3605 3606 3607 3608 3609 3610 3611 3612 3613 3614 3615 3616 3617 3618 3619 3620 3621 3622 3623 3624 3625 3626 3627 3628 3629 3630 3631 3632 3633 3634 3635 3636 3637 3638 3639 3640 3641 3642 3643 3644 3645 3646 3647 3648 3649 3650 3651 3652 3653 3654 3655 3656 3657 3658 3659 3660 3661 3662 3663 3664 3665 3666 3667 3668 3669 3670 3671 3672 3673 3674 3675 3676 3677 3678 3679 3680 3681 3682 3683 3684 3685 3686 3687 3688 3689 3690 3691 3692 3693 3694 3695 3696 3697 3698 3699 3700 3701 3702 3703 3704 3705 3706 3707 3708 3709 3710 3711 3712 3713 3714 3715 3716 3717 3718 3719 3720 3721 3722 3723 3724 3725 3726 3727 3728 3729 3730 3731 3732 3733 3734 3735 3736 3737 3738 3739 3740 3741 3742 3743 3744 3745 3746 3747 3748 3749 3750 3751 3752 3753 3754 3755 3756 3757 3758 3759 3760 3761 3762 3763 3764 3765 3766 3767 3768 3769 3770 3771 3772 3773 3774 3775 3776 3777 3778 3779 3780 3781 3782 3783 3784 3785 3786 3787 3788 3789 3790 3791 3792 3793 3794 3795 3796 3797 3798 3799 3800 3801 3802 3803 3804 3805 3806 3807 3808 3809 3810 3811 3812 3813 3814 3815 3816 3817 3818 3819 3820 3821 3822 3823 3824 3825 3826 3827 3828 3829 3830 3831 3832 3833 3834 3835 3836 3837 3838 3839 3840 3841 3842 3843 3844 3845 3846 3847 3848 3849 3850 3851 3852 3853 3854 3855 3856 3857 3858 3859 3860 3861 3862 3863 3864 3865 3866 3867 3868 3869 3870 3871 3872 3873 3874 3875 3876 3877 3878 3879 3880 3881 3882 3883 3884 3885 3886 3887 3888 3889 3890 3891 3892 3893 3894 3895 3896 3897 3898 3899 3900 3901 3902 3903 3904 3905 3906 3907 3908 3909 3910 3911 3912 3913 3914 3915 3916 3917 3918 3919 3920 3921 3922 3923 3924 3925 3926 3927 3928 3929 3930 3931 3932 3933 3934 3935 3936 3937 3938 3939 3940 3941 3942 3943 3944 3945 3946 3947 3948 3949 3950 3951 3952 3953 3954 3955 3956 3957 3958 3959 3960 3961 3962 3963 3964 3965 3966 3967 3968 3969 3970 3971 3972 3973 3974 3975 3976 3977 3978 3979 3980 3981 3982 3983 3984 3985 39863987 3988 3989 3990 3991 3992 3993 3994 39953996 3997 3998 3999 4000 4001 4002 40034004 4005 4006 4007 4008 4009 4010 4011 4012 4013 4014 4015 4016 4017 401840194020 40214022 4023 4024 4025 4026 4027 4028 4029 4030 4031 4032 4033 4034 4035 4036 4037 4038 4039
3.2. Evaluation of graph clustering algorithms 25 the assignment of the two nodes agrees in X and Y (for ex-ample they are both in the same cluster in X and Y, or they are separated in different clusters both in Xand Y) , the pair is marked as a correct assignment. If the assignment does not agree (for example, they are in the same cluster in X, but sep-arated inY), the pair is marked an incorrect assignment. Rand index is defined as the percentage of correctly assigned pairs. Let C(X) = {(ni, nj)|ni ∈Xk, nj ∈Xk k≤r} be the set of node pairs that are assigned in the same cluster of partition
X. Let D(X){(ni, nj)|ni ∈Xk, nj ∈Xl, k=l, k ≤r, l≤r}
be the set of node pairs that the two nodes are assigned in dif-ferent clusters in partition X. Rand index is defined as
RI = |C(X)∩C(Y)|+|D(X)∩D(Y)| N
2
, (3.1)
whereN is the number of nodes. • Adjusted Rand index
One drawback of the Rand index is that a randomly partitioned result may yield a high Rand index score because of the large value of the disagreed pairs [100, 101]. To avoid this problem, the adjusted Rand index is normally used. Adjusted Rand index is defined as
ARI = RI−E(RI)
max(RI)−E(RI), (3.2) whereE(RI)is the expected Rand index value of a random par-tition andmax(RI)is the maximum Rand Index value. Adjusted Rand index has a value close to zero for random partitions. • Normalized mutual information
Mutual information [102] is a concept that is used in probability theory to measure the dependency of two random variables. By
the definition of mutual information, it can be written as
I(X, Y) = H(X)−H(X|Y) = H(Y)−H(Y|X)
= H(X) +H(Y)−H(X, Y)
, (3.3)
where I(X, Y) is the mutual information of random variables
X and Y, H(·) is the marginal entropy of a random variable,
H(X|Y) is the conditional entropy of random variable X given random variable Y, and H(X, Y) is the joint entropy of the two random variables X and Y. Mutual information gives a value of how much extra information is required to encode a random variable by knowing another random variable. The value of mutual information is between zero andH(X)or H(Y). The normalized mutual information (NMI) is defined as
R= I(X, Y)
H(X) +H(Y). (3.4) NMI is commonly used as a measure f
![Figure 1.1 A sketch of the Seven Bridges of Königsberg by Euler (E53 of MAA Eurler Archive [2])](https://thumb-us.123doks.com/thumbv2/123dok_us/90540.2510311/22.748.103.563.104.330/figure-sketch-seven-bridges-königsberg-euler-eurler-archive.webp)