2017 International Conference on Computer, Electronics and Communication Engineering (CECE 2017) ISBN: 978-1-60595-476-9
Forecasting Grain Supply and Demand with Support Vector Regression
Wei-ya SHI
*, Dong-li LIU
and Tie-jun YANG
College of Information Science and Engineering, Henan University of Technology, Zhengzhou 450001, China
*Corresponding author
Keywords: Supply, Demand, Forecast, Trend.
Abstract. The paper uses the machine leaning algorithm to analyses grain supply and demand of China. For the sake of small samples, support vector regression is used to forecast the tread of grain supply and demand. From the result, it can be found that support vector regression can get good performance using some different metrics. The result also shows that both grain supply and demand will increase in long tread. At last, some suggestions about grain supply and demand are given.
Introduction
The grain is important to people, who cannot live without grain. However, the problem of grain demand and supply has becoming more and more serious for the sake of the increase of extreme weather, the growth of population and many other factors. It is especially important for China because there are about 1.4 billion population in China, and what's more, it only has seven percent of world arable land to feed so many people. How to efficiently balance supply and demand of grain has largely influenced in national food security.
There are many qualitative and quantitative researches about the demand and supply of grain. For example, some scholars [1-3] had used different models to forecast future tread of grain demand and pointed out there will have shortage between demand and supply in future. Wu [4] simulate the medium and long term trend of grain demand and supply using the GM(1,1) model. Zhang [5] also found the grain demand will have sustainable growth in China.
In fact, forecasting grain demand and supply belongs to time series forecasting. Some appropriate models have been proposed to analyze and predict time series data [6-7]. In recent years, it has obtained many achievements in both theory and application. Time series data can be generally analyzed and predicted in either the time [8] or frequency domains [9]. There are many applications in time series forecasting [10-12].
In the paper, we use support vector regression to analyze and predict grain demand and supply. We apply support vector regression to analysis and forecast the trend of grain demand and supply.
Basic Knowledge of Support Vector Regression
Support vector machine (SVM) was proposed by Vapnik and some co-workers [17-18]. The aim of Support vector machine is to find a decision hyperplane for classification. Support vector regression (SVR) is the extension of Support Vector machine. In the case of regression, the formulated is given as follows:
b x
y T (1)
The coefficients and bcan be estimated by minimizing
N
i
i i
C
1
*
2 ( )
|| || 2 1
Its constraints are given: 0 , y -y * * i i i i i i T i i T b x b x (3)
Where and are parameters. , *
i
i
are the slack variables. After dealing with the convex optimization problem, the solution can be gotten.
b x xi
N 1 i * ii - ) ,
(
y (4)
Where and are Lagrange multipliers. When data is nonlinear and complex, the solutions in dual representation is given as follows:
b x x b x x i i
N 1 i * i i N 1 i * i i ) , )K( -( ) ( ), ( ) -( y (5)Where K(x ,x) (x ), (x) (x )T (x)
i i
i is the kernel function.
The Dataset and Performance Metrics
The sample data mainly comes from China Statistical Yearbook, State Statistics Bureau, and website of United Nations Food and Agriculture Organization (FAO). Considering the problem of demand and supply of grain, there are not definite statistical data about them. Some researchers use domestic grain yield, food import and export volume as the data of grain supply. However, the grain yield data accounts for the main proportion, we will only consider grain yield data in forecasting supply of grain.
In the paper, the grain yield data is selected from 1978 to 2013. The same situation exists in data of grain supply. The food consumer price index is used as a replacement of data of grain demand. We only consider the food consumer price index from 1995 to 2013 for the sake of statistical cause.
In the experiment, Support vector regression is used to give predication of grain demand and supply in China. In order to validate effectiveness of predicting accuracy, three different metrics are used: MAE (Mean Absolute Error), MSE (Mean Square Error) and MAPE (Mean Absolute Percent Error).
n i i i y y n MAE 1 | ˆ | 1 (6)
n i i i y y n MSE 1 2 ) ˆ ( 1 (7)
n i i i i y y y n MAPE 1 | ˆ | 1 (8)Experiment
Forecasting Trend of Grain Supply. In the whole procedure, each experiment is repeated 10 times for different samples. The Gaussian function is used in SVR. There are three parameters in the SVR: insensitive loss function ε, Lagrange multiplier upper bound C and the width of Gaussian function w. A 10-fold cross-validation is used to select these parameters.
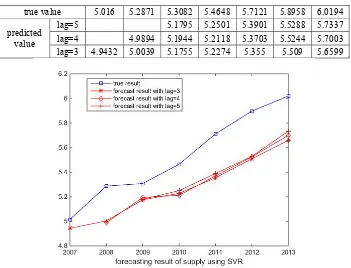
[image:3.612.132.483.206.474.2]We consider different regression order (lag=5,4,3). Table 1 gives the experimental result using support vector regression. Fig. 1 can give straight illustration of the result. It can be seen that SVR can forecast the trend of grain supply.
Table 1. experimental result using support vector regression for grain supply.
true value 5.016 5.2871 5.3082 5.4648 5.7121 5.8958 6.0194
predicted value
lag=5 5.1795 5.2501 5.3901 5.5288 5.7337
lag=4 4.9894 5.1944 5.2118 5.3703 5.5244 5.7003
lag=3 4.9432 5.0039 5.1755 5.2274 5.355 5.509 5.6599
Figure 1. Experimental result using support vector regression for grain supply.
In order to compare the quantified performance, three metrics MAE, MSE and MAPE are used and the results are given in Table 3. It can be found that the error for different lags are similar.
Table 2. Predicting performance using support vector regression for grain supply.
SVR MAE MAPE MSE regression order parameter
train sample 0.1656 0.0369 0.045
lag=5 C=241 e=0.01 width=29.6
test sample 0.2634 0.0459 0.0764
train sample 0.145 0.0327 0.0357
lag=4 C=461 e=0.01 width=29.1
test sample 0.2828 0.05 0.087
train sample 0.1697 0.0392 0.0428
lag=3 C=381 e=0.21 width=23.6
test sample 0.2614 0.0463 0.0808
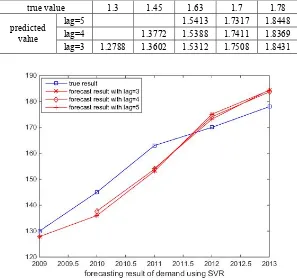
Forecasting Trend of Grain Demand. To forecast trend of grain demand, different regression order (lag=5,4,3) are also considered. Table 3 gives the experimental result using support vector regression. Fig. 2 can also give straight illustration of the result. It can be seen that SVR can give similar result with forecasting trend of grain supply.
Table 3. Experimental result using support vector regression for grain demand.
true value 1.3 1.45 1.63 1.7 1.78
predicted value
lag=5 1.5413 1.7317 1.8448
lag=4 1.3772 1.5388 1.7411 1.8369
lag=3 1.2788 1.3602 1.5312 1.7508 1.8431
[image:4.612.96.516.414.535.2]Figure 2. Experimental result using support vector regression for grain demand.
Table 4. Predicting performance using support vector regression for grain demand.
SVR MAE MAPE MSE regression order parameter
train sample 0.05 0.052 0.0063
lag=5 C=21 e=0.21 width=4.1
test sample 0.0617 0.0365 0.0044
train sample 0.0468 0.0493 0.0056
lag=4 C=481 e=0.01 width=12.1
test sample 0.0655 0.0406 0.0046
train sample 0.0515 0.0529 0.0054
lag=3 C=61 e=0.01 width=2.6
test sample 0.0647 0.048 0.005
Summary
In this paper, we use support vector regression to forecast trend of grain supply and demand. From the result, it can be found grain supply and demand is continuously increased in long term. It gives the hint than government should arrange rational plant and import for grain supply in advance, in addition, reasonable adjustment of food consumption habits should also be recommend.
Acknowledgement
This work was supported in part by Special Fund for Agro-scientific Research in the Public Interest under contract 201413001.
References
[2] Xuan Zhao, Yishan Shao, Analysis and prediction of grain supply and demand in China, Research of Agricultural Modernization, 277---280, 3(2014).
[3] Guoda Gu, Jinghua Yi, Analysis on the trend of global medium and long term grain supply and demand, Journal of Huazhong Agricultural University (Social Science Edition), 6-16, 6(2014). [4] Le Wu, Research on the long term trend of China's grain demand, Doctoral Dissertation of Huazhong Agricultural University, (2011).
[5] Yumei Zhang, Yuqiang Li, Zhemin Li, Shiwei Xu, China Grains Demand Forecast Analysis Based on China Economywide Multimarket Model, Food and Nutrition in China, 40-45, 2(2012). [6] Tae Woo Joo, Seoung Bum Kim, Time series forecasting based on wavelet filtering, Expert Systems with Applications 42 (2015) 3868–3874.
[7] Anderson, T. W. (1971). The statistical analysis of time series. New York: John Wiley & Sons. [8] Li, G., Gai, Z., Kang, X., Wu, Z., & Wang, Y. (2014). ESPSA: A prediction-based algorithm for streaming time series. Expert Systems with Applications, 41, 6098–6105.
[9] Tabak, B. M., & Feitosa, M. A. (2010). Forecasting industrial production in Brazil: Evidence from a wavelet approach. Expert Systems with Applications, 37(9), 6345–6351.
[10] Faheemullah Shaikh, Qiang Ji, Forecasting natural gas demand in China: Logistic modelling analysis, Electrical Power and Energy Systems 77 (2016) 25–32.
[11] Joscha Beckmann, Rainer Schussler, Forecasting exchange rates under parameter and model uncertainty, Journal of International Money and Finance 60 (2016) 267–288.
[12] O. Abedinia, N. Amjady, M. Shafie-khah, J.P.S. Catalão, Electricity price forecast using Combinatorial Neural Network trained by a new stochastic search method, Energy Conversion and Management 105 (2015) 642–654.
[13] Mallat, S. G. (1989). A theory for multi resolution signal decomposition: The wavelet representation. IEEE Transaction on Pattern Analysis and Machine Intelligence, 11, 674–693. [14] Tae Woo Joo, Seoung Bum Kim, Time series forecasting based on wavelet filtering, Expert Systems with Applications 42 (2015) 3868–3874.
[15] machineSong Li, Peng Wang, Lalit Goel, Short-term load forecasting by wavelet transform and evolutionaryextreme learning machine, Electric Power Systems Research 122 (2015) 96–103. [16] Vishal Sharma, Dazhi Yang, Wilfred Walsh, Thomas Reindl, Short term solar irradiance forecasting using a mixed wavelet neural network, Renewable Energy 90 (2016) 481e492.
[17] B. Sch¨olkopf, C. J. C. Burges, and A. J. Smola, editors. Advances in Kernel Methods—Support Vector Learning. MIT Press, Cambridge, MA, 1999a.