P R O C E E D I N G S
Open Access
Comparison of five methods for genomic
breeding value estimation for the common
dataset of the 15
th
QTL-MAS Workshop
Chong-Long Wang
1,2†, Pei-Pei Ma
1, Zhe Zhang
1, Xiang-Dong Ding
1, Jian-Feng Liu
1, Wei-Xuan Fu
1, Zi-Qing Weng
1,
Qin Zhang
1*From
15th European workshop on QTL mapping and marker assisted selection (QTLMAS)
Rennes, France. 19-20 May 2011
Abstract
Background:Genomic breeding value estimation is the key step in genomic selection. Among many approaches,
BLUP methods and Bayesian methods are most commonly used for estimating genomic breeding values. Here, we applied two BLUP methods, TABLUP and GBLUP, and three Bayesian methods, BayesA, BayesB and BayesCπ, to the common dataset provided by the 15thQTL-MAS Workshop to evaluate and compare their predictive performances. Results:For the 1000 progenies without phenotypic values, the correlations between GEBVs by different methods ranged from 0.812 (GBLUP and BayesCπ) to 0.997 (TABLUP and BayesB). The accuracies of GEBVs (measured as correlations between true breeding values (TBVs) and GEBVs) were from 0.774 (GBLUP) to 0.938 (BayesCπ) and the biases of GEBVs (measure as regressions of TBVs on GEBVs) were from 1.033 (TABLUP) to 1.648 (GBLUP). The three Bayesian methods and TABLUP had similar accuracy and bias.
Conclusions:BayesA, BayesB, BayesCπand TABLUP performed similarly and satisfactorily and remarkably outperformed GBLUP for genomic breeding value estimation in this dataset. TABLUP is a promising method for genomic breeding value estimation because of its easy computation of reliabilities of GEBVs and its easy extension to real life conditions such as multiple traits and consideration of individuals without genotypes.
Background
The goal of genomic selection (GS) [1] is to capture all quantitative trait loci (QTL) influencing a trait by tracing all chromosome segments defined by adjacent markers. With use of highly dense markers, GS is supposed to be able to overcome the problem of traditional maker assisted selection (MAS) that only a limited proportion of the total genetic variance is captured by the markers of QTL. GS has become feasible very recently with the high throughput genotyping technology and the availability of highly dense markers covering whole genome. Genomic
breeding value estimation is the key step in GS. A num-ber of approaches have been proposed for estimating genomic breeding values [1-9], among which BLUP methods and Bayesian methods are most commonly used. Here, we applied two BLUP methods (GBLUP [3], TABLUP [4]) and three Bayesian methods (BayesA, BayesB [1], BayesCπ[5]) to the common dataset provided by the 15thQTL-MAS Workshop to evaluate and com-pare their predictive performances.
Methods
Dataset
The common dataset consisted of an outbred population, which had been simulated using the LDSO software [10], with 1000 generations of 1000 individuals, followed by 30 generations of 150 individuals. 9990 SNP markers were distributed on 5 chromosomes. Each chromosome had a
* Correspondence: [email protected]
†Contributed equally
1Key Laboratory of Animal Genetics, Breeding and Reproduction, Ministry of
Agriculture of China, College of Animal Science and Technology, China Agricultural University, Beijing 100193, China
Full list of author information is available at the end of the article
size of 1 Morgan and carried 1998 evenly distributed SNPs (1 SNP every 0.05 cM).
The final dataset used for evaluating genomic selection consisted of 3220 individuals, including 20 sires, 200 dams (each sire mated with 10 dams) and 3000 proge-nies (15 per dam). All individuals were genotyped for the 9990 SNPs without missing or genotyping error. Of the 15 progenies of each dam, 10 were phenotyped for a continuous trait. The 2000 progenies with phenotypic records and the other 1000 individuals (which had simu-lated true breeding values) without phenotypic records were treated as reference and validation population, respectively.
Estimation of variance components and EBVs
The variance components and the traditional BLUP EBVs were estimated using phenotypes and pedigree and the software DMUv6 [11] based on the following model:
y=1μ+Za+e
wherey is the vector of phenotypes of individuals in the reference population, μis the overall mean,a is the vector of additive genetic effects of the phenotyped indi-viduals and their parents,Zis the incidence matrix ofa, andeis the vector of residual errors. The variance-cov-ariance matrices of a and e are Aσa2 and Iσe2, respec-tively, where A is the additive genetic relationship matrix, σa2 is the additive genetic variance, and σe2 is the residual variance.
The reliabilities of the traditional EBVs were obtained from DMU directly and calculated as the square of the correlation between EBVs and the true unknown breeding values.
Estimation of SNP effects
BayesA, BayesB and BayesCπ were used to estimate SNP effects in the reference population based on the follow-ing model:
y=1μ+Xg+e
whereg is the vector of random SNP effects,X is the matrix of genotype indicators (with values 0, 1, or 2 for genotypes 11, 12, and 22, respectively).
The differences between the three Bayesian methods lay in the assumptions for the prior distribution of SNP effects. BayesA assumes that all SNPs have an effect, but each has a different variance. BayesB and BayesCπassume that each SNP has either an effect of zero or non-zero with probabilitiesπand 1-π, respectively, and for those having non-zero effects it is assumed that each SNP has a different variance in BayesB and a common variance in BayesCπ. In addition, in BayesBπ is treated as a known parameter, while in BayesCπit is treated as an unknown
parameter with a uniform (0, 1) prior distribution. In this study, we setπ= 0.99 for BayesB, and adopted the same prior distributions ofgandefor the three Bayesian meth-ods as those in [1,5].
The Markov chain was run for 50,000 cycles of Gibbs sampling (for BayesB, 100 additional cycles of Metropo-lis-Hastings sampling were performed for the SNP effect variance in each Gibbs sampling cycle), and the first 5000 cycles were discarded as burn-in. All the samples of SNP effects after burn-in were averaged to obtain the SNP effect estimate.
Calculation of GEBVs
The genomic estimated breeding values (GEBVs) of all genotyped individuals were obtained using five methods: BayesA, BayesB, BayesCπ, GBLUP and TABLUP.
For BayesA, BayesB and BayesCπ, the GEBV of a geno-typed individual was calculated as the sum of all marker effects according to its marker genotypes [1].
For GBLUP and TABLUP, the GEBVs were estimated based on the following model:
y=1μ+Zu+e
whereuis the vector of genomic breeding values of all genotyped individuals with the variance-covariance matrix equal toGσu2for GBLUP or TAσu2 for TABLUP. σu2 is the
additive genetic variance estimated from the reference population.
TheGmatrix (realized relationship matrix) was con-structed by using genotypes of all markers [3]. TheTA matrix (trait-specific marker-derived relationship matrix), was constructed by using genotypes of all markers with each marker being weighted with its estimated effect obtained from BayesB following the rules proposed by Zhang et al. [4].
The accuracies of GEBVs were calculated as the correla-tion between GEBVs and the simulated true breeding values.
Results and discussion
Variance components
The estimated additive genetic variance and residual var-iance were 24.82 and 58.65, respectively. Therefore, the estimated heritability was 0.30. These estimates were used for the subsequent estimation of SNP effects and GEBVs.
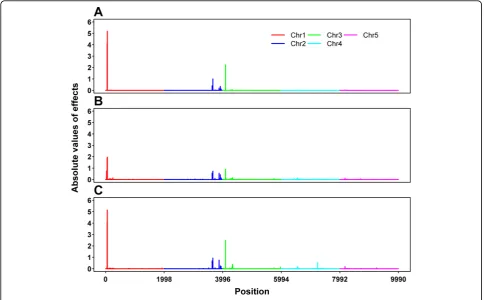
Estimates of SNP effects
methods are quite similar. In particular, all of the three methods show a big peak on chromosome 1, two peaks on chromosome 2, and a peak on chromosome 3. In addition, BayesCπshows another peak on chromosome 3 and a peak on chromosome 4. No peaks appear on chromosome 5 for all of the three methods. The peak positions and the corresponding SNP effect estimates are given in Table 1. For chromosomes 1, 2 and 3, where one, two and two additive QTL were simulated, respectively, these peak positions match all the simulated QTL positions quite well, except that BayesA and BayesB missed one QTL on chromosome 3. For chromosomes 4 and 5, where an imprinted QTL and two epistatic QTL were simulated, respectively, either no peak was detected or the detected
peak is far away from the simulated position. From these results, it seems that these methods could also serve as tools for QTL mapping and BayesCπperformed better in this respect. The drawback of BayesA and BayesB regard-ing the impact of prior hyperparameters and treatregard-ing the prior probabilityπas known has been addressed by Gia-nola et al. [12] and Habier et al. [5]. Our results partially confirmed their arguments.
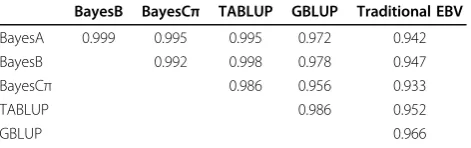
Correlations between GEBVs by different methods and between EBVs and GEBVs for the 20 sires
For the 20 sires, the reliability of traditional EBVs was 0.95. Table 2 shows the correlations between GEBVs by different methods and between EBVs and GEBVs of the
Figure 1Absolute values of estimated SNP effects by BayesA (A), BayesB (B) and BayesCπ(C).
Table 1 Peak positions of profiles of the estimated SNP effects and the corresponding estimated SNP effects
Method Chr. 1 Chr. 2 Chr. 3 Chr. 4
Pos. Effect Pos. Effect Pos. Effect Pos. Effect
BayesA 59 5.19±0.37 3660 1.01±0.90 4094 2.25±0.40
3914 0.35±0.73
BayesB 59 1.96±2.13 3660 0.73±0.82 4092 0.91±1.17
3873 0.56±0.65
BayesCπ 58 5.15±0.42 3660 0.93±0.96 4092 2.50±0.76 7234 0.53±1.51
3873 0.76±0.75 4331 0.41±0.67
Simulated QTL 57 3638 4100 6644
20 sires. The correlations between EBVs and GEBVs by different methods ranged from 0.933 to 0.966, and the highest correlation was given by GBLUP and the lowest by BayesCπ. In general, the GEBVs by different methods were highly correlated with the correlation coefficients over 0.95, indicating that the GEBVs for the 20 sires by different methods were quite consistent.
Correlations between GEBVs by different methods for the 1000 progenies without phenotypic values
Table 3 shows the correlations between GEBVs by differ-ent methods for the 1000 progenies without phenotypic values. The correlations ranged from 0.812 to 0.997, and the highest correlation was between TABLUP and BayesB, and the lowest between GBLUP and BayesCπ. The corre-lations among the three Bayesian methods and TABLUP are all very high (over 0.97), indicating high similarity in GEBVs from these methods, while the correlations between them and GBLUP are all less than 0.9, indicating some differences in GEBVs exist herein.
Accuracies and biases of GEBVs
The availability of true breeding values (TBVs) of the 1000 progenies without phenotypic values allowed a more efficient assessment for methods. Table 4 shows the correlations of TBVs and GEBVs, which measure the accuracies of GEBVs, and regressions of TBVs on GEBVs, which measure the biases of GEBVs, by different methods. In terms of both accuracy and bias, the three Bayesian methods and TABLUP performed similarly with correlations over 0.92 and slightly downward bias. BayesB and BayesCπwere slightly more accurate than BayesA and TABLUP, while TABLUP yielded smallest bias.
GBLUP gave the lowest accuracy and the highest down-ward bias.
TABLUP is an improvement of GBLUP in the way that theGmatrix is replaced withTAmatrix. In construction of theTAmatrix, not only the marker genotypes, but also the marker effects are taken into account. The advantage of theTAmatrix over theGmatrix is that it not only accounts for the Mendelian sampling term, but also puts greater weight on loci explaining more of genetic variance for the trait of interest. This makes TABLUP more accurate than GBLUP. On the other hand, although TABLUP and the Bayesian methods gave similar accuracies, TABLUP has two important features that Bayesian methods lack. The first is that the reliability of an individual’s GEBV can be calculated by TABLUP through the method outlined for GBLUP by VanRaden [3] and Strandén et al. [13]. The second is that TABLUP can be extended to estimate GEBVs for individuals with-out genotypes by constructing a joint pedigree-genomic relationship matrix according to the rule proposed by Legarra et al. [14].
Conclusions
BayesA, BayesB, BayesCπand TABLUP performed simi-larly and satisfactorily and remarkably outperformed GBLUP for genomic breeding value estimation in this dataset. TABLUP is a promising method for genomic breeding value estimation because of its easy computa-tion of reliabilities of GEBVs and its easy extension to real life conditions such as multiple traits and considera-tion of individuals without genotypes.
List of abbreviations used
QTL: quantitative trait locus; MAS: marker assisted selection; GS: genomic selection; BLUP: best linear unbiased prediction; GBLUP: BLUP with a realized relationship matrix; TABLUP: BLUP with a trait specific relationship matrix; EBV(s): estimated breeding value(s); GEBV(s): genomic estimated breeding value(s); TBV(s): true breeding value(s); SNP: single nucleotide polymorphism.
Acknowledgements
This work was supported by the State High-Tech Development Plan of China (Grant No. 2008AA101002, 2011AA100302), the National Natural Science Foundation of China (Grant No. 30800776, 30972092, 31171200), Beijing Municipal Natural Science Foundation (Grant No. 6102016), and the Modern Pig Industry Technology System Program of Anhui Province. Table 2 Correlations between GEBVs by different
methods (the first 4 columns) and between traditional EBVs and GEBVs (the last column) for the 20 sires
BayesB BayesCπ TABLUP GBLUP Traditional EBV
BayesA 0.999 0.995 0.995 0.972 0.942
BayesB 0.992 0.998 0.978 0.947
BayesCπ 0.986 0.956 0.933
TABLUP 0.986 0.952
GBLUP 0.966
Table 3 Correlations between GEBVs by different methods for the 1000 progenies without phenotypic values.
BayesB BayesCπ TABLUP GBLUP
BayesA 0.991 0.985 0.983 0.841
BayesB 0.986 0.997 0.860
BayesCπ 0.976 0.812
TABLUP 0.876
Table 4 Accuracies and biases of GEBVs for the 1000 progenies without phenotypic values.
This article has been published as part ofBMC ProceedingsVolume 6 Supplement 2, 2012: Proceedings of the 15th European workshop on QTL mapping and marker assisted selection (QTL-MAS). The full contents of the supplement are available online at http://www.biomedcentral.com/bmcproc/ supplements/6/S2.
Author details
1Key Laboratory of Animal Genetics, Breeding and Reproduction, Ministry of
Agriculture of China, College of Animal Science and Technology, China Agricultural University, Beijing 100193, China.2Institute of Animal Husbandry
and Veterinary Medicine, Anhui Academy of Agricultural Sciences, Hefei 230031, China.
Authors’contributions
CLW, PPM and ZZ contributed the data analyses and the manuscript. XDD and JFL contributed the modification of manuscript. WXF and ZQW carried out the data analyses. QZ coordinated the analyses and revised the manuscript. All authors have read and contributed to the final text of the manuscript.
Competing interests
The authors declare that they have no competing interests.
Published: 21 May 2012
References
1. Meuwissen THE, Hayes BJ, Goddard ME:Prediction of total genetic value using genome-wide dense marker maps.Genetics2001,157:1819-1829. 2. Solberg TR, Sonesson AK, Woolliams JA, Meuwissen THE:Reducing
dimensionality for prediction of genome-wide breeding values.Genetics Selection Evolution2009,41:29.
3. VanRaden PM:Efficient methods to compute genomic predictions.
J Dairy Sci2008,91:4414-4423.
4. Zhang Z, Liu J, Ding X, Bijma P, de Koning D-J, Qin Z:Best linear unbiased prediction of genomic breeding values using a trait-specific marker-derived relationship matrix.PLoS ONE2010,5(9):e12648.
5. Habier D, Fernando RL, Kizilkaya K, Garrick DJ:Extension of the Bayesian alphabet for genomic selection.BMC Bioinformatics2011,12:186. 6. Yi N, Xu S:Bayesian LASSO for quantitative trait loci mapping.Genetics
2008,179:1045-1055.
7. Zou H, Hastie T:Regularization and variable selection via the elastic net.
Journal of the Royal Statistical Society B2005,67:301-320.
8. Gianola D, Fernando RL, Stella A:Genomic-assisted prediction of genetic value with semiparametric procedures.Genetics2006,173:1761-1776. 9. Long N, Gianola D, Rosa GJM, Weigel KA, Avendano S:Machine learning
classification procedure for selecting SNPs in genomic selection: application to early mortality in broilers.J Anim Breed Genet2007,
124:377-389.
10. Ytournel F:Linkage disequilibrium and QTL fine mapping in a selected population.PhD thesisStation de Génétique Quantitative et Appliquée, INRA; 2008.
11. Madsen P, Jensen J:DMU: A user’s Guide. A Package for Analysing Multivariate Mixed Models.University of Aarhus, Faculty of Agricultural Sciences, Department of Animal Breeding and Genetics2007.
12. Gianola D, de los Campos G, Hill WG, Manfredi E, Fernando RL:Additive Genetic Variability and the Bayesian Alphabet.Genetics2009,183:347-363. 13. Strandén I, Garrick DJ:Technical note: derivation of equivalent computing
algorithms for genomic predictions and reliabilities of animal merit.
J Dairy Sci2009,92:2971-2975.
14. Legarra A, Aguilar I, Misztal I:A relationship matrix including full pedigree and genomic information.J Dairy Sci2009,92:4656-4663.
doi:10.1186/1753-6561-6-S2-S13
Cite this article as:Wanget al.:Comparison of five methods for genomic breeding value estimation for the common dataset of the 15th QTL-MAS Workshop.BMC Proceedings20126(Suppl 2):S13.
Submit your next manuscript to BioMed Central and take full advantage of:
• Convenient online submission
• Thorough peer review
• No space constraints or color figure charges
• Immediate publication on acceptance
• Inclusion in PubMed, CAS, Scopus and Google Scholar
• Research which is freely available for redistribution