The design and simulated performance of a fast Level 1 track
trigger for the ATLAS High Luminosity Upgrade
MikaelMårtensson1,a, on behalf of the ATLAS Collaboration
1Institute of Physics and Astronomy, Uppsala Universitet
Abstract. The ATLAS experiment at the High Luminosity LHC will face a fivefold
increase in the number of interactions per bunch crossing relative to the ongoing Run 2. This will require a proportional improvement in rejection power at the earliest levels of the detector trigger system, while preserving good signal efficiency. One critical aspect of this improvement will be the implementation of precise track reconstruction, through which sharper trigger turn-on curves can be achieved, andb-tagging and tau-tagging tech-niques can in principle be implemented. The challenge of such a project comes in the development of a fast, custom electronic device integrated in the hardware based first trigger level of the experiment. This article will discuss the requirements, architecture and projected performance of the system in terms of tracking, timing and physics, based on detailed simulations. Studies are carried out using data from the strip subsystem only or both strip and pixel subsystems.
1 Introduction
ATLAS is an experiment at the Large Hadron Collider (LHC) aimed at studying the Standard Model of particle physics and to search for physics beyond the Standard Model by analysing high energy proton-proton interactions. The ATLAS detector consists of a number of subdetectors. Moving from the interaction point outwards they are: a tracker that consists of a silicon pixel detector, a silicon strip detector, and a straw tube detector; the electromagnetic and hadronic sampling calorimeters, which use liquid argon and plastic scintillators as active medium; and finally the muon spectrometer that consists of monitored drift tubes, cathode-strip chambers, resistive plate chambers, and thin gap chambers [1].
The High Luminosity LHC (HL-LHC) is scheduled to start running in 2026. The upgrade is ex-pected to increase the instantaneous proton-proton luminosity to 7.5×1034cm−2s−1, which translates
to a sevenfold increase in the number of interactions per bunch crossing, so-calledpile-up, compared
to the LHC design luminosity. The ATLAS detector will be upgraded as well, in a project named thePhase-II upgrade, with installation scheduled to take place between 2024 and 2026. The upgrade will include a completely new tracker, as described in section 2.2, upgrades to the trigger and readout electronics, and replacements of parts of the calorimeter and muon spectrometer.
The vast amount of data generated by the increased luminosity puts strict demands on the ATLAS trigger system. Due to its high energy frontier physics program, ATLAS bases its trigger selection on
high transverse momentum (pT) lepton selection organised in two levels: one hardware (first-level)
and one software. The left plot in figure 1 shows the ATLAS acceptance fraction of a few processes as a function of muonpTthreshold. From it, it is clear that the current triggerpTthreshold of 20 GeV
needs to be maintained in order to take full advantage of the increase in luminosity. At the same time, trigger rates need to be kept at a reasonable level to avoid saturating the readout bandwidth. This is shown in the right plot of figure 1, where we see that the first-level electromagnetic trigger rate for
electrons has a strong dependence on pT [2]. As an example, to limit the rate to 20 kHz one would
have to increase the threshold to 40 GeV. The ATLAS Phase-II upgrade will introduce a hardware track trigger that can help to control the trigger rate by exploiting extremely good tracking resolution to increase the signal-to-background ratio.
[GeV]
T
True muon p
0 10 20 30 40 50 60 70 80 90 100
Acceptance 0 0.2 0.4 0.6 0.8 1 WH h τ l τ → h t t 0 1 χ∼ H 0 1 χ∼ W → 0 2 χ∼ + 1 χ∼ Run-1 threshold No upgrade threshold
ATLASSimulation Preliminary
Threshold [GeV]
0 20 40 60 80 100
Rate [Hz] 3 10 4 10 5 10 6 10 7 10 EM Trigger
Isolated EM Trigger (EM_VH)
ATLAS Simulation
Figure 1: The impact ofpTthreshold on acceptance fraction of a few processes (left) and trigger rate
for the Level-0 electron trigger (right) for ATLAS at the HL-LHC [2, 3].
2 The ATLAS Phase II Upgrade
The ATLAS detector will be upgraded to make the most out of the HL-LHC. Large parts of the tracker will reach their end of life shortly after 2020 and must be replaced. Therefore, a project to develop a complete replacement of the tracker is in progress. This opens up the possibility of using data from the tracker in the trigger, as described below.
2.1 Trigger Architecture
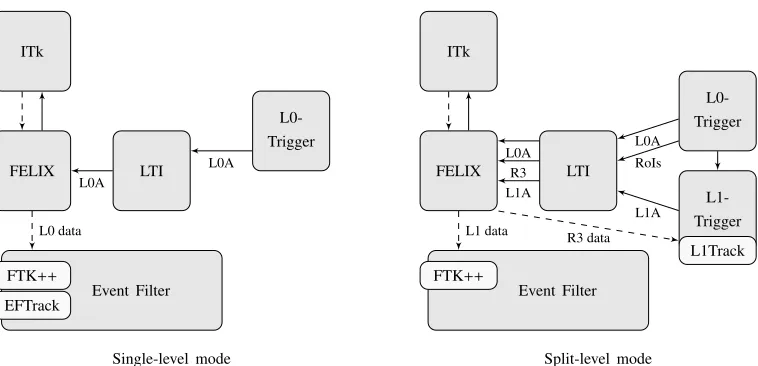
The ATLAS trigger will consist of a hardware trigger, which uses hardware on and close to the de-tector, followed by the Event Filter, which is a software trigger running on a computer farm. Current hardware trigger systems, based on calorimeter and muon information, will change to cope with higher trigger rates and will represent the so-called L0 system. The hardware trigger will operate in a single-level (L0) mode but retain the option to evolve to a split-level (L0/L1) trigger. The architecture is presented in figure 2.
EFTrack. In the split-level mode, it contributes to the event rejection before the Event Filter, in the so-called L1 trigger, and is called L1Track. The hardware is the same in both cases, but L1Track has a strict latency requirement and gains speed by increasing parallelism at the expense of reduced momentum acceptance, as explained in section 3.1.1. A comparison of the two working modes is
pre-sented in table 1. The Event Filter will also be assisted by FTK++, which provides full-event tracks
at a rate of 100 kHz down to apTof 1 GeV. FTK++will not be discussed in this article; see Ref. [4]
for further details.
Table 1: Specifications for the regional track trigger when running as an Event Filter co-processor (EFTrack) and as an extra hardware trigger level (L1Track).
Trigger Latency requirement L0 rate [MHz] Trigger threshold [GeV]
EFTrack O(s) 1 2
L1Track 30μs 2–4 4
In the single-level mode, the muon and calorimeter triggers can issue a Level-0 Accept (L0A), which initiates full readout of all detectors at 1 MHz. In the split-level mode, L0A is running at a rate of 2–4 MHz and the Inner Tracker (ITk) modules in RoIs specified by the L0-trigger are read out at this rate following a Regional Readout Request (R3). The R3 data is sent to L1Track, which participates in the L1 decision (L1A) to start the full detector readout and Event Filter. The total L1 data rate consists of 10 % of the R3 data plus the Level-1 Accept (L1A) data. If the maximum total readout rate for the ITk is fixed at 1 MHz, then 600–800 kHz is left for L1A, since 200–400 kHz is expected to be consumed by R3, which is prioritised over L1A.
ITk
FELIX LTI
L0-Trigger
Event Filter
FTK++
EFTrack
Single-level mode
L0A L0A
L0 data
ITk
FELIX LTI
L0-Trigger
L1-Trigger
Event Filter
FTK++
L1Track
Split-level mode
L0A RoIs
L1A L0A
R3 L1A
R3 data L1 data
2.2 The Inner Tracker
The current ATLAS tracker will be completely replaced during the Phase II upgrade. The new ITk will be all-silicon and consist of pixel detectors close to the beam pipe and strip detectors at larger radii. The final layout is not decided yet, but the proposed layouts typically have a barrel with 5 pixel layers and 4 strip stereo-layers (closely-spaced layers, slightly inclined with respect to each other) and an endcap with coverage up to a pseudorapidity (η) of 4.
An important factor for the hardware track trigger is the time it takes to read out data from the ITk. If it takes too long, the buffers in the frontend electronics will get overfilled, which results in loss of data. The left plot in figure 3 shows the result of discrete event simulations of the latency at which 99 % of the event data is read out for the strip endcap in the single-level trigger mode, as a function of L0 rate. The baseline L0 rate is set to 1 MHz, which is below the point on the curve where the latency
starts to rapidly increase. At 1 MHz the latency is approximately 6μs for the module with highest
occupancy.
The readout latency in the split-level L0/L1 mode is presented in the right plot of figure 3 for the
module with the highest occupancy. The L1A latency is below 8μs for a L1A rate of 800 kHz with a
L0A rate of 2 MHz or a L1A rate of 600 kHz with a L0A rate of 4 MHz. In both cases the R3 latency is below 3μs, leaving time to process data for a track trigger decision.
L0 rate [kHz] 400 600 800 1000 1200 1400 1600 1800 2000
s]
μ
99% L0 latency [
1 2 3 10 20 30 2 10 2 10 × 2 ATLASSimulation
endcap disk 0 endcap disk 1 endcap disk 2 endcap disk 3 endcap disk 4 endcap disk 5
L0 rate [MHz]
0 2 4 6 8 10
s]
μ
99% latency [
0 2 4 6 8 10 12 14 16
1 MHz 900 kHz 800 kHz700 kHz
600 kHz 500 kHz 400 kHz 300 kHz 200 kHz 100 kHz ATLASSimulation L1A latency R3 latency Highest occupancy endcap hybrid
Figure 3: Latencies for the inner tracker strip detector as a function of L0 rate for the so-called
ex-tendedlayout. The left plot is showing the latencies for the endcap modules, including the mod-ule with highest occupancy, in the single-level L0 trigger mode. The red dotted line indicates the
boundary above which frontend buffers are starting to get overfilled. The right plot is showing the
highest-occupancy endcap module in the split-level L0/L1 trigger mode. The blue numbers indicate
the corresponding L1A rate. The figures are from Ref. [5] where further information can be found.
3 The Regional Track Trigger
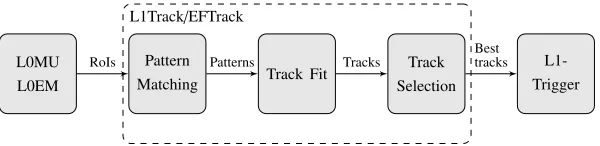
The L1Track/EFTrack trigger will provide fast regional hardware track triggering. As described in
section 2.1, the regional track triggering will either run as part of an extra trigger level after L0 (L1Track) or as part of the Event Filter (EFTrack). An overview of the system is presented in figure 4. The system conceptually consists of three parts: pattern matching using Associative Memory (AM) chips [6], track fitting of the full-resolution hits using Field Programmable Gate Arrays (FPGAs), and
presented in this section are for the ITk layout described in the ATLAS Phase-II upgrade Letter of Intent (Ref. [2]).
L0MU L0EM
L1Track/EFTrack
Pattern
Matching Track Fit
Track Selection
L1-Trigger
RoIs Patterns Tracks
Best tracks
Figure 4: Logical schematic of the L1Track/EFTrack trigger and the objects passed between the
system components.
3.1 Pattern Matching
The pattern matching step selects which hits to pass on to the track fitter. This is done using custom made AM ASICs that match the hits read out from the detector to predefined hit patterns from simu-lated tracks [7]. An alternative method using the Hough transform has also been studied.
3.1.1 Associative Memory
At each clock cycle the AM chip compares the input combination of hits with all the predefined pat-terns stored in the AM, and outputs the address of the matched patpat-terns, if any. In the regional
hard-ware track trigger, pixels and strips are combined into coarser-resolutionsuper-stripsand simulated
tracks of muons are used to generate patterns of super-strip hits. Data from the detector are sent to the AM chip and if it matches a pattern the associated ITk hits are sent to the track fitter.
The trigger uses 8 ITk layers, which can be a combination of strip and pixel layers. However, the occupancy of the innermost pixel layers is too high to be of use in the track trigger. It is assumed that each AM chip can contain half a million patterns, so that one million patterns can be stored
for eachΔη=0.2 byΔφ=0.21RoI using two AM chips. All the results showed here are under this
assumption. The set of patterns stored for an RoI is called apattern bank. Each pattern bank is trained
separately using a total of 30 million simulated muon tracks. The same pattern can occur more than once during training, so the patterns are sorted according to how many times they occur and only the 1 million most frequent ones are stored in the pattern bank.
In L1Track the number of patterns in the AM chips can be duplicated to speed up the matching. In EFTrack the duplication is not needed because there is no latency constraint in the Event Filter. The AM used for the duplicated pattern bank in L1Track can in EFTrack be used to expand the pattern
bank to cover apTdown to 2 GeV.
Ternary bits can be implemented in the AMs and used asdon’t care bits, i.e. a bit that matches
regardless of whether the input is a 0 or a 1.Don’t care bitscan be used to combine patterns that are
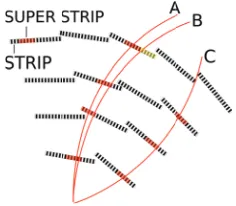
very similar to reduce the number of patterns needed. This is illustrated by track A and B in figure 5. Tracks with missing hits in one or two layers, such as track C in figure 5, can be handled using patterns withwild cardlayers, i.e. whole layers that match regardless of input.
The performance of the pattern matching has been studied for the central barrel region of 0.1< η <0.3 and 0.3< φ <0.5 using a detailed emulation of the tracking system. The study was
Figure 5: Patterns from tracks that only differ by one super-strip (track A and B) can be combined usingdon’t care bits. Tracks with a missing hit in one layer can be handled usingwildcard layers
(track C).
performed using single muon samples with the same track parameter distributions used for training, but embedded in 200 minimum bias events. The efficiency is shown in table 2, and is close to 99.5 % for both studied cases.
3.1.2 Hough Transform
The Hough transform is a possible alternative to using AM for the pattern matching step. One ad-vantage of the Hough transform is that it can be implemented in commercially available FPGAs and so does not require development of custom ASICs. In general, the Hough transform is used to detect features that can be described by a few parameters, such as lines and circles, in image-like data. It does so by mapping each data point to the set of all parameter values consistent with the data point and accumulating them in a histogram-like parameter space called anaccumulator. The point in the accumulator with the largest value corresponds to a candidate feature.
In the case of tracks of charged particles in the transverse plane of the ATLAS detector, the feature we are looking for is a circular arc. If the vertex is constrained to the collision point and if the track’s polar angleφ0is small, the track through a hit with the polar coordinates (r, ϕ) is described by
the transverse momentumpT, the charge of the particleq, andφ0by
A qpT
=φ0−ϕ
r , (1)
whereA ≈ 3×10⁻⁴GeV mm−1 is the curvature constant for the 2 T magnetic field in the ATLAS tracker. Figure 6 shows an illustration of applying equation 1 to a toy model of a tracker. The coordinates in the accumulator where the lines from the signal cross are the track parameters of that track.
An implementation of a Hough transform using equation 1 has been studied with the ATLAS ITk layout. Just as for pattern matching using AM chips, the method is looking at RoIs of sizeΔφ=0.2 by Δη=0.2 separately. The accumulator is implemented as a two-dimensional histogram withA/(qpT) on one axis andφ0 on the other. Each bin holds the information about which layers have been hit
x
y
φ0
A
/
(
qpT
)
Signal Other hits
Figure 6: An illustration of the Hough transform applied to hits along a track and hits not associated with a track in the transverse plane of a tracker. Hits on the same track are mapped to crossing lines in the parameter space.
To reduce the number of hits in each bin in the accumulator, the RoI is sliced up inz, as illustrated in figure 7, and an accumulator is filled for each slice. This greatly reduces the occupancy in the
A/(qpT) vs. φ0 accumulator space, which in turn reduces the number of hit combinations that the
track fitter needs to take into account. However, it comes at the cost of having more accumulators. There will also be an overlap between RoI slices. This makes it possible for one hit to end up in more than one hit group, which increases the number of hit combinations. In the end, it is a trade-off between the two effects.
z r
RoI slice RoI
ηmin η max
Figure 7: The RoI can be sliced up inzto reduce the occupancy in the Hough accumulator. The full RoI is given by the blue area in the figure (extending all the way from the left to the right), while a RoI slice is given by the red area.ηminandηmaxare the RoI boundaries in pseudorapidity.
The efficiency of the Hough transform has been simulated in the central barrel region of
0.1< η <0.3 and 0.3< φ <0.5. The study was performed using the same simulation samples used in
studying the performance of the pattern matching using AM chips. Just as for the AM-based system, eight ITk layers were used. It was found that slicing up the RoI in approximately 12 slices inzand having an accumulator with approximately 1200 bins inA/(qpT) and 50 bins inφ0produced good
3.2 Track Fitting
Track fitting is performed in an FPGA. It takes the full-resolution hits from the patterns passed by the
pattern matching and calculates the track parameters andχ2 of the fit. The track parameters piare
calculated using a linear interpolation:
pi= N
j=1
Ci jxj+qi (2)
wherexjare the full-resolution hit cluster positions and (Ci j,qj) are constants that are unique for each
sector (set of ITk modules). The constants are trained using simulated tracks of muons with the same track parameter ranges and distributions as used to train the patterns.
The simulated track fitting efficiency and the average number of fits for minimum bias events with
pile-up 200 is shown in table 2. Two detector layer configurations are used in the simulation, one with
8 strip layers only and one where a strip layer is replaced with the outer pixel layer. The efficiency
reaches above 99.5 % with respect to the events with a matched pattern.
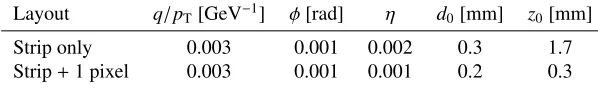
The track parameter resolutions, defined as the RMS of the residuals with the simulated true
particle, are presented in table 3 for the central barrel region. The resolutions forpT,φ,η, and the
impact parameterd0are very similar for the strip only and strip plus one pixel case while the resolution
inz0, i.e. the coordinate of the interaction point along the beam axis, is significantly improved by
using one pixel layer.
Table 2: Pattern matching (using AM chips) and track fitting efficiency for simulated muons of
pT>4 GeV in the central barrel region of 0.1< η <0.3 and 0.3< φ <0.5. The pattern matching
efficiency is defined as the fraction of single muon events with a matching pattern. The track fitting
efficiency is defined as the fraction of events selected by the pattern matching that has a successful fit
withχ2 <40. Also shown is the average number of track fits needed in minimum bias events with a
pile-up of 200. [9].
Detector layers Matching eff. Fitting eff. <Nfits>
Strip only 99.4 % 99.5 % 114
Strip+1 pixel 99.5 % 99.7 % 331
Table 3: Track parameter resolution for simulated muons ofpT>4 GeV embedded in 200 minimum
bias events in the central barrel region of 0.1< η <0.3 and 0.3< φ <0.5. The resolution is defined as the RMS of the residual between the fit and the simulated true particle track parameters [9].
Layout q/pT[GeV−1] φ[rad] η d0[mm] z0[mm]
Strip only 0.003 0.001 0.002 0.3 1.7
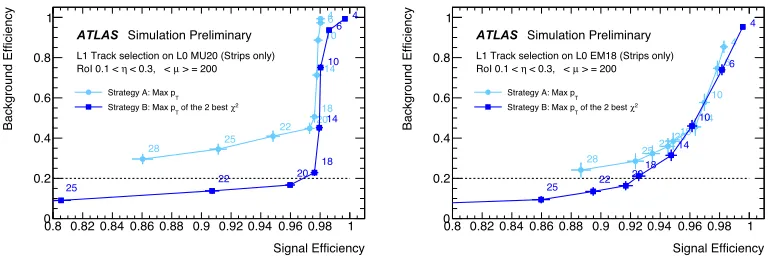
3.3 Trigger Selection
The track parameters and theχ2computed by the track fit can be used as trigger parameters.
Prelimi-nary studies on the trigger efficiency have been performed using two simple selection strategies. The
first one, strategy A, is selecting the maximumpTtrack while the second one, strategy B, selects the
maximumpTtrack of the two tracks with bestχ2.
Figure 8 shows the background versus signal trigger efficiency for events triggered by the muon
and electromagnetic triggers. The signal is represented by single muons (left) and electrons (right) as
described before, while the background is simulated by muons fromb-jets and jets respectively, with
the samepT distribution as expected by the L0 system (MU20 and EM18 respectively). The muon
seeded trigger reaches an efficiency of almost 98 % while rejecting 80 % of the background. The
elec-tromagnetic seeded trigger reaches close to 93 % efficiency while rejecting 80 % of the background.
Strategy B performs better than strategy A in both cases. By using more advanced strategies even bet-ter results are expected.
Signal Efficiency 0.8 0.82 0.84 0.86 0.88 0.9 0.92 0.94 0.96 0.98 1
Background Efficiency 0 0.2 0.4 0.6 0.8
1 46
10 14 18 20 22 25 28 4 6 10 14 18 20 22 25
ATLAS Simulation Preliminary
> = 200
μ
< 0.3, <
η
RoI 0.1 <
L1 Track selection on L0 MU20 (Strips only)
T
Strategy A: Max p
2
χ
of the 2 best
T
Strategy B: Max p
Signal Efficiency 0.8 0.82 0.84 0.86 0.88 0.9 0.92 0.94 0.96 0.98 1
Background Efficiency 0 0.2 0.4 0.6 0.8 1 4 6 10 14 18 20 22 25 28 4 6 10 14 18 20 22 25
ATLAS Simulation Preliminary
> = 200
μ
< 0.3, <
η
RoI 0.1 <
L1 Track selection on L0 EM18 (Strips only)
T
Strategy A: Max p
2
χ
of the 2 best
T
Strategy B: Max p
Figure 8: Signal efficiency vs. background efficiency when the track trigger is seeded by muons (left)
and by the electromagnetic calorimeter trigger (right). The data point labels show thepTcut applied
in GeV [5].
4 Summary and Outlook
ATLAS will use a single-level hardware trigger, running at a maximum rate of 1 MHz, based on muon and calorimeter information. The trigger can, with increasing luminosity or if new trigger demands arise, evolve into a two-level trigger with L1Track providing regional tracking at a rate up to 4 MHz. In the single-level trigger case the regional track trigger, here called EFTrack, will assist the Event
Filter. The readout latency of the tracker is below 10μs for both trigger scenarios, which is required
by the detector systems in ATLAS to avoid saturating frontend buffers.
The regional track trigger consists of a pattern matching step that selects hits followed by a track
fitting step. An efficiency of 99.5 % is reached by the pattern matching step (98.3 % for the alternative
method using the Hough transform) and 99.7 % for the track fitting. Preliminary studies on the track
selection shows a trigger efficiency of 98 % for a muon seeded track trigger and 93 % for a calorimeter
seeded track trigger with backgrounds reduced by a factor of 5.
The regional track trigger will continue to be studied and optimised based on detailed emulation
of the system. Studies of the impact of different proposed ITk layouts on the trigger performance are
References
[1] ATLAS Collaboration, JINST3, S08003 (2008)
[2] ATLAS Collaboration, Tech. Rep. CERN-LHCC-2012-022. LHCC-I-023, CERN, Geneva
(2012),https://cds.cern.ch/record/1502664
[3] A. Collaboration,Phase II TDAQ upgrade physics and performance public results, https://twiki.
cern.ch/twiki/bin/view/AtlasPublic/PhysicsAndPerformancePhaseIIUpgradePublicResults,
Ac-cessed: 2017-04-25
[4] ATLAS Collaboration, Tech. Rep. CERN-LHCC-2015-020. LHCC-G-166, CERN, Geneva
(2015),http://cds.cern.ch/record/2055248
[5] ATLAS Collaboration, Tech. Rep. CERN-LHCC-2017-005. ATLAS-TDR-025, CERN, Geneva
(2017),https://cds.cern.ch/record/2257755
[6] A. Annovi, M. Beretta, G. Calderini, F. Crescioli, L. Frontini, V. Liberali, S.R. Shojaii, A. Sta-bile (ATLAS Collaboration), Tech. Rep. ATL-DAQ-PROC-2016-017, CERN, Geneva (2016), http://cds.cern.ch/record/2228284
[7] ATLAS Collaboration, Eur. Phys. J. C70, 823 (2010),1005.4568
[8] M. Mårtensson (ATLAS Collaboration), Tech. Rep. ATL-DAQ-PROC-2016-034, CERN, Geneva
(2016),https://cds.cern.ch/record/2234837
[9] P.O.J. Gradin (ATLAS Collaboration), Tech. Rep. ATL-DAQ-PROC-2016-013, CERN, Geneva
![Figure 1: The impact of pT threshold on acceptance fraction of a few processes (left) and trigger ratefor the Level-0 electron trigger (right) for ATLAS at the HL-LHC [2, 3].](https://thumb-us.123doks.com/thumbv2/123dok_us/8134424.1355736/2.482.49.432.221.378/figure-threshold-acceptance-fraction-processes-ratefor-electron-trigger.webp)