Brain Tumor Stage Detection using Image
Processing from MRI Images
Sayali Sawant1, Saharsh Shivhare2, Omkar Pataskar3
B.E. Students, Department ofElectronics and Telecommunication, Pimpri Chinchwad College of Engineering College, Pune, India
ABSTRACT:Image inpainting is the process of restoring the lost or damaged regions or modifying the image contents imperceptibly. It refers to the process of filling-in missing data in a designated region of the visual input. In this paper, the technique presented is for detection and removal of text from images. The system detects text using morphological operations, connected component labelling and a set of selection criteria which helps to filter out non text regions. So, the resultant image is the image with only texts. Text Inpainting is done in two steps. The first step detects the text region automatically, without user interaction and in the second step; the text is removed from the image using exemplar based Inpainting algorithm.
KEYWORDS:Brain tumor, segmentation, stage, detection, MRI, image processing, K-means clustering
I. INTRODUCTION
Finding out tumour from MRI images is a time-consuming and a difficult task which is sometimes performed manually by medical experts. A lot of research and time has been put in by radiologist and doctors for identification of the tumor and segmenting it from other brain tissues. However, exact labelling of brain tumors is a time-consuming and tedious task. The proposed system takes into account the statistical features of the brain structure to represent it by significant feature points. Most of the early methods obtainable for tumor detection and segmentation may be largely divided into three groupings – Region-based, Edge-based and fusion-of-region methods. A well-known and broadly used segmentation technique is K-Means clustering algorithm. It is an unsupervised method based on neural network classifier. The time spent to segment the tumor gets condensed due to the detailed demonstration of the medical image by withdrawal of feature points. Region-based techniques look for the regions satisfying a given homogeneity standards and edge based segmentation methods look for edges between regions with different characteristics. Image segmentation is the process of partitioning a digital image into multiple segments which consist of sets of pixels. More precisely, image segmentation is the process of assigning a label to each and every pixel in an image such that the pixels with the same label share certain visual characteristics. The goal of segmentation is to simplify and/or change the representation of an image into something that is easier and more meaningful to analyse. In case of medical image segmentation, the aim is to:
Study anatomical structure
II. RELATED WORK
Paper 1: Detection of human brain tumour using MRI image segmentation and morphological operators
This paper deals with detection of brain tumor from MR images of the brain. The brain is the anterior most part of the nervous system. Magnetic Resonance Imaging (MRI) is the device required to diagnose brain tumor. The normal MR images are not that suitable for fine analysis, so segmentation is an important process required for efficiently analyzing the tumor images. Clustering is suitable for biomedical image segmentation as it uses unsupervised learning. This paper uses K-Means clustering where the detected tumor shows abnormality.It is then rectified using morphological operators along with basic image processing techniques to separate the tumor cells from the normal cells.
The Threshold and Watershed segmentation is very simple and popular. On applying morphological operators to the output image of the other two provided a better detection of tumor. The factor used in thresholding is very difficult to determine because the factor used for one image may not work for other image. This factor may be different for different images. The watershed method is highly sensitive to local minima, since at each minima, a watershed is created. If we have an image with noise, this will influence the segmentation. so we have not used it directly on our input images. The application of median filter and high pass filter in the initial stages also proved beneficial in removing noise from the MRI image which were then passed for further processing.
Paper 2: Brain Tumor Detection Using MRI Images
In this project we detect the brain tumor & classify the stages of the tumor by using testing & training the database. Segmentation for testing purpose is done by spatial FCM used. Most of these neural network-based algorithms require extensive supervision and training and their performance depends upon the training method and data used in training. Finally, it is desired from medical image segmentation and classification algorithms that they must have the following features: a) Accuracy, b) Reliability, c) Repeatability, d) Robustness and e) Least dependency on the operator.
Paper 3: Review of Brain Tumor Detection Using MRI Images
There are two images segmentation methods. First is cellular automata edge detection, and the second is Modified texture based region growing. Cellular automata provide clear and exact edge detection, combination of both enhances the tumor detection done by the individual methods such as cellular automata edge detection and modified texture based region growing. Region growing is the segmentation based on similarity criterion and edge detection is the segmentation based on discontinuity. Modified texture based region growing performs region growing by taking both the intensity and texture constrain into account. Brain tumor is a life-threatening diseaseand hence its detection should be fast and accurate. MRI images are very important for detecting the existence and outlines of tumors. Pre-processing is necessary to enhance the input MRI image. The work of physician is made easier by enhancement of images which gives quick judgment of images. For detecting the survival and outlines of tumors from the brain tissue in the MRI, is very important, therefore combination of both modified texture based region growing and cellular automata edge detection is used for detection of brain tumor. Cellular automata provide clear and exact edge detection.
Paper 4: Brain Tumor MRI Image Segmentation and Detection in Image Processing
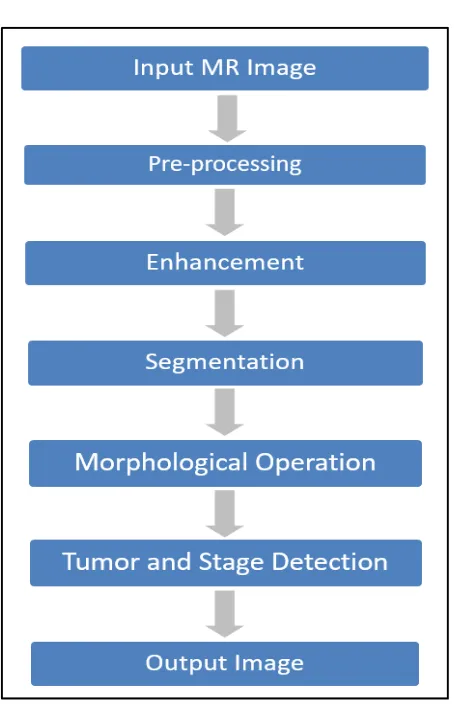
III. METHODOLOGY
Table 1:Flowchart of Methodology
The table above describes the methodology of the proposed system which is explained in detail below. MR image is taken as an input to the system where it undergoes few pre-processing methods like noise removal and gray scale conversion. K-means Clustering technique is used for segmenting the tumor and obtaining the required output. Area of the tumor is then calculated to determine the stage of the tumor.
3.1 MRI Image:
Figure 1: MRI Image
The above MRI image is obtained from the MRI scan performed on the human brain. The image is then further converted to a gray scale image to undergo pre-processing.
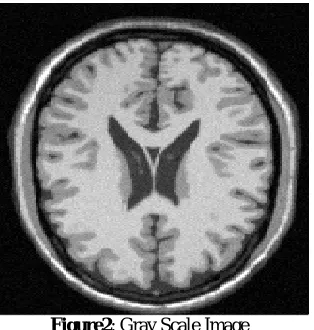
3.2 Gray scale image:
A grayscale or greyscale image is one in which the value of each pixel is a single samplerepresenting only an amount of light,it carries only intensity information. Images of this sort, also known as black-and-white or monochrome, are composed exclusively of shades of gray, varying from black at the weakest intensity to white at the strongest.
Figure2: Gray Scale Image
The image is converted into grayscale for simplicity. Smaller data enables to do more complex operations in a shorter time. However, grayscale is going from a 3D space (R,G & B) to a 2D space (B & W).
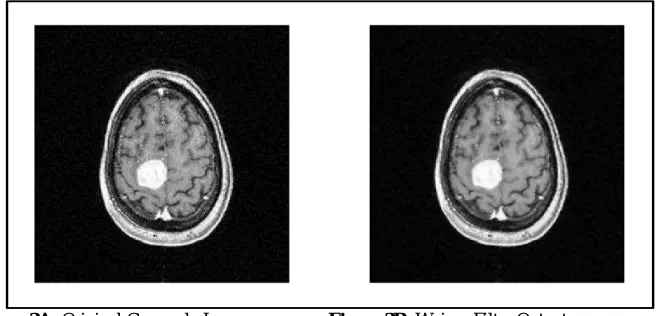
3.3 Weiner Filtering:
An image filter is a technique through which size, colors, shading and other characteristics of an image are altered. The image filtering process includes options such as:
Adjusting image brightness
Adding effects to the image
Changing the texture
It was observed that Wiener filter deconvoluted the image and reduced noise better than other two tested filters, Gaussian and Weiner.
Figure 3A: Original Grayscale Image Figure 3B: Weiner Filter Output
In the figure above, figure 3A is the original grayscale image which is converted from the MR image. Figure 3B is the Weiner filter output where the Wiener filtering is applied to the image with a cascade implementation of the noise smoothing and inverse filtering.
3.4 Segmentation using K-means Clustering:
K-means clustering is a method of vector quantization, originally from signal processing, that is popular for cluster analysis in data mining. K-means clustering aims at partitioning observations into k-clusters in which each observation belongs to the cluster with the nearest mean, serving as a prototype of the cluster. This results in a partitioning of the data space into Voronoi cells.Key features of k-means are often regarded as its biggest drawbacks:
Euclidean distance is used as a metric and variance is used as a measure of cluster scatter.
The number of clusters k is an input parameter
Algorithm:
1. Specify the number of clusters ‘k’ required. 2. Randomly choose k centroids from the data set.
3. Find the Euclidean distance of the data points from the centroid. 4. Assign the data point to the cluster that is nearest to the centroid.
5. Calculate the new centroid by taking the mean of the data points available in cluster. 6. Repeat until we get the same centroid.
Steps for K-means Clustering:The working of the algorithm is as follows:
1) Random selection of few data points:
The algorithm randomly selects a few data points as highlighted below:
Figure4: Data points
Figure 4 shows the random data points selected by the algorithm to form clusters. As K-means is an unsupervised algorithm, the data point selection is done by the algorithm randomly.
2) Select number of clusters required:The algorithm takes input from the user and selects number of specified clusters
Figure 5 pictures three random centroids selected by calculating the Euclidean distance of the data points from the centroid. It assigns the data point to the cluster that is nearest to the centroid.
3) Clusters formed:
The clusters are grouped into three colors namely red, yellow and blue.
Figure6: Clusters formed
Figure 6 shows the new centroid taken by calculating the mean of the data points available in cluster. This process is continued continuously until the algorithm gives the same centroid.
3.5 Morphological operation:
Opening is the dilation of the erosion of a set A by a structuring element B:
where and denote erosion and dilation, respectively.
IV.EXPERIMENTALRESULTS
After K-means clustering, we calculated the area of the segmented tumor and approximated it to average size of tumor calculated for different stages. It was observed that the proposed system was justified for 98% of the given input images.
Below are the images of the MATLAB results obtained for the code designed:
Stage 2 tumor:
In the figure above Stage 2 tumor has been detected. Its calculated area is 445.5000
Figure 1 in the image shows the original image and figure 5 shows the detected tumor after segmentation and morphological operation.
These tumors do not have actively dividing cells or dead cells in the tumor, called necrosis, but show many abnormal cells. A stage 2 tumor can be an astrocytoma, ependymoma, or oligodendroglioma.
Stage 3 tumor:
Figure8: MATLAB output for stage 3 tumor
In the figure above, stage 3 tumor has been detected. Its calculated area is 779.
Figure 1 in the image shows the original image and figure 5 shows the detected tumor after segmentation and morphological operation.
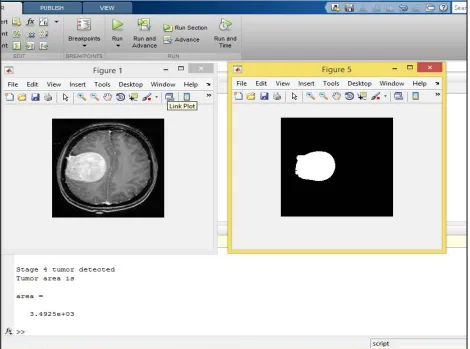
Stage 4 tumor:
Figure9: MATLAB output for stage 4 tumor
Stage 4 tumor has been detected. Its calculated area is 3.4925e+03.
Figure 1 in the image shows the original image and figure 5 shows the detected tumor after segmentation and morphological operation.
A stage 4 tumor is usually glioblastoma. Cells in the tumor are actively dividing. In addition, the tumor has bloodvessel growth and areas of dead tissue.
V. CONCLUSION
brain tumor and the stage of the tumor during diagnosis is made easy using K-means clustering and basic image processing over MRI images, using our program and algorithm.
REFERENCES
[1] Priyanka, Balwinder Singh, “A review onBrain Tumor Detection using Segmentation”, IJCSMC, Vol. 2, Issue. 7 July, 2013.
[2] Simran Arora, Gurjit Singh, “A Study of Brain Tumor Detection Techniques”, International Journal of Advanced Research in Computer Science and Software Engineering, Volume 5, Issue 5, May 2015.
[3] Balakumar.B, Muthukumar Subramanyam, P.Raviraj Gayathri Devi .S,” An Automatic Brain Tumor Detection and Segmentation Scheme for Clinical Brain Images”, International Journal of Emerging Technologies in Computational an Applied Sciences (IJETCAS), IJETCAS 14-313; © 2014.
[4] Anupurba Nandi, “Detection of human brain tumour using MRI image segmentation and morphological operators”, 2015 IEEE International Conference on Computer Graphics, Vision and Information Security (CGVIS).
[5] Pranita Balaji Kanade, Prof. P.P. Gumaste, “Brain Tumor Detection Using MRI Images”, International Journal Of Innovative Research In Electrical, Electronics, Instrumentation And Control Engineering, Vol. 3, Issue 2, February 2015
[6] Vipin Y. Borole, Sunil S. Nimbhore, Dr. Seema S. Kawthekar, “Image Processing Techniques for Brain Tumor Detection: A Review”, International Journal of Emerging Trends & Technology in Computer Science (IJETTCS), Volume 4, Issue 5(2), September - October 2015. [7] Pratibha Sharma, Manoj Diwakar, Sangam Choudhary, “Application of Edge Detection for BrainTumor Detection”, International Journal of
Computer Applications, pp. 21-25, November 2012.
[8] Miss Hemangi S. Phalak, Mr. O. K. Firke, “Review Of Brain Tumor Detection Using MRI Images”, International Journal for Research in Applied Science & Engineering Technology (IJRASET), Volume 4 Issue III, March 2016