1Unit of Pharmacology, Faculty of Pharmacy, AIMST University, Semeling, Bedong 08100, Kedah, Malaysia
2Unit of Pharmaceutical chemistry, Faculty of Pharmacy, AIMST University, Semeling, Bedong 08100, Kedah, Malaysia
ABSTRACT
Objective: To develop a new, rapid and sensitive RP-HPLC method for the estimation of morin in human plasma by protein precipitation method (PPT) because of more recovery. Method: Chromatographic separation was carried out on a reverse phase C18 column using mixture of 10 mM potassium dihydrogen phosphate (pH 5.0) and acetonitrile (60:40, v/v) at a flow rate of 1.0 ml/min with UV detection at 260 nm. The method was validated and found to be linear in the range of 100 -500 ng/ml. Results: The degree of reproducibility of the results obtained as a result of small deliberate variations in the method parameters and by changing analytical operator has proven that the method is robust and rugged. The present method is suitable in terms of precise, accurate and specific during the study. Conclusion: The simplicity of the method allows for application in laboratories that lack sophisticated analytical instruments which are complicated, costly and time consuming rather than a simple HPLC–UV method. The present method was successfully applied for bioavailability and bioequivalence studies and pharmacokinetic profile studies.
Key words: Application to PK profile studies, Method development, Morin and validation.
*Address for correspondence:
Dr. Selvadurai Muralidharan, Unit of Pharmaceutical chemistry, Faculty of Pharmacy, Semeling-08100, Bedong, Kedah, Malaysia. E-mail : [email protected]
Access this article online Journal Sponsor
Website:
www.jyoungpharm.org
DOI:
10.5530/jyp.2015.3.9
INTRODUCTION
Flavonoids are a large class of compounds consisted of A and C rings of benzo-1-pyran-4-quinone and a Bring, and
further sub classified as flavones (basic structure), flavonols (having a hydroxyl group at the 3-position), isoflavones (B ring binds to the 3-position), flavanones (2–3 bond is saturated), and catechins (C-ring is 1-pyran), chalcones
(C-ring is opened), and anthocyanidins (C-ringis 1-pyran,
and 1–2 and 3–4 bonds are unsaturated). It has many substituents such as hydroxyl and/or methoxyl groups.
Flavones can prevent many diseases including cancers
through antioxidative action and/or the modulation of several enzyme functions. Example, they may reduce
coronary heart disease mortality1 by suppressing the oxidation of low-density lipoprotein.2 Anticarcinogenic activity of flavones is expressed by their agonism and/
or antagonism of carcinogenesis-related receptors
such as epidermal growth factor,3 arylhydrocarbon
receptor4 and estrogen receptor β.5 The secretion of
cytokines,6–8 and expression of protein kinases in tumor
Morin is typical representative of flavonoids which bears most of their physiological functions. Hence, it is of
interest to develop simple, accurate and precise method
for the determination of morin in human plasma. So
far, only limited analytical methods such as thin-layer chromatography,11 gas chromatography,12 capillary electrophoresis,13–17 electrochemical measurements,18 high-performance liquid chromatography (HPLC). HPLC method was most commonly used to separate and analyse flavonoids because of its more accurate and precision. As a reference method we used modified RP-HPLC determination of morin based on extraction of morin from human plasma samples with trichloroacetic acid. Literature
survey reveals that no simple, rapid and reproducible methods so far reported for the development of morin in
human plasma. The objective of the present investigation was to develop a new, rapid and sensitive RP-HPLC method for the estimation of morin in human plasma. In the present study, a more sensitive, and precise method was to be developed and applied to the pharmacokinetic study.
EXPERIMENTAL
Materials and reagents
Morin Hydrate (99.65%) reference standard was procured
from Sigma Aldrich Pvt Ltd. (Mumbai, India). Acetonitrile
(HPLC grade) was obtained from Merck, Germany. trichloro acetic acid was obtained from Systerm Malaysia. Methanol obtained from QREC and HPLC grade water was used throughout the study.
Equipment
HPLC chromatographic separation was performed on a Shimadzu liquid chromatographic system equipped with a LC-20AD solvent delivery system (pump), SPD-20A photo diode array detector, and SIL-20ACHT injector. LC solution version 1.25 was applied for data collecting and processing (Shimadzu, Japan).
Preparation of the calibration standards and quality control (QC) samples
The stock solution of morin was prepared in methanol at
a concentration of 1.0 mg/ml. The working solution of
100.0 ng/mlwas prepared by appropriately diluting the
stock solution of morin. Morin working solution was used to prepare the spiking stock solutions for construction of
six-point calibration curve (100.0 - 500.0 ng/ml) and QC
samples at three different levels (100.0, 300.0, 500.0 ng/
ml). All the stock solutions were refrigerated (2-8°C) when
not in use. Calibration standards and QC samples were
prepared in bulk by spiking 250.0 μl of respective spiking
stock solutions to 250.0 μl of human plasma and then
Chromatographic conditions
The samples were chromatographed on a Princeton
SPHER C18 (250 x 4.6 mm i.d., 5 m) column with a flow rate of 0.9 ml/min. The mobile phase used was acetonitrile – potassium dihydrogen phosphate (60:40 % v/v). potassium
dihydrogen phosphate used was 20 mM solution in water
with pH being adjusted to 5.0 with orthophosphoric acid solution. The injection volume was 20.0 μl. The UV-visible detector was set at 260 nm.
Validation
The method has been validated19 for selectivity, sensitivity, recovery, linearity, precision, accuracy and stability.
Selectivity
The selectivity of the method was evaluated by comparing
the chromatograms obtained from the sample containing
morin standard with those obtained from blank samples.
Sensitivity
Sensitivity was determined in terms of LLOQ (Lower Limit of Quantification) where the response of LLOQ was at least five times greater than the response of interference in blank matrix at the retention time or mass transitions of the analyte.
Linearity
For linearity, different concentrations of standard solution
were prepared to contain 100.0 ng m L-1to 500.0 ng/ml of morin. These solutions were analyzed and the peak areas and response factors were calculated. The calibration curve was plotted using response factor vs. concentration of the standard solutions. Standard curve fitting was determined
by applying the simplest model that adequately describes
Stability Studies
Stability study was carried out at room temperature stock
solution stability, refrigerated stock solution stability, freeze
thaw stability, short term stability and long term stability were determined. Room temperature stock solution stability was carried out at 0, 3 and 8 hours by injecting four
replicates of prepared stock dilutions of morin equivalent to middle quality control sample concentration and the
stock dilution equivalent to the working concentration. Refrigerated stock solution stability was determined at 7, 14 and 21 days by injecting 4 replicates of prepared
stock dilutions of the analyze equivalent to the middle
quality control sample concentration. The stability studies of plasma samples spiked with morin were subjected to three freeze - thaw cycles, short term stability at room temperature for 3 h and long term stability at –70oC over four weeks. Stability of standard solutions was performed
at room temperature over 6 h and after freezing for four
weeks has also been carried out. The stability of triplicate spiked human plasma samples following three freeze thaw cycles was analyzed. At room temperature for 1.00 to 3.00 h before extraction the stability of triplicate short term samples spiked with morin was investigated. The plasma samples for long term stability were stored in the freezer at 700C until the time of study.
RESULTS AND DISCUSSION
Selectivity
Sensitivity
The sensitivity of the experiment was carried out at LLOQ level. The average percentage deviation from the nominal concentration was less than 10%.
Linearity and Recovery studies
The calibration curves were linear over the range of
100.0-500.0 ng mL-1. The correlation coefficient was > 0.9996.
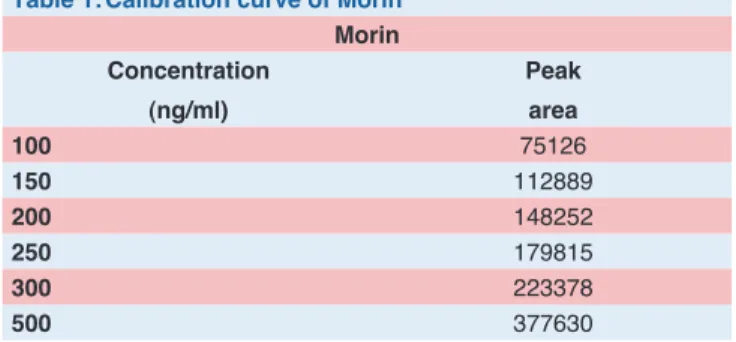
Calibration curve data of morin result shown in Table 1.
Recovery studies presented in Table 2 Figure. 3.
Precision and Accuracy
Both intra-day and inter-day accuracy and precision of the
method were determined by analysis of the control human
plasma spiked with morin at LLOQ, LQC, MQC and HQC. All QCs concentration was calculated using the calibration curve. The accuracy and precision of the method were
described as a percentage bias and the percentage relative
standard deviation, respectively Table 3.
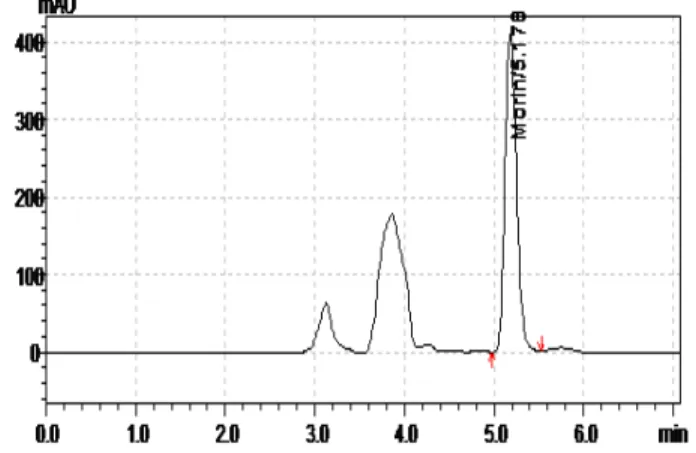
Speed of Analysis
The analysis is performed within 11 min in which 5 min for extraction of plasma and 6 min for chromatography Figure 4.
System suitability
System suitability test was performed daily before the
run of analytical batch to check detector response to the
analyze. Both the formulations were well tolerated by all
Figure 1:Typical chromatogram of blank plasma Figure 2:Typical chromatogram of standard solution
Table 1:Calibration curve of Morin
Morin Concentration
(ng/ml)
Peak area
100 75126
150 112889
200 148252
250 179815
300 223378
500 377630
Table 2:Results of analysis of recovery studies in human
plasma
Drug Prepared Concentration
(ng/ml)
% Recovery
Morin
100 89.56
300 90.52
500 91.02
Table 3: Intraday and interday precision studies of Morin in human plasma
Intraday studies Interday studies
100 300 500 100 300 500
(ng/ml) (ng/ml)
Mean 98.7268 298.8793 499.0173 98.8039 298.7657 499.3013
SD 0.811 0.346 0.263 0.691 0.786 0.33
%CV 0.822 0.116 0.052 0.699 0.263 0.066
Figure 3: Calibration curve of Morin in blank human plasma Figure 4:Typical chromatogram of spiked solution
Table 4: System suitability studies
Parameters Morin
Theoretical plate/meter 4985
Asymmetric factor 0.91
LOD (ng/ml) 50
LOQ (ng/ml) 100
Table 5:Stability Study of Morin in Human Plasma
Concentration (ng/ml) (n = 6)
Concentration found (mean ± S.D.) (ng/
ml)
% CV
Short-term stability (1, 2, 3 h)
100 99.85±0.43 3.10
500 498.63±1.25 1.95
Long-term stability (4 weeks)
100 98.96±1.04 4.17
500 498.75±1.15 1.96
Stock Solution Stability
100 99.54±0.97 2.96
500 499.63±1.24 1.09
Freeze thaw Stability (3 Cycle)
100 98.99±1.27 3.87
500 499.02±0.59 2.12
Auto Sampler Stability
100 99.52±0.85 2.89
500 499.97±0.49 1.856
Stability of Morin in Plasma (20ºC)
100 99.63±0.75 3.19
500 499.67±1.07 1.27
the volunteers in both the phases of study Table 4.
Stability
Analysis of the stock solution was performed at 100.0 ng/ml. After storage for 15 days at 2-8°C and at room
temperature for 6h, more than 97.5% of morin remained
unchanged, based on peak areas in comparison with
freshly prepared solution of morin (100.0 ng/ml) This
suggests that the morin in standard solution is stable for at least 15 days when stored at 2-8°C and for 6 h at room temperature.
Bench top stability of morin in plasma was investigated at LQC and HQC levels. This revealed that the morin in plasma was stable for at least 6 h at room temperature. It was confirmed that repeated freezing and thawing (three cycles) of plasma samples spiked with morin at LQC and HQC level did not affect the stability of morin Long term stability of the morin in plasma at -70°C was also performed after 30 days of storage at LQC, HQC levels.
The results of the stability studies are shown in Table 5.
The above results indicated that the morin was stable in the studied conditions.
CONCLUSION
A simple and sensitive method for morin in human plasma
REFERENCES
1. Hertog MGL, Kromhout D, Aravanis C, Blackburn H, Buzina R, Fidanza F, Giampaoli S, Jansen A, Menotti A, Nedeljkovic S, Pekkarinen M, Simic BS, Toshima H, Feskens EJM, Hollman PCH, Katan MB. Flavonoid intake and long-term risk of coronary heart disease and cancer in the Seven Countries Study. Arch. Intern. Med. 1995; 155: 381–86.
2. Meyer AS, Heinonen M, Frankel EN. Antioxidant interactions of catechin, cyanidin, caffeic acid, quercetin, and ellagic acid on human LDL oxidation. Food Chem. 1998; 61: 71–75.
3. Agullo G, Gamet-Payrastre L, Manenti S, Viala C, Remesy C, Chap H, Payrastre B. Relationship between flavonoid structure and inhibition of phosphatidylinositol 3-kinase: a comparison with tyrosine kinase and protein kinase C inhibition.Biochem. Pharmacol. 1997; 53:1649–57.
4. Ashida H, Fukuda I, Yamashita T, Kanazawa K. Oxidation and Antioxidants in Organic Chemistry and Biology. FEBSLett. 2000; 476: 213–17.
5. An J, Tzagarakis-Foster C, Scharschmidt TC, Lomri N, Leitman DC. Estrogen receptor beta-selective transcriptional activity and recruitment of coregulators by phytoestrogens. J. Biol. Chem. 2001; 276: 17808–814.
6. Lepley DM, Pelling JC. Induction of p21/WAF1 and G1 cell-cycle arrest by the chemopreventive agent apigenin. Mol. Carcinog. 1997; 19: 74–82.
7. Xagorari A, Papapetropoulos A, Mauromatis A, Economou M, Fotsis T, Roussos C. Luteolon Inhibits an Endotoxin-Stimulated Phosphorylation Cascade and Proinflammatory Cytokine Production in Macrophages. J. Pharmacol. Exp. Ther. 2001; 296: 181–87.
8. Bhatia N, Agarwal R. Detrimental effect of cancer preventive phytochemicals silymarin, genistein and epigallocatechin 3-gallate on epigenetic events in human prostate carcinoma DU145 cells. Prostate. 2001; 46: 98–107.
9. Nagasaka Y, Nakamura K. Spectrofluorimetric and HPLC Determination of Morin in Human Serum. Biochem. Pharamcol. 1998; 56: 1151–55.
10. Kobuchi H, Roy S, Sen CK. H. Nguyen HG, Packer L, Quercetin inhibits inducible ICAM-1 expression in human endothelial cells through the JNK pathway., Am. J. Physiol. 1999; 277: C403–C11. 11. Yang XF, Wang F, Hu SS. Spectroscopic studies on the interaction
between troxerutin and bovine serum albumin. Colloid Surf. 2006; B 52: 8–13.
12. Proestos C, Boziaris IS, Nychas GJE, Komaitis M. Analysis of flavonoids and phenolic acids in Greek aromatic plants: Investigation of their antioxidant capacity and antimicrobial activity. Food Chem. 2006; 95: 664–71.
13. Polasek M, Petriska I, Pospisilova M, Jahodar L. Stacking - nonaqueous capillary electrophoresis simultaneous determination of salicylic acid, cinnamic acid, ferulic acid and vanilloid. Talanta. 2006; 69: 192–96.
14. Ch L. Chang, Sun SW. Micellar electrokinetic chromatography for separation of a mixture of coptis alkaloids, scute flavonoids, and rhubarb anthraquinones and bianthrones. J. Pharm. Biomed. Anal. 2006; 40: 62–67.
15. Liu JJ, Li SP, WangYT. Optimization for quantitative determination of four flavonoids in Epimedium by capillary zone electrophoresis coupled with diode array detection using central composite design. J. Chromatogr. A 2006; 1103: 344–49.
16. Domenech-Carbo A, Domenech-Carbo, MT Sauri- Peris MC, Electrochemical identification of flavonoid dyes in solid work of art samples by abrasive voltammetry at paraffin-impregnated graphite electrodes. Talanta. 2005; 66: 769–82.
17. FDA Guidance for Industry (2001). Bioanalytical Method Validation, US Department of Health and Human Services, Food and Drug Administration, Centre for Drug Evaluation and Research (CDER), Center for Veterinary Medicine (CVM) May. Highlights of Paper
• Method was developed and validated as per FDA guidelines.
• The developed method has sensitivity and selectivity, faster run time (6 min) and lower sample requirements.
Author Profile
• Dr.S.Muralidharan has been completed M.Pharm and Ph.Din the Department of Pharmaceutical Analysis in Tamil Nadu Dr.MGRMedical University,India.Presently working as a Senior Lecturer in Faculty of Pharmacy, AIMST University, Malaysia.