967
Available online at http://ijdea.srbiau.ac.ir
Int. J. Data Envelopment Analysis (ISSN 2345-458X)
Vol.4, No.2, Year 2016 Article ID IJDEA-00424, 18 pages
Research Article
Presentation of a Novel Integrated DEA-BSC Model
with Network Structure in Multi Objective Programmig
Kianoosh Kianfar
a, Mahnaz Ahadzadeh Namin
b*
, Akbar Alam Tabriz
c, Esmaeil
Najafi
a, Farhad Hosseinzadeh Lotfi
d(a) Department of Industrial Engineering, Science and Research branch, Islamic Azad University, Tehran, Iran.
(b) Department of Mathematics, Shahr-e-Qods Branch, Islamic Azad University, Tehran, Iran. (c) Department of Management, Shahid Beheshti University, Tehran, Iran.
(d) Department of Mathematics, Science and Research branch, Islamic Azad University, Tehran, Iran
Received 15 May 2016, Revised 2 July 2016, Accepted 20 July 2016
Abstract
Data envelopment analysis (DEA) is a nonparametric approach to estimate relative efficiency of Decision Making Units (DMUs). DEA and is one of the best quantitative approach and balanced scorecard (BSC) is one of the best qualitative method to measure efficiency of an organization. Since simultaneous evaluation of network performance of the quad areas of BSC model is considered as a necessity and separate use of DEA and BSC is not effective and leads to miscalculation of performance, integrated DEA-BSC model is applied. Regarding to multi-objective nature of the proposed model, two techniques including goal programming and weighted average method are used to solve such problems. At the end of the study, based on data relating to indexes of quad areas of BSC model, the results of the mentioned methods is compared. Besides assessing validation of the proposed model, the overall efficiency and each of the different stages of BSC is obtained. So that, finding a model for decision making units in various stages of BSC is the innovation of this research study.
Keywords: Data Envelopment Analysis; Balanced scorecard; Decision making units; Goal programming; Weighting objective function; Multi objective programming
*
Corresponding Author: [email protected]
968
1. Introduction
Nowadays, performance assessment of industrial and economical units plays important role in achieving their managerial success and continuous progress. In recent years, a number of sophisticated systems have been proposed to measure performance. Some of important ones are balanced scorecard [1], criteria for measurement system design [2], performance measurement matrix [3], computer aid manufacturing approaches [4]. Among these methods BSC is one of the most famous, comprehensive and simple performance assessment frameworks in many industries that provides both aspects of financial and non-financial, long-term and short-term strategies as well as internal and external business measures. The main strength of BSC is processing of the cause and effect relations between strategies by four significant perspectives including financial, customer, internal process, learning and growth. Data envelopment analysis (DEA) is a nonparametric method used to analyze and evaluate the performance of Decision Making Units (DMUs) which converts multiple inputs into multiple outputs and takes the qualitative and quantitative measures into account. In recent years, extensive application of DEA is observed in several contexts such as health care, education, manufacturing, retailing, banking, etc. In the conventional DEA model, two types of models namely 1) the aggregation and 2) separation approaches are applied to measure efficiencies. In the aggregation model, divisions
969 widespread application of BSC, several researches have criticized the limitation of BSC. They are: (1) several variables are involved in BSC model that causes complex optimization. (2) Common scale of measurement and benchmark for comparison of performance is not provided by BSC model. Therefore, the identification of proper goals for each of the performance indicators is difficult in practice. (3) BSC does not have a mathematical or quantitative model and objective weighting scheme for the performance measure. (4) BSC model is unable to determine the input and output variables. According to the aboved mentioned points, the integration of DEA with the BSC model can tackle the weakness of the BSC. Despite, the popularity of the DEA and the BSC approaches, there have been very few researches about the integration of these two models for evaluation of performance.
n DMUs is considered (j=1,…….,n) under assessment. Each DMU consumes m inputs (i=1,…, m) and produces s outputs (r=1,…,s), denoted by (xij,x2j,…., xmj) and (y1j, y2j,…., ysj)
respectively. The efficiency of DMUk can be calculated by the CCR and BCC models as Equations (1) and (2):
𝑀𝑎𝑥 𝐸𝑘 =
𝑢𝑟𝑦𝑟𝑘 𝑠
𝑟=1 𝑣𝑖𝑥𝑖𝑘 𝑚 𝑖=1
CCR (1)
𝑠. 𝑡. 𝑢𝑟
𝑠 𝑟=1
𝑣𝑖𝑥𝑖𝑗 𝑚 𝑖=1
≤ 1 , 𝑗 = 1,2, … , 𝑛
𝑢𝑟, 𝑣𝑖 ≥ 𝜀 , 𝑟 = 1,2, … , 𝑠 ; 𝑖 = 1,2, … , 𝑚
𝑀𝑎𝑥 𝐸𝑘 = 𝑢𝑟𝑦𝑟𝑘 − 𝑢𝑜
𝑠 𝑟=1
𝑣𝑖𝑥𝑖𝑘 𝑚 𝑖=1
BCC (2)
𝑠. 𝑡. 𝑢𝑟𝑦𝑟𝑗 − 𝑢0
𝑠 𝑟=1
𝑣𝑖𝑥𝑖𝑗 𝑚 𝑖=1
≤ 1 , 𝑗 = 1,2, … , 𝑛
𝑢𝑟, 𝑣𝑖 ≥ 𝜀 , 𝑟 = 1,2, … , 𝑠 ; 𝑖 = 1,2, … , 𝑚 𝑢0 Unrestricted in sign
In Equations (1) and (2), 𝐸𝑘 is the objective function which is maximized for every DMUk individually; ur and vi are weights of the outputs
and inputs respectively; Xik and Yrk are the i-th
input and r-th output of DMUk; and 𝜀 is a small positive value which indicates positive weights; u0 is the intercept of the production function in the BCC model.
970 measure the Large Local Bank (LLB) performance using the concepts of Kaplan and Norton, and the data from the bank. The cause-effect relationships between the non-financial, and the financial dimensions of the BSC was achieved. Ehsanbakhsh and Izadikhah [17] applied BSC-DEA model to evaluate an organization’s efficiency. DEA performs
optimization analysis on each individual unit (DMUs) and generates relative efficiency value of each DMU.
In this study, the DEA-BSC model is used by applying goal programming solution method and weighting objective function method for evaluating efficiency of 21 branches of National Bank and finding relations between the four perspectives of BSC model. The remainder of this paper is structured as follows: In section 2, general state of the integrated DEA-BSC model is discussed.
In section 3, our proposed integrated DEA-BSC
model and a causal relation between four perspectives of BSC model are evaluated. In section 4, two methods including weighting objective function and goal programming method for solving the proposed model are discussed. Results of the integrated DEA-BSC model for the mentioned methods are given in section 5. The conclusion section is given at the end of the paper.
2- General State of the Integrated DEA-BSC Model
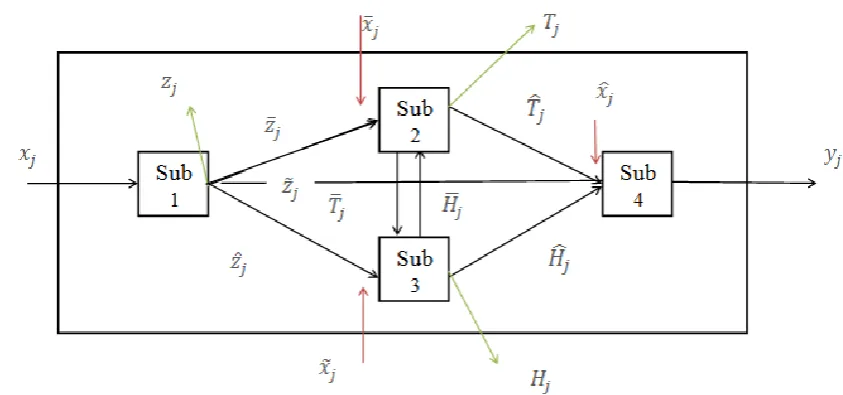
Assume n units under assessment (DMU) are given; j = 1, ..., n . Each unit has a network in the form of Figure 1 which includes 4 stage. It is assumed that the input 𝑥𝑗 entered to stage 1
and its output includes 𝑧𝑗 , 𝑧 𝑗, 𝑧 𝑗, 𝑧 𝑗 which are
output from the system, output that plays role of input of stage 2, output that plays role of input of stage 3, and output that plays role of input of stage 4 respectively. Now consider stage 2.
971 Assume that 𝑥 𝑗 is independent input of this
stage and its outputs are
𝑇
𝑗,
𝑇
𝑗 ,𝑇
𝑗 which areoutput from the subunit, output that plays role of input of stage 4, and output that plays role of input of stage 3. Furthermore, assume that 𝑥 𝑗 is
independent input of stage 3 and
𝐻
𝑗,
𝐻
𝑗,
𝐻
𝑗 areoutputs from stage 3 which are output from the system, output that plays role of input of stage 2, and output that plays role of input of stage 4. Also, assume that, 𝑥 𝑗 is independent input of stage 4 and 𝑦𝑗 is output of this subunit.Input of stage 1: 𝑥𝑗 = (𝑥1𝑗, 𝑥2𝑗, … , 𝑥𝑚𝑗)
Independent input of stage 2: 𝑥 𝑗 = (𝑥 1𝑗, 𝑥 2𝑗, … , 𝑥 𝑚 𝑗)
Independent input of stage 3: 𝑥 𝑗 = (𝑥 1𝑗, 𝑥 2𝑗, … , 𝑥 𝑚 𝑗)
Independent input of stage 4: 𝑥 𝑗 = (𝑥 1𝑗, 𝑥 2𝑗, … , 𝑥 𝑚 𝑗)
Output of stage 1: 𝑧𝑗 = (𝑧1𝑗, 𝑧2𝑗, … , 𝑧𝑝𝑗)
Output of stage 1 that playes role of input of stage 2 : 𝑧 𝑗 = (𝑧 1𝑗, 𝑧 2𝑗, … , 𝑧 𝑝 𝑗)
Output of stage 1 that playes role of input of stage 4: 𝑧 𝑗 = (𝑧 1𝑗, 𝑧 2𝑗, … , 𝑧 𝑝 𝑗)
Output of stage 1 that playes role of input of stage 3: 𝑧 𝑗 = (𝑧 1𝑗, 𝑧 2𝑗, … , 𝑧 𝑝 𝑗)
Output of stage 2 :𝑇𝑗 = (𝑡1𝑗, 𝑡2𝑗, … , 𝑡𝑞𝑗)
Output of stage 2 that playes role of input of stage 3:𝑇 𝑗 = (𝑡 1𝑗, 𝑡 2𝑗, … , 𝑡 𝑞 𝑗)
Output of stage 1 that playes role of input of stage 4: 𝑇 𝑗 = (𝑡 1𝑗, 𝑡 2𝑗, … , 𝑡 𝑞𝑗)
𝐻𝑗 = (ℎ1𝑗, ℎ2𝑗, … , ℎ𝑠𝑗) output of stage 3 :
Output of stage 3 that playes role of input of
stage 2: 𝐻 𝑗 = (ℎ 1𝑗, ℎ 2𝑗, … , 𝑥 𝑠 𝑗)
Output of stage 3 that playes role of input of stage 4: 𝐻 𝑗 = (ℎ 1𝑗, ℎ 2𝑗, … , ℎ 𝑠 𝑗)
Output of stage 4: 𝑦𝑗 = 𝑦1𝑗, , 𝑦2𝑗 … , 𝑦𝑟𝑗 ; j = 1, … , n Note that in some BSC
networks, some relations between the stages may not be available. In this section it is assumed that all relations are established between the subunit. Efficiency of each subunit is as follows:
𝑒𝑗(1)
= 𝑤𝑖𝑧𝑖𝑗 + 𝑤𝑖𝑧 𝑖𝑗 + 𝑤𝑖𝑧 𝑖𝑗 + 𝑤𝑖𝑧 𝑖𝑗 𝑝 𝑖=1 𝑝
𝑖=1 𝑝
𝑖=1 𝑝
𝑖=1
𝑣𝑖𝑥𝑖𝑗 𝑚 𝑖=1
=𝑒𝑗 (1)𝑦
𝑒𝑗 1 𝑥 (3)
𝑒𝑗(2)= 𝜇𝑖𝑡𝑖𝑗 + 𝜇 𝑖𝑡 𝑖𝑗+ 𝜇 𝑖𝑡 𝑖𝑗 𝑞 𝑖=1 𝑞
𝑖=1 𝑞
𝑖=1
𝑣 𝑖𝑥 𝑖𝑗 + 𝑤 𝑖𝑧 𝑖𝑗+ 𝑠 𝛼 𝑖ℎ 𝑖𝑗 𝑖=1 𝑝
𝑖=1 𝑚
𝑖=1
=𝑒𝑗 (2)𝑦
𝑒𝑗 2 𝑥 (4)
𝑒𝑗(3)= 𝛼𝑖ℎ𝑖𝑗 + 𝛼 𝑖ℎ 𝑖𝑗 𝑠
𝑖=1 +
𝑠
𝑖=1 𝑠 𝑖=1𝛼 𝑖ℎ 𝑖𝑗
𝑣 𝑖𝑥 𝑖𝑗 𝑚
𝑖=1 + 𝑚 𝑖=1𝑤𝑖𝑧 𝑖𝑗 + 𝑞 𝑖=1𝜇 𝑖𝑡 𝑖𝑗
=𝑒𝑗 (3)𝑦
𝑒𝑗(3)𝑥 (5) 𝑒𝑗(4)
= 𝑢𝑖𝑦𝑖𝑗
𝑟 𝑖=1
𝑣 𝑖𝑥 𝑖𝑗 + 𝑤 𝑖𝑧 𝑖𝑗+ 𝑠 𝛼 𝑖ℎ 𝑖𝑗 + 𝑞 𝑖=1𝜇 𝑖𝑡 𝑖𝑗 𝑖=1
𝑚 𝑖=1 𝑚
𝑖=1
=𝑒𝑗 (4)𝑦
𝑒𝑗(4)𝑥 (6)
Also, efficiency of 𝐷𝑀𝑈𝑗 can be calculated from the following equation.
𝑒𝑗
= 𝑤𝑖𝑧𝑖𝑗 + 𝜇𝑖𝑡𝑖𝑗 + 𝛼𝑖ℎ𝑖𝑗 + 𝑢𝑖𝑦𝑖𝑗 𝑠 𝑖=1 𝑠
𝑖=1 𝑞
𝑖=1 𝑝
𝑖=1 𝑣𝑖𝑥𝑖𝑗 𝑚
𝑖=1 + 𝑚 𝑖=1𝑣 𝑖𝑥 𝑖𝑗 + 𝑖=1𝑚 𝑣 𝑖𝑥 𝑖𝑗 + 𝑚 𝑖=1𝑣 𝑖𝑥 𝑖𝑗
=𝑒𝑗 𝑦
𝑒𝑗𝑥 (7)
972 coming out of –jth have been taken into account and internal relations between stages are not considered. The following models can be used to calculate the efficiency of the DMU. Model (8) is a 4-objective model which is expressed as follows.
𝑚𝑎𝑥 𝑒𝑜(1) (8)
𝑚𝑎𝑥 𝑒𝑜(2)
𝑚𝑎𝑥 𝑒𝑜(3)
𝑚𝑎𝑥 𝑒𝑜(4)
s.t. 𝑒𝑗(𝑖)≤ 1 ; i=1,2,3,4 ; j=1,…, n
Assume that all weights greater than or equal to zero
and; (9) Max 𝑒𝑜 (𝑖) s.t. 𝑒𝑗(𝑖)≤ 1 ; i=1,2,3,4 ; j=1,…, n
3- The New Proposed Integrated DEA-BSC Model
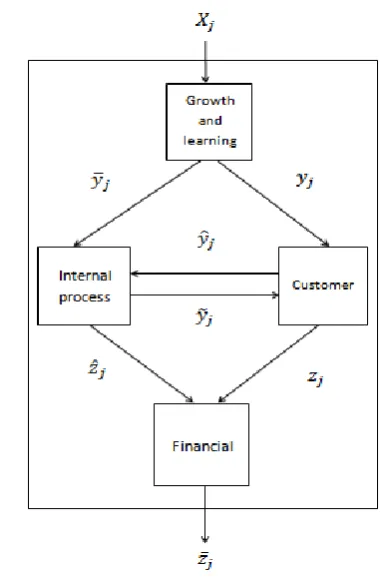
In the present study an integrative BSC-DEA approach has been used. goal programming and weighting objective function methods are applied in order to evaluate relative efficiency of decision making units which includes 21 Melli bank branches in west of Tehran and find relations between the four perspectives of the balanced scorecard (growth and learning, internal process, customer, financial). The Balanced Scorecard (BSC) is used as a tool for design of performance assessment indexes and DEA is used as a tool for evaluation of efficiency. Relations between 4 perspectives is
in the following terms:
Figure 2. Relations between 4 perspectives of BSC model
𝑋𝑗 = 𝑥1𝑗, 𝑥2𝑗, … , 𝑥𝑚𝑗 (10)
𝑌𝑗 = 𝑦1𝑗, 𝑦2𝑗, … , 𝑦𝑠𝑗 𝑦 𝑗 = (𝑦 1𝑗, 𝑦 2𝑗, … , 𝑦 𝑠 𝑗) 𝑦 𝑗 = (𝑦 1𝑗, 𝑦 2𝑗, … , 𝑦 𝑠 𝑗)
𝑦 𝑗 = (𝑦 1𝑗, 𝑦 2𝑗, … , 𝑦 𝑠 𝑗)
𝑍𝑗 = 𝑧1𝑗, 𝑧2𝑗, … , 𝑧𝑘𝑗
𝑍 𝑗 = 𝑧 1𝑗, 𝑧 2𝑗, … , 𝑧 𝑘 𝑗
𝑍 𝑗 = 𝑧 1𝑗, 𝑧 2𝑗, … , 𝑧 𝑘 𝑗
𝑒𝑗(1) = 𝑢𝑟𝑦𝑟𝑗 + 𝑢 𝑟𝑦 𝑟𝑗
𝑠 𝑟=1 𝑠
𝑟=1
𝑣𝑖𝑥𝑖𝑗 𝑚 𝑖=1
=𝑒 𝑗 (1)
𝑒 𝑗(1) (11)
𝑒𝑗(2) = 𝑢 𝑟𝑦 𝑟𝑗 + 𝑤𝑘𝑧𝑘𝑗
𝐾 𝑘=1 𝑠
𝑟=1
𝑢𝑟𝑦𝑟𝑗 + 𝑠 𝑢 𝑟𝑦 𝑟𝑗 𝑟=1 𝑠
𝑟=1
=𝑒 𝑗 (2)
𝑒 𝑗(2)
𝑒𝑗(3) = 𝑤𝑘𝑧 𝑘𝑗
𝐾
𝑘=1 + 𝑠 𝑟=1𝑢 𝑟𝑦 𝑟𝑗
𝑢 𝑟𝑦 𝑟𝑗 + 𝑠 𝑢 𝑟𝑦 𝑟𝑗 𝑟=1 𝑠
𝑟=1
=𝑒 𝑗 (3)
𝑒 𝑗(3)
973
𝑒𝑗(4)= 𝑤𝑘𝑧 𝑘𝑗
𝐾 𝑘=1 𝑤𝑘𝑧 𝑘𝑗 𝐾
𝑘=1 + 𝐾𝑘=1𝑤𝑘𝑧𝑘𝑗
=𝑒 𝑗 (4)
𝑒 𝑗(4)
The following model is used to calculate the efficiency of the DMUo.
𝑀𝑎𝑥 𝑒𝑜(1) (12)
𝑀𝑎𝑥 𝑒𝑜(2)
𝑀𝑎𝑥 𝑒𝑜(3)
𝑀𝑎𝑥 𝑒𝑜(4)
𝑠. 𝑡. 𝑒𝑗(ℎ)≤ 1 , 𝑗 = 1, … , 𝑛 ℎ = 1, … , 4
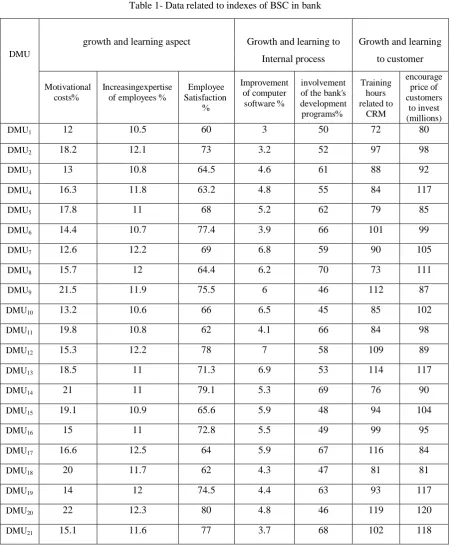
Growth and learning to customer Growth and learning to
Internal process growth and learning aspect
DMU encourage price of customers to invest (millions) Training hours related to CRM involvement
of the bank's development programs % Improvement of computer software % Employee Satisfaction % Increasingexpertise
of employees % Motivational
costs %
80 72 50 3 60 10.5 12 DMU1 98 97 52 3.2 73 12.1 18.2 DMU2 92 88 61 4.6 64.5 10.8 13 DMU3 117 84 55 4.8 63.2 11.8 16.3 DMU4 85 79 62 5.2 68 11 17.8 DMU5 99 101 66 3.9 77.4 10.7 14.4 DMU6 105 90 59 6.8 69 12.2 12.6 DMU7 111 73 70 6.2 64.4 12 15.7 DMU8 87 112 46 6 75.5 11.9 21.5 DMU9 102 85 45 6.5 66 10.6 13.2 DMU10 98 84 66 4.1 62 10.8 19.8 DMU11 89 109 58 7 78 12.2 15.3 DMU12 117 114 53 6.9 71.3 11 18.5 DMU13 90 76 69 5.3 79.1 11 21 DMU14 104 94 48 5.9 65.6 10.9 19.1 DMU15 95 99 49 5.5 72.8 11 15 DMU16 84 116 67 5.9 64 12.5 16.6 DMU17 81 81 47 4.3 62 11.7 20 DMU18 117 93 63 4.4 74.5 12 14 DMU19 120 119 46 4.8 80 12.3 22 DMU20 118 102 68 3.7 77 11.6 15.1 DMU21
974
3-2 Causal Relation between Four Perspectives of BSC Model
According to researchs of Kaplan and Norton
[18] there is a causal relation between BSC's four perspectives. Based on previous research, it seems that the relations between the four Financial aspects Customer aspect
Internal process aspect
DMU Customer to Financial
Internal process to Financial Internal process to customer Returns to Investment % profit marigin % customer acquisition rate % Customer satisfaction % The number of implemente d ideas from customer Reducing internal costs % Improveme
nt of operational processes % banking services % Increasin g speed of service % 2 3.5 17 45 3 5 4 45 80 DMU1 5.3 5.3 19.3 47.2 5 6.2 7.6 47 83.4 DMU2 7.5 3.9 25.6 53.4 9 7.5 7 63.3 90.4 DMU3 2.9 6 22.4 56.7 4 9.3 4.5 55 92 DMU4 4 4.8 17.7 49 4 9.1 6.3 60.1 94.5 DMU5 6.6 6.5 26.1 51.1 7 8.6 4.2 66.5 88.2 DMU6 6.1 4.4 20.5 46.8 5 6.4 7.2 48.2 91.1 DMU7 3.8 5.7 18.4 49.2 3 5.6 5.1 54.2 82.4 DMU8 5.7 5.2 27.6 54.3 8 8.8 5.5 58 87 DMU9 4.5 6.1 25.2 52 6 8.2 7.8 45.7 89.9 DMU10 7.1 3.7 23 56.6 4 6 6 69.5 96.7 DMU11 6.2 5.8 19.4 51.3 6 7.9 4.6 64 93 DMU12 5.1 6.2 22.4 49.2 7 5.5 5.9 58.4 96.2 DMU13 5.5 5.5 24.5 47.5 7 9 6.1 55.7 81 DMU14 4.8 5 20.7 45.6 3 6.1 5 47 84.1 DMU15 7.4 4.8 23.5 53.5 10 9.4 4.1 67.1 82.6 DMU16 5.6 5.6 26.2 47.2 8 8.1 7.4 59.5 90 DMU17 4.1 6.6 21.9 54.2 5 7.3 7 65.3 86.9 DMU18 3.9 4.5 22.7 52.9 5 7.6 4.4 49 91.5 DMU19 8 7 28 57 10 10 8 70 95 DMU20 7.3 4.6 17.2 48 9 9.5 6.9 56 94 DMU21
975 areas BSC is considered remarkable. A well-organized BSC should describe strategy via the objectives and the criteria selected.These criteria must joined to each other in the cause and effect chain between the areas of financial and non-financial performance as well as internal relations between non-financial perspectives.
Non-financial criteria are classified into three perspectives: learning and growth, internal processes and customer.
3-2-1 The Effect of Growth and Learning on Internal Process
To have a strong internal process, growth and learning aspect must be strengthened. Growth and learning is generally focused on human resource (knowledge and skills), systems and methods and information sources and technologies. Improving internal processes requires dynamic mechanisms of growth.It is natural that efficient human resources, systems and powerful methods can cause powerful and flexible internal process. Professional training given to the human resources of bank give them ability who can use updated software. Use of instructions and a new way can accelerate workflows and lending to people is done properly.
Increasing knowledge and skills of human resources:
- Reducing the error percentage - Reducing process cycle time - More efficiency of processes
- Job rotation and employees training
Using the mechanisms and new technologies leads to:
- Alternative methods and existing technologies
- Activity and compete on global banks level with their work optimum
- Reducing the process time
- Designing and creating new processes in accordance with the advancement of technology
- The competitiveness of processes
3-2-2The Effect of Growth and Learning on Customer
976 interaction with customer, so that number of people introduced by older customer will be higher and cross-sell will be more successful (effect of growth and learning on internal process). As a result greater customer satisfaction and more new customers (due to the suggestions and more quality interactions with customers) will happen.
3-2-3 The Effect of Internal Process on Financial
There is a direct impact, positive and important internal processes on the financial aspects (cost reduction). Contrary to the widespread assumption in previous studies related to BSC that claim that internal process affects only the customer perspective, in fact, this effect is strongest relationship between BSC perspectives. Good performance of internal processes that in cases such as reducing cycle time processes, increasing the number of services, working capital, property, absorbing investment and customer participation have direct influence on the area of financing and the profitability of banks. The effectiveness of investment in Research & Development (R&D) as another key indicators of internal processes on the the area of financing is well-known. Furthermore, more introduced people and increase of cross-selling as another indexes of internal processes increase non-interest income. On the other side, modification of processes over set can make this important.
For example, modification of processes related to lending can maximize the repayment of bank loans. Any improvement or development of internal processes, its impact and feedback can be seen in the area of financing. In other words, in this model, internal processes play enabling role and the financing area plays role of one of the main results (key performance indicators). i.e., the bank's internal processes should present indexes of financing area such as deposit growth, profitability, recording facilities granted to deposits, return on capital, working capital, asset growth rate and so on.
3-2-4 The Effect of Customer on Financial
977 share shows that organizations that are able to retain customers and secure a large share of the market tend to improve other organizations with lower rates of customer retention and market share in terms of financial area. Another interpretation that can explain such a causal relationship is that retaining customers provides the basis for growth in deposit and loan balance.
3-2-5 The Effect of Internal Process on Customer
Internal processes such as the receipt and payment processes, facilities, foreign exchange services, providing bank guarantees, transactions, all of them are designed to meet the needs of customers. For example, customers request to go to bank afternoon to do their work so that need to the presence of emergency bank is essential or customers need to increase the number of ATM machines or the customer wants to buy through menopause device. The good performance of internal processes including higher quality of introduced people and cross-selling offers leads to more satisfaction of customer and more maintenance of customer. All things considered by customer is realized through the bank's internal processes. If internal processes operate well, it can provide higher satisfaction and loyalty of customer. What is more important for the customer is that bank processes can present customer services desirably in minimum time and with proper
treatment of owners and executors of processes.
3-2-6 The Impact of Customer on Internal Processes
Customer knowledge management is discussed here. Unit named CRM has this assignment. We are looking for customer wishes for changing internal processes. In the financial area, the aim is profitability can occur in two forms:
1- Reduce costs
2- An increase in revenue
The customer use of bank's internal processes is somewhat indicative of performance of the mentioned process. Customer can be effective via surveys or suggestions and criticisms mechanisms in the development of internal processes. If customers can be divided into two general categories: actual customers and corporate customers, demands of each bank processes are different. Of course, corporate customers have more expectations from bank processes mainly in the areas of production, trade and services is concerned. Of course, the participation of each category of customers will help to improve processes.
4- Solving Method of the Proposed Model and Drawing Related Flowchart
4-1 Weighting Objective Function Method
978 method or weighting objective function method. By using the Shannon entropy method weights for each goals are determined. For this purpose, at first, a weight for each of our objectives is identified by DM.
𝑤𝑖 = 1
𝑛
𝑖=1 (13)
Then a linear combination of the purposes is
written
𝑤𝑖𝑓𝑖(𝑥) 𝑛
𝑖=1 (14)
𝑚𝑎𝑥
𝑚𝑖𝑛𝑓𝑖(𝑥) 𝑚𝑎𝑥
𝑚𝑖𝑛𝑓𝑖(𝑥)
𝑚𝑎𝑥 𝑚𝑖𝑛 𝑛 𝑤𝑖𝑓𝑖(𝑥) 𝑖=1
𝑚𝑎𝑥
𝑚𝑖𝑛𝑓 𝑛(𝑥) 𝑠. 𝑡. 𝑦𝑖(𝑥) ≥ 0 𝑦𝑖(𝑥) ≤ 0
The above MOLP model can be turned to NLP
single objective model by weighting objective
function method.
𝑀𝑎𝑥 𝑤1 𝑒𝑜(1)+ 𝑤2 𝑒𝑜(2)+ 𝑤3 𝑒𝑜(3)
+ 𝑤4 𝑒𝑜(4) (15)
𝑠. 𝑡. 𝑒𝑗(ℎ)≤ 1 , 𝑗 = 1, … , 𝑛 ℎ = 1, … , 4
Where
𝑤𝑖 = 1
4
𝑖=1
𝑢𝑟+ 𝑢 𝑟+ 𝑢 𝑟+ 𝑣𝑖
𝑚
𝑖=1 𝑠
𝑟=1 𝑠
𝑟=1 𝑠
𝑟=1
+ 𝑠 𝑢 𝑟
𝑟=1
+ 𝐾 𝑤𝑘+
𝑘=1 𝑤𝑘
𝐾
𝑘=1
+ 𝐾 𝑤𝑘
𝑘=1 = 1
Gams software is not able to solve the above NLP.
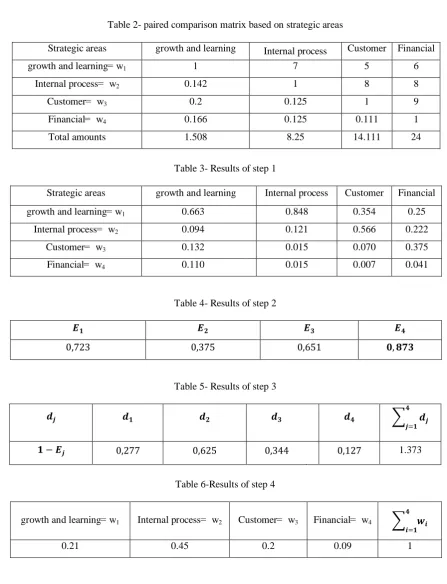
To calculate weight through Shannon entropy method, a questionnaire in strategic areas for the four perspectives of the balanced scorecard is given to experts and the result of the experts' opinions in form of paired comparison matrix are given in Table 2.
Entropy method: Computation of 𝑤1, 𝑤2, 𝑤3, 𝑤4
Step 1: Computation of 𝑝𝑖𝑗
𝑝𝑖𝑗 = 𝑎𝑖𝑗
𝑎𝑖𝑗 𝜇 𝑖=1
, ∀𝑗 (16)
Results of step 1 is given in table 3.
Step 2: Computation of entropy value 𝐸𝑗 (confidence value)
𝐸𝑗 = −𝑘 𝑝𝑖𝑗𝑙𝑛𝑝𝑖𝑗
𝜇
𝑖=1 ; ∀𝑗 (17)
𝑘 = 1
ln(𝜇)=
1
ln 4= 0,721
Step 3: Computation of uncertainty value 𝑑𝑗 𝑑𝑗 = 1 − 𝐸𝑗 ; ∀𝑗 (18 )
Step 4: Computation of weights 𝑤𝑗
𝑤𝑗 = 𝑑𝑗
𝑑𝑗 𝜇 𝑗 =1
; ∀𝑗 (19)
.
979
4-2 Goal Programming Method
One of the solving method of multi-objective problem is goal programming . For each target,
We consider each efficient unit observed as a fuzzy control rule as figure 5 with partitions of
inputs and outputs.
a goal is define and goal is expectations that we want to achieve in problem.
Table 2- paired comparison matrix based on strategic areas
Financial Customer
Internal process growth and learning
Strategic areas
6 5
7 1
growth and learning = w1
8 8
1 0.142
Internal process = w2
9 1
0.125 0.2
Customer = w3
1 0.111
0.125 0.166
Financial = w4
24 14.111
8.25 1.508
Total amounts
Table 3- Results of step 1
Financial Customer
Internal process growth and learning
Strategic areas
0.25 0.354
0.848 0.663
growth and learning = w1
0.222 0.566
0.121 0.094
Internal process = w2
0.375 0.070
0.015 0.132
Customer = w3
0.041 0.007
0.015 0.110
Financial = w4
Table 4- Results of step 2
𝑬𝟒 𝑬𝟑
𝑬𝟐 𝑬𝟏
𝟎, 𝟖𝟕𝟑 0,651
0,375 0,723
Table 5- Results of step 3
𝒅𝒋 𝒅𝟏 𝒅𝟐 𝒅𝟑 𝒅𝟒 𝒅𝒋
𝟒
𝒋=𝟏
𝟏 − 𝑬𝒋 0,277 0,625 0,344 0,127 1.373
Table 6-Results of step 4
𝒘𝒊
𝟒
𝒊=𝟏
Financial = w4 Customer = w3
Internal process = w2 growth and learning = w1
1 0.09
0.2 0.45
980 goal Deviation from goal
𝒃𝟏 𝑑1+, 𝑑1−
𝒃𝟐 𝑑2+, 𝑑2−
𝒃𝟑 𝑑3+, 𝑑3−
𝒃𝒑 𝑑𝑝+, 𝑑𝑝−
𝒃𝒏 𝑑𝑛+, 𝑑𝑛−
Writing ideal form a target (objective function): Three states can happen.
𝑧𝑝 𝑥𝑗 is a target.
1) 𝑧𝑝 𝑥𝑗 ≥ 𝑏𝑝 → 𝑧𝑝 𝑥𝑗 = 𝑏𝑝+ 𝑑+− 𝑑−
⇒ 𝑧𝑝 𝑥𝑗 − 𝑑++ 𝑑−= 𝑏𝑝 2) 𝑧𝑝 𝑥𝑗 ≤ 𝑏𝑝 → 𝑧𝑝 𝑥𝑗
= 𝑏𝑝+ 𝑑+− 𝑑−
⇒ 𝑧𝑝 𝑥𝑗 − 𝑑++ 𝑑−= 𝑏 𝑝 3) 𝑧𝑝 𝑥𝑗 = 𝑏𝑝 → 𝑧𝑝 𝑥𝑗
= 𝑏𝑝+ 𝑑+− 𝑑−
⇒ 𝑧𝑝 𝑥𝑗 − 𝑑++ 𝑑−= 𝑏𝑝 𝑏𝑝 is generally, the objective function of a
problem
min 𝑑𝑖++ 𝑑𝑖−
𝑛
𝑖=1 (20)
𝑝𝑘is prioritization of goals because goals are
not equally important
min 𝑝𝑘
𝑚
𝑖=1 𝑑𝑖
++ 𝑑
𝑖− 𝑞
𝑘=1 (21)
Modeling algorithm of bp (6 steps):
1-Objectives functions (MODM) are identified. 2- Goal values of the objective function are defined.
3- Deviation from the goals are identified and determined what deviation should not happen. 4- The objective function of p is identified. 5- Normal limits of problem are written. 6- Goal limits of the problem are written 𝑀𝑖𝑛 1 − 𝑒𝑜 1 + 1 − 𝑒𝑜 2 + 1 − 𝑒𝑜 3
+ 1 − 𝑒𝑜 4 (22)
𝑠. 𝑡. 𝑒𝑗(ℎ)≤ 1 , 𝑗 = 1, … , 𝑛 ℎ = 1, … , 4
Where
𝑢𝑟+ 𝑢 𝑟+ 𝑢 𝑟+ 𝑣𝑖
𝑚
𝑖=1 𝑠
𝑟=1 𝑠
𝑟=1 𝑠
𝑟=1
+ 𝑢 𝑟
𝑠
𝑟=1
+ 𝑤𝑘+
𝐾
𝑘=1 𝑤𝑘
𝐾
𝑘=1
+ 𝐾 𝑤𝑘
𝑘=1 = 1
Since the above model is a fraction model, but Gams software simply can be appplied to solve non-linear problem (NLP).
5- Results of the Integrated DEA-BSC Model
5-1Weighting Objective Function Method
Efficiency of the integrated DEA-BSC model related to 21 DMUs using weighting objective function method with consideration of different weight are given in Table 7.
5-2- Goal Programming Method
981
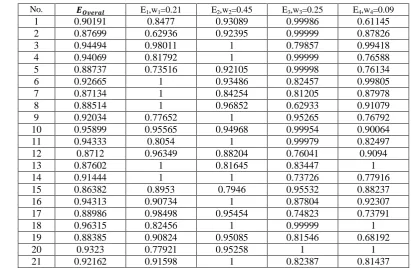
Table 7- Efficiency of the integrated DEA-BSC model related to 21 DMUs using weighting objective function method with consideration of different weights (w1=0.21 , w2=0.45 , w3= 0.25, w4=0.09)
No. 𝑬𝑶𝒗𝒆𝒓𝒂𝒍 E1,w1=0.21 E2,w2=0.45 E3,w3=0.25 E4,w4=0.09
1 0.90191 0.8477 0.93089 0.99986 0.61145
2 0.87699 0.62936 0.92395 0.99999 0.87826
3 0.94494 0.98011 1 0.79857 0.99418
4 0.94069 0.81792 1 0.99999 0.76588
5 0.88737 0.73516 0.92105 0.99998 0.76134
6 0.92665 1 0.93486 0.82457 0.99805
7 0.87134 1 0.84254 0.81205 0.87978
8 0.88514 1 0.96852 0.62933 0.91079
9 0.92034 0.77652 1 0.95265 0.76792
10 0.95899 0.95565 0.94968 0.99954 0.90064
11 0.94333 0.8054 1 0.99979 0.82497
12 0.8712 0.96349 0.88204 0.76041 0.9094
13 0.87602 1 0.81645 0.83447 1
14 0.91444 1 1 0.73726 0.77916
15 0.86382 0.8953 0.7946 0.95532 0.88237
16 0.94313 0.90734 1 0.87804 0.92307
17 0.88986 0.98498 0.95454 0.74823 0.73791
18 0.96315 0.82456 1 0.99999 1
19 0.88385 0.90824 0.95085 0.81546 0.68192
20 0.9323 0.77921 0.95258 1 1
21 0.92162 0.91598 1 0.82387 0.81437
It is noteworthy that w1, w2, w3 and w4 mentioned in the above tables are weights related to growth and learning, customer, internal process and financial perspectives.
Table 8- Efficiency of the integrated DEA-BSC model related to 21 DMUs using Goal programming method
No. 𝑬𝑶𝒗𝒆𝒓𝒂𝒍 𝑬𝟏 𝑬𝟐 𝑬𝟑 𝑬𝟒
1 0.58699 0.85326 0.90966 0.99974 0.65035
2 0.4761 0.83968 0.72911 0.9998 0.95531
3 0.22374 0.98021 1 0.79605 1
4 0.27929 1 0.84896 0.99999 0.87176
5 0.53456 0.75188 0.85298 0.99996 0.86061
6 0.15343 1 0.8489 0.99998 0.99769
7 0.45162 1 0.81167 0.81022 0.9265
8 0.46326 1 0.95061 0.62653 0.9596
9 0.50291 0.77652 1 0.95265 0.76792
10 0.1939 0.95613 0.94935 0.99952 0.90111
11 0.29223 0.83232 0.93075 0.99999 0.94471
12 0.43571 0.9742 0.79732 0.79277 1
13 0.3091 1 0.76863 0.92228 1
14 0.43657 1 1 0.65878 0.90465
15 0.42084 0.93404 0.75288 0.99999 0.89224
16 0.27902 0.92538 1 0.8485 0.9471
17 0.47765 1 0.88705 0.7312 0.9041
18 0.17545 0.82456 1 0.99999 1
19 0.6255 0.92205 0.90149 0.86253 0.68843
20 0.23965 0.87314 0.88722 0.99999 1
982
6. Conclusion
In this paper the integrated DEA-BSC model is presented for measurement of efficiency of various banking units. This proposed integrated model applided in solving multi-
objective problems remove drawbacks of DEA model in determination of input and output indexes and also, disability of BSC model in computation of numerical values. This model, in addition to presentation of financial and
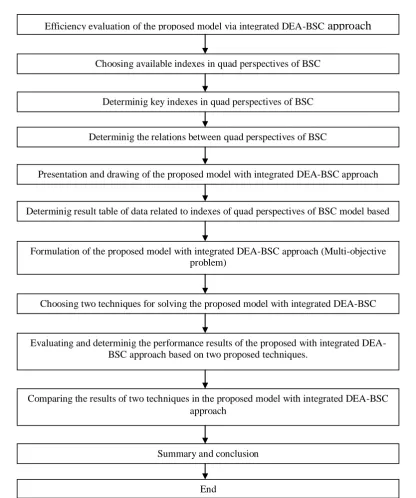
Efficiency evaluation of the proposed model via integrated DEA-BSC
approach
approach
Choosing available indexes in quad perspectives of BSC
Determinig key indexes in quad perspectives of BSC
Determinig the relations between quad perspectives of BSC
Presentation and drawing of the proposed model with integrated DEA-BSC approach
Determinig result table of data related to indexes of quad perspectives of BSC model based
Formulation of the proposed model with integrated DEA-BSC approach (Multi-objective problem)
Choosing two techniques for solving the proposed model with integrated DEA-BSC
approach (weighting objective function method and goal programming)
Evaluating and determinig the performance results of the proposed with integrated DEA-BSC approach based on two proposed techniques.
Comparing the results of two techniques in the proposed model with integrated DEA-BSC approach
Summary and conclusion
End
983 other indexes, provides good and acceptable results in decision-making to managers and experts in the evaluation area. So that with consideration of DEA and BSC models simultaneously weak points of each method was overcome.
The proposed model is a powerful technique in the strategic planning of organizations in implementation and codification stage. This approach is applied in 21 Melli bank branches in west of Tehran. Results and comparing both proposed method shows that different units have various efficiencies in four perspectives of BSC model that
Some of these units are efficient in both mentioned methods in two perspectives of quad areas of BSC model. Furthermore, some of them are efficient in one perspective of this model. And some units have not reached the efficient level. Finally, the proposed integrated approach can be prioritized in bank projects as a new innovative method used in future research and it is considered as one of the innovations of the research work.
Rerfrences
[1]. Varmazyar M, Dehghanbagh M, Afkhami M. A novel hybrid MCDM model for performance evaluation of research and technology organizations based on BSC approach. Evaluation and Program Planning. 2016; 58 ():125–140.
[2]. Wang J, Liu SY, Zhang J. An extension of TOPSIS for fuzzy MCDM based on vague set
theory. Journal of Systems Science and Systems Engineering. 2005; 14(1): 73–84. [3]. Yin Y, Qin S, Holland R. Development of a design performance measurement matrix for improving collaborative design during a design process, International Journal of Productivity and Performance Management. 2011; 60(2):152 – 184.
[4]. Tansel Y. An experimental design approach using TOPSIS method for the selection of computer-integrated manufacturing technologies, Robotics and Computer-Integrated Manufacturing, 2012; 28 (2): 245-256.
[5]. Tone K, Tsutsui M. Network DEA: A slacks-based measure approach, European Journal of Operational Research, 2009; 197(1): 243-252.
[6]. Sexton TR, Lewis HF. Two-stage DEA: An application to major league baseball, Journal of Productivity Analysis, 2003; 19(2): 227-249.
[7]. Despotis DK, Koronakos G. Efficiency Assessment in Two-stage Processes: A Novel Network DEA Approach, Pro Computer Science, 2014; 31: 299-307.
984 Problems in Engineering, 2015; 2015 (2015): 1-10.
[10]. Gang D, Li C, Yin-Zhen L, Jie-Yan S, Tanweer A. Optimization on Production-Inventory Problem with Multistage and Varying Demand, Journal of Applied Mathematics, 2012; 2012 (2012): 1-17. [11]. Charnes A., Cooper, W.W., and Rhodes, E. Measuring the efficiency of decision making units, European Journal of Operational Research,1978; 2(6):429-444.
[12]. Banke R, Charnes A, Cooper WW. Some models for estimating technical and scale inefficiencies in data envelopment analysis, Management Science, 1984; 30(9): 1078-1092. [13]. Kazemi Matin R, Azizi R. A unified network-DEA model for performance measurement of production systems, Measurement, 2015; 60: 186–193.
[14]. Chiang CY, Lin B. An integration of balanced scorecards and data envelopment analysis for firm's benchmarking management, Journal of Total Quality Management & Business Excellence, 2009; 20(11):1153-1172. [15]. Kádárová J, Durkáčová M, Teplická K,
Kádár G. The Proposal of an Innovative Integrated BSC – DEA Model, Procedia Economics and Finance, 2015; 23: 1503 – 1508.
[16] Al-Najjar SM, Kalaf KH. Designing a Balanced Scorecard to Measure a Bank's Performance: A Case Study, International Journal of Business Administration, 2012; 3(4).
[17]. Ehsanbakhsh H, Izadikhah M. Applying BSC-DEA Model to performance evaluation of industrial cooperatives: an appliction of fuzzy inference system, Applied Research Journal, 2015; 1(1): 9-26.