ISSN: 1992-8645 www.jatit.org E-ISSN: 1817-3195
A SUB-OPTIMAL PTS ALGORITHM BASED ON BACTERIAL
FORAGING OPTIMIZATION TECHNIQUE FOR PAPR
REDUCTION IN MIMO-OFDM SYSTEM
1R.MANJITH, 2M.SUGANTHI
1Assistant Professor, Department of ECE, Dr.Sivanthi Aditanar College of Engineering, Tiruchendur 2Professor, Thiagarajar College of Engineering, Madurai, Tamilnadu, India
E-mail : [email protected],[email protected]
ABSTRACT
A suboptimal partial transmit sequence (PTS) based on bacterial foraging optimization (BFO) algorithm is presented for the low computation complexity and the reduction of the peak-to-average power ratio (PAPR) of a multiple input multiple output orthogonal frequency division multiplexing (MIMO-OFDM) system. In general, PTS technique can improve the PAPR statistics of a MIMO- OFDM system. However, it will come with an exhaustive search over all combinations of allowed phase weighting factors and the search complexity increasing exponentially with the number of subblocks. In this paper, we work around potentially computational intractability; the proposed bacterial foraging optimization (BFO) scheme exploits heuristics to search the optimal combination of phase factors with low complexity. Simulation results show that the BFO technique can effectively reduce the computation complexity, PAPR reduction and BER performance of MIMO - OFDM system.
Keywords: MIMO-OFDM, Partial Transmit Sequence, Peak-To-Average Power Ratio, Bacterial Foraging
Optimization, Bit Error Rate.
1. INTRODUCTION
The multiple-input multiple-output (MIMO) united with space time coded orthogonal frequency division multiplexing (OFDM) is one of the most hopeful systems providing large system capacity without additional bandwidth consumption for high speed wireless communication systems. To get better reliability through diversity gain, MIMO-OFDM [1-8] presents spatial diversity and enhances the system’s capability on time variant and frequency selective channels. Time-domain broadcasted signal with an elevated PAPR (peak-to-average power ratio) particularly for a large number of subcarriers is the vital problem for MIMO-OFDM applied systems. Numerous methods for reduction of PAPR have been introduced. Clipping, coding, adaptive pre-distortion, DFT-spreading and probabilistic (scrambling) technique are the PAPR reduction methods [3].
The probabilistic (scrambling) technique comprises of SLM (Selective Mapping), PTS (Partial Transmit Sequence), TR (Tone Reservation) and TI (Tone Injection) techniques. Clipping and filtering have been proposed in [11] to reduce the PAPR of MIMO-OFDM. Even though Clipping is the simplest technique; it causes in-band signal
ISSN: 1992-8645 www.jatit.org E-ISSN: 1817-3195
rotation phase vector for the PTS method, the RVGA (Real Valued Genetic Approach) method was presented by the authors in [6] to diminish the PAPR of OFDM signals.
In paper [4], the author works around potentially computational intractability; the projected PSO system exploits heuristics to look for the most advantageous combination of phase factors with small complexity. Based on the ABC (Artificial Bee Colony) algorithm, the authors in [2-5] presented the PAPR reduction method in OFDM. Their proposed scheme [2] can look for the enhanced mixture of the primary phase factors. To reduce the computational difficulty of the PTS in the OFDM system, they propose a PTS based on an artificial bee colony (ABC) algorithm (ABC-PTS) in this article. By a random search strategy (RS-PTS) and optimum PTS the ABC-PTS [5] was evaluated to conventional PTS. To diminish peak to average power ratio, the Co-PTS technique was proposed [7] with the SFBC MIMO-OFDM signal, which makes use of exchange optimization. At the same time, the number of candidate sequences is enlarged by employing spatial sub block circular permutation, which advances PAPR reduction presentation regularly. Due to this elevated PAPR there is a strict degradation of bit error rate (BER) presentations and in-band and out-of-band distortion arises in the non-linear amplifier and guides it to power inefficiency in the RF section of the transmitter.
In this paper, PAPR of MIMO - OFDM is considered as the problem space because computation complexity and number of searches to optimize the best phase factor is high. Therefore, this paper proposes the Partial Transmit Sequence based Bacterial Foraging Optimization Algorithm (BFOA-PTS) to reduce PAPR compared with existing approaches [2-4-5]. Here the selected phase factors differ from the existing approaches which will be explained in the phase factor optimization section. Three control parameters named number of bacteria, number of chemotaxis and number of swim are concentrated for performance evolution of the proposed method.
This paper is organized as follows: In section II PAPR reduction in MIMO-OFDM is introduced and CCDF is also described. Section III depicts the block diagram of BFOA-PTS of MIMO-OFDM in detail. Section IV describes the allowed phase factor and essential of optimization. Sections V and VI briefly explain the concept of the Bacterial Foraging Algorithm and optimization of the best phase factor combination. In section VII various simulation results are presented with
comparison graphs and tables. Finally this paper is concluded in section VIII.
2. MIMO-OFDM and PAPR
In a MIMO-OFDM system with N subcarriers, the continuous time complex baseband is defined as
x(t)= (1)., 0< t < N-1
The high rate input data X is split into N. Low rate data X0, X1, …., XN-1 are transmitted through N
subcarriers and M transmitters and receiver antennas. Here N frequencies or subcarriers are orthogonal to each other i.e.,ᶺf=1/NT and T is the time period. The N subcarriers are independently modulated by a 16 QAM Modulator and N points IFFT (Inverse Fast Fourier Transform) generate the ready-to-transmit signal. The MIMO-OFDM transmits this signal through M transmitter antennas simultaneously. The N points FFT (Fast Fourier Transform) and the 16 QAM Demodulator broadcast the complex signal x(t) through N receiver antennas where M≥N. PAPR is defined as the ratio between the maximum and the average power of complex baseband signal x(t) which is given as,
PAPR[x(t)]=max{|x(t)2/E{|x(t)|2} (2) E{.} denotes the expected value of the MIMO-OFDM system. The complementary cumulative distribution function (CCDF) is the commonly used performance measures for PAPR reduction, which is denoted as 𝐶𝐶𝐷𝐹=(𝑃𝐴𝑃𝑅 > 𝑃𝐴𝑃𝑅0). CCDF of
MIMO-OFDM is the probability that the PAPR of an MIMO-OFDM symbol exceeds the given threshold 𝑃𝐴𝑃𝑅0. The MIMO-OFDM transmits
independent data (say Xt1, Xt 2… XtN ) on M transmitter antennas simultaneously and in the same frequency band. At the receiver, N receiver antennas receive the signal rj. Thus we have the following received signals in each receiver antenn r1=h11Xt1+h12Xt2+……..+h1NXtN
r2=h21Xt1+h22Xt2+……..+h2NXtN .
.
rN=hN1Xt1+hN2Xt2+……..+hnNXtN
3. PTS TECHNIQUES
ISSN: 1992-8645 www.jatit.org E-ISSN: 1817-3195
subblock are weighted by a phase factor for that subblock. The phase factors are selected such that the PAPR of the combined signal is minimized. In the conventional PTS technique [8, 9] input data block Xis partitioned into Mdisjoint subblocks Xm
= [Xm,0, Xm,1, …, Xm,N–1]T, m = 1, 2, …, M, and the
subblocks are combined to minimize the PAPR in the time domain. The L-times oversampled time domain signal of Xm, m = 1, 2, …, M, is denoted
xm =[xm,0, xm,1, …, xm,NL–1]T. set of xm, m= 1, 2,
…, M, is obtained by taking an IFFT of length NL on Xm concatenated with (L– 1)N zeros. These are
called the partial transmit sequences. Complex phase factors, bm =ejφm, m = 1, 2… M, are
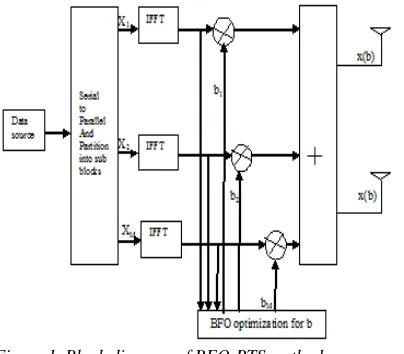
[image:3.612.93.295.294.471.2]introduced to combine the PTSs. The phase factors is denoted as a vector W= [w1, w2… wm]T.
Figure 1. Block diagram of BFO-PTS method
The time domain signal after combining is given by
where x(b) =[x0(b), x1(b),……….. xNL-1(b)]T
In the proposed method two transmitting and receiving antennas are considered for simulation.
4. PHASE FACTOR OPTIMIZATION
In general, the selection of the phase factor is limited to a set with finite number of elements to reduce the search complexity. The set of allowed phase factors is
P = {ej2пl/w ,l=0,1 ---W-1} (4)
where W is the number of allowed phase factors. We can fix a phase factor without any performance loss. There are only M−1 free variables to be optimized and hence WM-1 different phase vectors are searched to find the global optimal phase factor. The search complexity increases exponentially with M, the number of sub-blocks.
The selection of the phase factor is restricted to a set with finite number of elements to reduce the search complexity or number of searches. Existing approaches have taken the allowed phase factor W=2,b={+1,-1}or W=4,b={+1,-1,+j,-j}. Here in the proposed method the set of allowed phase factors W is chosen equal to the number of sub-blocks M i.e., W∝M. By incrementing the size of the allowed phase factor, PAPR of an MIMO-OFDM system can get reduced. The set of allowed phase factor P can be obtained from equation (4) .The phase factor possibilities are given by bi= ejфM where ф ε [0, 2π]. For example if we consider M=8 we choose W=8, b= {1, 0.7071 + 0.7071j, j, 0.7071 + 0.7071j, 1, -1, -0.7071 - 0.7071j, -j, 0.7071 - 0.7071j}.
So, the main goal of the PTS technique is to optimize the best phase factor bi from the phase vector b. The search complexity also increases exponentially with W, number of phase factor since in the proposed method, the allowed phase factors W are directly proportional to the number of subblocks M.
5. BACTERIAL FORAGING OPTIMIZATION:
In recent years E.coli introduced the Bacterial Foraging Optimization Algorithm (BFO) for numerical optimization problems [10]. In BFO, a bacterium keeps foraging on food population by two basic steps, tumble and swim. The main goal of a bacterium is to optimize the best food position within the pre-defined iterations. Chemotaxis is the initial step for a bacterium in which Ns numbers of
swim steps are to be followed. When a bacterium completes each swim it calculates the fitness of current food position and compares it with the previous position. Once the fitness of the current food decreases, then the previous position of the bacterium gets changed in the moving direction which is known as tumble. Tumble is a unit walk in any random direction on food sources. In case a bacterium optimizes best fitness in the next swim steps, it keeps moving in the same direction up to Ns swim steps. Alternation between the swim and
tumble steps involves in one chemotaxis iteration. After completion of Nc chemotaxis steps,
a bacterium finds M best food positions, therefore N number of bacteria optimize S = Nc*N number
of food positions. Reproduction and Elimination-dispersal are the augment steps in BFOA. In the reproduction step, bacteria in the S food positions are arranged in descending order and split into two i.e, Sr = S/2. Now the 2nd half of S bacteria are
ISSN: 1992-8645 www.jatit.org E-ISSN: 1817-3195
position for the next iteration. After Nr
reproduction steps are completed the elimination-dispersal step is placed based on the elimination probability Epr. In elimination-dispersal few
bacteria are removed from the food position randomly based on Epr. Then some of the bacteria
are placed in random food positions for the next iteration. After Ned elimination-dispersal steps the
best food position is optimized by the healthiest bacteria.
6. BFO- PTS FOR PAPR REDUCTION:
In this paper, BFO algorithm is proposed to optimize the best phase factor from WM-1 combinations where M is the number of sub-blocks and W is the allowed phase factor. In the PAPR reduction, the food source is equivalent to phase vector b = {bi1, bi2, bi3, . … . , biWM-1 }, i = 1,.. WM-1.
In BFO-PTS the objective is to find the minimum of fitness P (bi) i.e., the best phase factor
combination for which the PAPR value is minimum.
The table 1 shows the parameters involved in BFO algorithm
Table 1. Parameters used in BFO
No. of Bacteria N = [Bi1, Bi2,..Bn]
No. of Chemotaxis Nc
No. of Swim Ns
No. of Reproduction Nr
No. of Elimination-dispersal Ned
Elimination probability Epr
Step 1. Initially N bacteria are randomly placed into the population
Step 2. Each bacterium Bi calculates P (bi) where
P (bi) = max [|xt(bi)|2] / E [|xt(bi)|2]
Step 3. Calculate fitness of Biat ith swim, Pnew(bi)
3.1. Check {Pnew(bi)< P(bi)}
3.2. Then if P(bi)=Pnew(bi) continue with next
swim step up to Ns
3.3. If {Pnew(bi)> P(bi)} then take the tumble step.
Here tumble denotes 1 unit walk in a random direction.
Step 4. Continue step 3 up to Nc chemotaxis steps
Bacteria Bi optimize {Nc* Pnew(bi)} So N bacteria
optimize S = (Nc *N) best food positions (phase
factors).
Step 5. Reproduction.
5.1. Arrange S in ascending fitness P (bi).
5.2. The Sr = S/2 bacteria with the highest P (bi)
fitness die and other Sr bacteria with the best fitness
split into two bacteria which are then placed into the same location.
Step 6. Continue step 3 to step5 up to Nr
reproduction steps
Step 7. Elimination-Dispersal
7.1. Initialize Elimination probability Epr
7.2. An individual bacterium is selected stochastically according to Epr to be removed from
the population.
7.3. The removed bacteria are replaced by the new bacteria which are randomly placed in the population.
Step 8. After Ned processes are completed, the
bacterium with minimum P (bi) is selected.
7. SIMULATION RESULTS:
In this section, we show that the BFO-PTS performance in terms of PAPR reduction with reduced computational complexity of searching the phase factors when compared with ABC-PTS [2-5] and PSO-PTS [4]. Several simulations have been conducted to evaluate and compare our proposed BFO-PTS method with existing methods. The analysis of the proposed BFO-PTS system using two transmitting and receiving antennas has been carried out using MATLAB 12.0. The simulation parameters considered for this analysis is summarized in Table 2.
Table 2. Simulation Parameters
Simulation parameters Type/value
Number of subcarriers 256
Number of subblocks(M) 4,8,16,32 Oversampling factor(L) 4 Number of antennas(Tx) 2×2
Modulation Scheme QAM
Phase Factor(W) 2,4,8,16,32
Existing approaches chose among the allowed phase factors W = 2 or W = 4. When a larger value of phase factor (W) is chosen, better PAPR reduction is obtained than the existing approaches. Here, W is changed iteratively in [0,2π]. Computation time and memory required to simulate higher subblocks with more phase factor combination is high. So we limit the simulation to the following simulated results.
In the BFO-PTS method, there are three control parameters: number of bacteria N, number of chemotaxis steps Nc and number of swim steps Ns.
Other parameters used in the BFO-PTS do not change the population size. Number of searches is calculated by (N* Nc* Ns).
ISSN: 1992-8645 www.jatit.org E-ISSN: 1817-3195
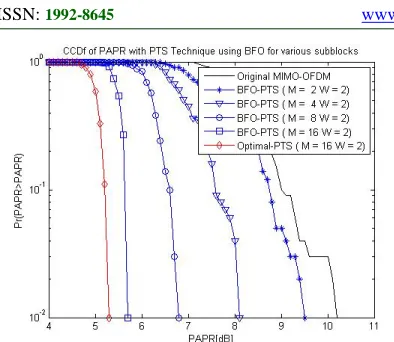
Figure 2. CCDF Of PAPR With PTS Technique Using BFO-PTS For Various Sub-Blocks M=2, 4, 8, 16 & 32
For Phase Factor W=2 And Original MIMO-OFDM
[image:5.612.87.524.56.742.2]Figure 3.1 and Figure 3.2 shows the PAPR values for different phase factor combinations W= 2, 4, 8, 16, 32 with M= 2 and 4 sub-blocks. BFO-PTS reduces the PAPR with minimum number of searches of finding the optimum phase factor combination.
Figure 3.1 BFO-PTS With M=2 For Phase Factor W=2, 4, 8, 16, 32
Figure 3.2. BFO-PTS With M=4 For Phase Factor W=2, 4, 8, 16, 32
Figure 3.3 shows the PAPR values of BFO-PTS for M = 8 sub-blocks W= 2 and 4 phase factor
combination.To evaluate the optimum phase factor combination using BFO-PTS for M=8 and W=2 combination, we have assigned the B = 5 bacteria, Nc = 4 chemotaxis steps, Ns = 3 swim steps, Nr = 3
reproduction steps, Ned = 2 Elimination-dispersal
steps and Epr = 0.2 elimination probability. On the
first chemotaxis iteration, each bacterium takes three swim steps and optimizes one best PAPR value at the last swim step. Accordingly, five bacteria optimizes B * Nc = 5 * 4 = 20 best PAPR
values at the completion of Nc chemotaxis steps. As
the next step of BFO-PTS is reproduction, the optimized values S are sorted and divided into Sr =
S/2 values. Therefore the best 10 values moves into next generation and it reproduces the same values at the same positions. Hence S = 20 bacteria swim in the direction of searching best food and optimizes the S * Nc number of values. Once Nr
reproduction steps are completed, the first of Ned
elimination-dispersal step are taken with the elimination probability of Epr = 0.2. But, elimination
[image:5.612.93.290.75.246.2]steps involved in BFO-PTS selects and replaces the values on random search. Finally, the best PAPR 6.90 dB is chosen from the optimized PAPR values.
Figure 3.3 BFO-PTS With M=8 For Phase Factor W=2&4
[image:5.612.313.507.372.720.2] [image:5.612.98.303.498.703.2]ISSN: 1992-8645 www.jatit.org E-ISSN: 1817-3195
[image:6.612.318.524.97.286.2]Figure 3.4 shows the PAPR values of M = 16 sub-blocks and W = 2 phase factor combination with optimum PTS. The number of possible phase factor combination increases with the increase in phase factors for M=16 subblocks. As the number of subblocks and the set of phase weighting factor are increased, the performance of the PAPR reduction becomes better. However, the processing time gets longer because of much iteration. For example M=16 &W=4 has 416-1=huge no of combinations for which simulation is time consuming. So we limit our simulation for this combination (M=16 & W=2) in which BFO –PTS produces best PAPR in only 900 searches out of 32,768 combination. In Figure 4 we have compared the PAPR values of MIMO-OFDM using BFO-PTS and PSO-PTS for M = 8 sub-blocks and W = 2 phase factors cobination. The BFO-PTS method has reduced the PAPR up to 6 .9 dB in 60 searches when compared to the PAPR value of PSO-PTS of 8.0 dB in 88 searches.
Figure 4.CCDF Comparison graph of PSO PTS & BFO PTS (M=8 & W=2)
Table 3. Computational Complexity of OPTS, BFO-PTS and PSO PTS W=2 & M=8
Table 3 illustrates the computational complexity of searching the best phase factor combination for M=8 subblocks and W=2 phase factor combination.BFO -PTS outperforms the existing PSO PTS method as it requires only 60 searches to obtain a PAPR of 6.9 db which is close to the optimum value of 6.5 db where PSO PTS requires 88 searches .
Figure 5 compares the PAPR values of
MIMO-OFDM using BFO-PTS and ABC-PTS for M = 16 sub-blocks and W = 2 phase factor combination.
Figure 5. CCDF Comparison graph of ABC PTS & BFO PTS( M=16 & W=2)
Table 4. Computational Complexity of OPTS, BFO-PTS and ABC PTS (W=2 & M=16)
Method Computational complexity PAPR
OPTS WM−1= 216-1=215=32768 5.40 dB
ABC PTS MCN∗SN= 256∗4 = 1024 6.91 dB
[image:6.612.308.522.340.409.2]BFO-PTS N* Nc* Ns = 30*10*3 = 900 5.80dB
Table 4 illustrates the computational complexity for M=16 subblock & W=2 phase factor. Here BFO PTS requires 900 searches to obtain the PAPR value of 5.80 db close to the optimum value of 5.40 db whereas ABS-PTS requires 1024 searches. In table 4, MCN*SN is the scale to measure the number of searches taken in the ABC-PTS method [5].
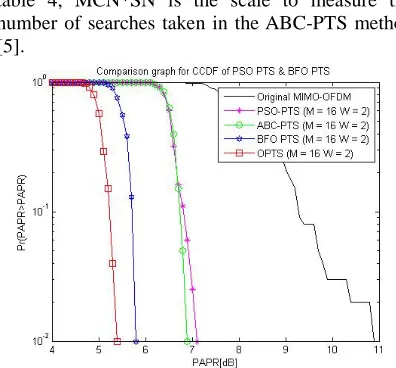
Figure 6. CCDF Comparison graph of ABC PTS, BFO PTS and PSO PTS( M=16 & W=2) for 900 searches
In Figure 6, comparison between the BFO-PTS, PSO-PTS and ABC-PTS methods is shown for 900 searches for W = 2 phase factor and M = 16 sub-Method Computation complexity PAPR
OPTS WM−1=28−1=128 6.5 dB
PSO-PTS V×O(W3)=(1 +Gn)×O(W3)
=(1 + 10)×(23)=11×8=88
8.0 dB
PSO-PTS with threshold
23 7.6 dB
[image:6.612.95.295.348.532.2] [image:6.612.315.513.484.668.2]ISSN: 1992-8645 www.jatit.org E-ISSN: 1817-3195
[image:7.612.99.300.475.641.2]blocks combination. The comparison shows that BFO PTS gives better PAPR reduction compared with PSO PTS & ABC PTS.
Table 5.Computational Complexity of OPTS, BFO- PTS,PSO-PTS and ABC PTS (W=2 & M=16) for 900
searches
Methods Computational complexity PAPR
OPTS WM−1= 216-1=215=32768 5.40 dB
PSO-PTS P𝑆=30∗30 = 900 7.10 dB
ABC-PTS G𝐾=30∗30 = 900 6.90 dB
BFO-PTS N* Nc* Ns = 30*10*3 = 900 5.80 dB
In table 5, we have tabulated the PAPR values of various PTS methods such as ABC-PTS, PSO-PTS and BFO-PTS for 900 searches and the optimum PTS for 32,768 searches. Here P = S = 30 represents the population and G = K = 30 represents the maximal generations / iterations used in PSO-PTS and ABC-PSO-PTS. For 900 searches the table shows BFO PTS gives better PAPR reduction when compared with the other two methods. The proposed BFO-PTS scheme along with the increased phase factors election gives better PAPR reduction with minimum number of searches.
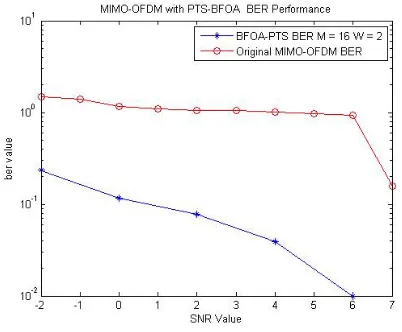
Figure 7 shows the performance of Bit Error Rate vs Signal-to-Noise Ratio comparison between the original MIMO-OFDM and the BFOA-PTS method when transmitting the input signal by 16 sub-blocks and 2 phase factors. It shows that our BFO-PTS method gives better BER performance than the original MIMO-OFDM.
Figure 7. Performance graph BER vs SNR for the original MIMO-OFDM and BFO PTS MIMO-OFDM (M
= 16 and W = 2)
7. CONCLUSION:
In this paper, we propose a BFO based PTS algorithm (BFO-PTS) to search better combination of phase factors for MIMO-OFDM
signals. Compared to the existing PAPR reduction methods, the BFO-PTS algorithm can get better PAPR reduction and significantly reduce the computational complexity for larger PTS subblocks at the same time. Moreover, because the BFO-PTS algorithm only has three control parameters, so it is easy to be adjusted. Simulation results show that the BFO-PTS algorithm is an efficient method which can provide a better PAPR performance.
REFERENCES:
[1].Er. Ankita, Anand Nayyar,” Review of various PTS (Partial Transmit Sequence) techniques of PAPR (Peak to Average Power Ratio) reduction in MIMO-OFDM”, International Journal of Innovative Technology and Exploring Engineering , Vol-2, pp. 199 – 202, 2013.
[2].Yajun Wang, Wen Chen and Chintha Tellambura,” A PAPR Reduction Method Based on Artificial Bee Colony Algorithm for OFDM Signals”, IEEE Transaction on Wireless Communications, Vol. 9, pp. 2994 – 2999, 2010.
[3].Yong Soo Cho, Jaekwon Kim, Won Young Yang and Chung G. Kang,” MIMO-OFDM Wireless Communications with MATLAB”, WILEY, 2010.
[4].Jyh-Horng Wen, Shu-Hong Lee, Yung-Fa Huang and Ho-Lung Hung,” A Suboptimal PTS Algorithm Based on Particle Swarm Optimization Technique for PAPR Reduction in OFDM Systems”, EURASIP Journal on Wireless Communications and Networking, Vol 2008, pp. 1 – 8, 2008.
[5].Necmi Taspinar, Dervis Karaboga, Mahmut Yildirim, Bahriye Akay,” PAPR reduction using artificial bee colony algorithm in OFDM systems”, Turk J Elec Eng & Comp Sci, Vol.19, pp. 47 – 58, 2011.
[6].Jenn-Kaie Lain, Shi-Yi Wu and Po-Hui Yang,” PAPR reduction of OFDM signals using PTS: a real-valued genetic approach”, EURASIP Journal on Wireless Communications and Networking, pp. 1 – 8, 2011.
[7].Bharti Rani, Mrs Garima Saini,” Cooperative Partial Transmit Sequence For PAPR Reduction in Space Frequency Block Code MIMO-OFDM Signal”, International Journal of Electronics and Communication Engineering & Technology, Vol.3, pp. 321 – 327, 2012.
ISSN: 1992-8645 www.jatit.org E-ISSN: 1817-3195
Mapping”, Cognitive Radio Communication and Networking: Principles and Practice, 2002.
[9].Pooria Varahram and Borhanuddin Mohd Ali,” Low Complexity Partial Transmit Sequence with Complex Gain Memory Predistortion in OFDM Systems”, Wireless Pers Commun, 2012
[10].Jing Dang,AnthonyBrabazon ,David Edelman, ”Option Model Calibration using a bacterial foraging Optimization Algorithm “, Springer-Verlag Berlin Heidelberg,pp-113-122,2008.
[11].Byung Moo Lee and Youngok Kim, “An Adaptive Clipping and Filtering Technique for PAPR Reduction of OFDM Signals”, Circuits, Systems, and Signal Processing, Vol.32 pp.1335-1349, 2013.