ISSN: 1992-8645 www.jatit.org E-ISSN: 1817-3195
288
SENSITIVITY SIMULATION ANALYSIS OF URBAN
EXPRESSWAY UNDER SPEED GUIDANCE CONTROL
DASHAN CHEN, YU ZHANG, LIGUO XIA
Faculty of Transportation Engineering, Huaiyin Institute of Technology, Huai’an 223003, Jiangsu, China
ABSTRACT
Urban expressway could improve operational efficiency and reduce accident rates under speed guidance control. Driver obedience for the speed guidance value affected the effect directly. The effect might also lose even play a negative role when the traffic demand reached a certain level. Simulation was carried out depending on different traffic demand and driver compliance rate through abstract urban expressway model. Six kinds of traffic demand under different obedience level were analyzed comparatively. Speed guidance control has the positive effect about safety and efficiency when the traffic demand is low or medium. When the traffic demand is high, the effect on safety and efficiency both are negative. Different driver compliance rate affected the effect level to some extent.
Keywords: Urban Expressway; Speed Guidance; Conflict; Compliance Rate
1.
INTRODUCTIONAs the backbone of the city road network, urban expressway shares large proportion of the traffic. In Beijing, major urban expressway accounts for only 8% of the total length, but carries nearly 50% of the traffic flow [1]; in Shanghai, only 5% bears more than 35% of the city traffic traveling. Urban expressway plays a vital role in the urban road network which gradually shifted from the large-scale infrastructure construction to refinement traffic management. With the traffic demand rapid growing, much more congestion and traffic accidents, integrated active traffic management should be introduced in the background of coordination between road and vehicle. As an important part of the active traffic management, the speed guidance control has certain positive significance to improve the expressway capacity, reduce the accident risk and decrease even eliminates traffic congestion.
A traffic flow model of the expressway under the speed guidance condition was derived and an optimal coordination function for ramp metering and main road speed guidance to maximize the expressway service capacity and minimize the ramp queue delay was built [2]. Without entrance ramp limit, and combining vehicles state and the road state, the fuzzy control method for highway was given for highway speed limitation [3]. Incorporation the characteristics of urban expressway with a macroscopic dynamic traffic flow model, a variable speed limit control approach
was proposed based on the principle of fuzzy logic [4]. The control for speed limit on expressway was a nonlinear and time variable system, intelligent control method of neural network and neural-fuzzy network were proposed to solve the problem [5, 6]. Speed limited value was determined by the binary tree analysis considering traffic volume, vehicle speed and occupies [7].
Although speed guidance control can improve road efficiency and reduce the rate of accident, obedience of the driver directly affects the effect. Simultaneously, when the road traffic demand reaches a certain level, the speed guidance control may lose effect even may play a negative role. Traffic demand and driver obedience were adopted as the sensitivity analysis variable. The result provides theoretical support for speed guidance control in active traffic management.
2.
MACRO DYNAMIC TRAFFIC FLOWMODEL
ISSN: 1992-8645 www.jatit.org E-ISSN: 1817-3195
289 proposed by Payne and Papageorgiou are widely used in practice [11].
Urban expressway was divided into several segments. Each segment contained up to one entrance and one exit. Speed guidance control was embedded as a new variable in urban expressway. Dynamic speed change was affected not only by regular traffic flow parameters but also interfered by speed guidance control variable. When speed guidance control introduced as a control variable, Payne model was extended as follow.
( ) ( ) ( )
i i i i
q k =ρ k v k λ (1)
T
(k 1) ( )k [q 1( )k q k( ) r k( ) s k( )]
i i i i i i
Li i
ρ ρ
λ
+ = + − − + − (2)
T T
( 1) ( ) [ ( ( )) ( )] ( )[ 1( ) ( )] τ
( ) ( )
( ) ( )
ηT[ 1 ] γT[ , 1 , ]
τ ( ) κ τ ,( )
v ki v ki v ik v ki v k vi i k v ki
Li
v k v k
k ik sgi sg i
i
Li ik Li vsgik
ρ
ρ ρ
ρ
+ = + − + − −
−
− +
+
− +
+
(3)
( )
1 a
( ( )) min[v exp[f ( ) ], ,( )] a ρcrit
k i
vρi k = − ρ vsg ik (4)
Where q ki( )is the traffic volume, k indicates
the time instant, ρi( )k is the traffic density,
( )
v ki is the traffic speed, r ki( ) is the on-ramp
volume, s ki( )is the off-ramp volume, λi is the
number of the lanes, Li is the length of the
segment, vsg i, ( )k is the value of the speed
guidance, Tis the time step used for the simulation of traffic flow. τ , η ,a , κ and γ are model
parameters, vf is the average speed that drivers
assume if traffic is freely flowing, ρ
crit is the
density at which the traffic flow is maximal,
ρmax is the maximum density. (v ρi( ))k is the desired speed by the drivers.
( )
( ) min[ 1( ), ( ) ]
T w0 k
q0 k = qlim, k d0 k + (5)
qcap,1 ; if ( ) 0(ρ )
1 cirt
1
( ) ( )
1 ( )ρ [ ln( 1 )] ; if a ( ) (ρ )
0
1 crit v 1 cirt
f
vlim, k v qlim, k vlim, k
vlim, k a vlim, k v
≥ =
− <
(6)
( ) min( 1( ), 1( ))
1
v k v k vsg, k
lim, = (7)
Where q0( )k is the traffic volume of entrance,
( )
d0 k is the traffic demand, w0( )k is the queue
length. qlim,1( )k is the restricted flow of the first
segment under speed guidance control, vlim,1( )k is
the restricted speed value. qcap,1is the capacity of
the first segment.
If the road segment contains the ramp, the flow is
ρmax- ( ) ( )
min[Q , ( ) ]
ρmax-ρcrit T
k w k
i i
q i d ki
ρ
= + (8)
Where d ki( ) is the on-ramp traffic demand,
( )
w ki is the queue length of the on-ramp, Qiis the
capacity of the on-ramp.
Origins and on-ramp are modeled with a simple queue model. The length of the queue equals the previous queue length plus the demand, minus the outfow.
( 1) ( ) T[ ( ) ( )]
w ki + =w ki + d ki −q ki (9)
The extended macroscopic dynamic traffic flow models of urban expressway under speed guidance control listed as formulas 1 to 9 which were the foundation of sensitivity simulation analysis.
3.
CONTROL STRATEGY ANDSIMULATION SYSTEM FRAMEWORK
3.1 Dynamic Control Strategy of Speed Guidance Control
ISSN: 1992-8645 www.jatit.org E-ISSN: 1817-3195
290
Volume
Occupy
< 1200 veh/km/lane
Yes
No
< 15%
60
80
Yes
No Speed Speed
< 40km/h 40
No
> 60km/h 80
No
60
< 40km/h 40
No
> 60km/h 80
No Yes
Yes
Yes
[image:3.612.92.296.71.239.2]Yes
Figure 1: Strategy Of Speed Guidance Control
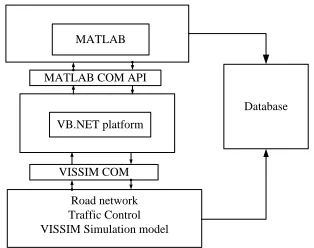
3.2 Framework of Online Simulation System
In the speed guidance control online simulation system, VISSIM software is used to simulate the real world traffic. The macro dynamic traffic flow model is established in MATLAB software. Data and control strategies were exchange through the API interface among VB.NET, VISSIM and MATLAB.
According to the functional orientation, online simulation system was divided into four modules: simulation module, strategy module, interface module and database module. The structures of the simulation system as well as the relationship among the modules were shown in Figure 2.
Road network Traffic Control VISSIM Simulation model
MATLAB
VISSIM COM MATLAB COM API
VB.NET platform
Database
Figure 2: Framework Of Online Simulation System
4.
NUMERICAL ANALYSISRoad safety assessment can be divided into direct and indirect methods. Direct assessment method was based on accident statistics which was widely used in road traffic management. Though the method was simple to operate, it also had some disadvantages, such as relatively small of the road traffic accidents data, relatively long of the statistical period, great randomness of the accident and other problems.
Traffic conflict technique is the representative method of the indirect traffic safety evaluation which has obvious advantages, relatively large number of conflict, short period and strong regularity. It was extremely widely applied in the field of road traffic safety. However, traffic conflict observed manually always was arbitrary, taking a lot of manpower and resources.
Therefore SSAM (Surrogate Safety Assessment Model) which was developed by the United States Federal Highway Administration was used to analyze micro-simulation model output trajectory file. SSAM employed the simulation method to analyze the security.
[image:3.612.321.524.317.369.2]The road section used in sensitivity simulation analysis of speed guidance control was shown in Figure 3. It was the inner ring expressway in Shanghai about 5.2km long.
365m 690m 1030m 685m 316m 1033m 695m 310m
1 2 3 4 5 6 7 8
Figure 3: Simulation Sections Of Expressway
The research road section contained bottleneck caused by reducing lane which provided a direct target object to analyze the speed guidance control effect. The section was divided into eight parts and each one affected by speed guidance control. The cycle of speed guidance control changed was 1 minute. Macroscopic dynamic traffic flow model parameters were shown in Table 1.
Table 1: Model Parameters
Parameter Value
T/(s) 10
τ/(s) 18
v f/(km·h
-1)
78 γ/(km2·h-1)
10
ρcrit/(veh·km-1) 38
ρmax/(veh·km-1) 150
Driver compliance rate and traffic demand were considered in sensitivity simulation analysis of urban expressway under speed guidance control. Driver compliance rate rose up from 0% to 100% step by 10% increments. 0% represented no speed guidance control and 100% represented the driver fully complied the speed guidance control.
[image:3.612.120.277.437.561.2] [image:3.612.314.520.482.600.2]ISSN: 1992-8645 www.jatit.org E-ISSN: 1817-3195
291 step by 250 veh/h increments. Traffic demand of the downstream entrance ramp rose up from 1000veh/h to 3500veh/h step by 500 veh/h increments.
[image:4.612.78.534.60.377.2]According to the traffic demand of ramp and entrance, model of traffic demand was divided into six categories as shown in Table 2. Model A, B, C and D represented that the traffic demand was in low level. Models E and F corresponded to high traffic demand. Different random seed was selected and 6 times simulation had been carried out. Then the average result was utilized to analyze and evaluate the program.
Table 2: Traffic Demand Pattern
Traffic demand
pattern
Mainline traffic demand
Upstream ramp traffic
demand
Downstream ramp traffic demand
A 1000veh/h 500veh/h 1000veh/h
B 1500veh/h 750veh/h 1500veh/h
C 2000veh/h 1000veh/h 2000veh/h
D 2500veh/h 1250veh/h 2500veh/h
E 3000veh/h 1500veh/h 3000veh/h
F 3500veh/h 1750veh/h 3500veh/h
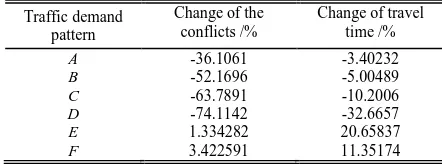
[image:4.612.83.305.266.353.2] [image:4.612.82.303.461.543.2]Each mode contained eleven different kinds of driver compliance rates; simulation analysis was conducted in VISSIM software. 1 km part of the expressway was selected as the travel time monitoring segment. Statistics of travel time under different traffic demand patterns were shown in Table 3.
Table 3: Change Of Conflicts And Travel Time Under Speed Guidance Control
Traffic demand pattern
Change of the conflicts /%
Change of travel time /%
A -36.1061 -3.40232
B -52.1696 -5.00489
C -63.7891 -10.2006
D -74.1142 -32.6657
E 1.334282 20.65837
F 3.422591 11.35174
On the other hand, TRG files generated by VISSIM simulation results were analyzed through SSAM. Conflicts were contrastive processed and the results shown in Figure 4 and Figure 5.
A B C D E F
0 0.5 1 1.5 2 2.5 3 3.5 4 4.5
5x 10 5
Traffic demand pattern
T
he num
ber
of
c
onf
lic
ts
0% under control 10% under control 20% under control 30% under control 40% under control 50% under control 60% under control 70% under control 80% under control 90% under control 100% under control
1 2 3 4 5 6 7 8 9 10 11
Figure 4: Conflicts Under Different Traffic Demand
A B C D E F
0 20 40 60 80 100 120
Traffic demand pattern
T
ral
v
el
t
im
e/
(s
)
0% under control 10% under control 20% under control 30% under control 40% under control 50% under control 60% under control 70% under control 80% under control 90% under control 100% under control
1 2 3 4 5 6 7 8 9 10 11
Figure 5: Travel Time Under Different Traffic Demand Mode
The result of data analysis showed that travel time and the number of conflicts were reduced in low traffic demand when the expressway under speed guidance control. If the traffic demands in high level, both were increased immediately. The effect of speed guidance control were different, in some cases it might had a negative effect. When the speed guidance control applied in practice, detailed analysis about its boundary conditions should be considered to maximize the positive effect.
5.
CONCLUSIONISSN: 1992-8645 www.jatit.org E-ISSN: 1817-3195
292 circumstances when the speed guidance control involved in the management and control of urban expressway.
ACKNOWLEDGEMENTS
This work was supported by National Natural Science Foundation of China (No. 61004113).
REFERENCES:
[1] N.L. Zhao, L. Yu, H. Zhao, et al, “Analysis of traffic flow characteristics on ring road expressways in Beijing using floating car data and remote traffic microwave sensor data”, Transportation Research Record, Vol. 2124, No. 1, 2009, pp. 178-185.
[2] R.C. Carlson, I. Papamichail, M. Papageorgiou, et al, “Optimal motorway traffic flow control involving variable speed limits and ramp metering”, Transportation Science, vol.44, No. 2, 2010,pp. 238-253.
[3] A. Hegyi, B. De Schutter, J. Hellendoorn, “Optimal coordination of variable speed limits to suppress shock waves”, IEEE Transactions on Intelligent Transportation Systems, vol.6, No.1,2005,pp. 102-112.
[4] L. Chen, A. May, D. Auslander, “Freeway ramp control using fuzzy set theory for inexact reasoning”, Transportation Research Part A, Vol. 24, No. 1, 1990,pp. 15-25.
[5] A. Kotsialos, M. Papageorgiou, A. Messmer, “Coordinated and integrated control of motorway networks via non-linear optimal control”, Transportation Research Part C, Vol. 10,No.2,2002, pp. 65-84.
[6] M. Hasan, M. Ben-Akiva, “Evaluation of ramp control algorithms using microscopic traffic simulation”, Transportation Research Part C, Vol.10, No.3, 2002,pp.229-256.
[7] Allaby, B. Hellinga, M. Bullock, “Variable speed limits: safety and operational impacts of a candidate control strategy for freeway applications”, IEEE Transactions on Intelligent Transportation Systems, Vol. 8, No. 4, 2007, pp. 671-680.
[8] H. J. Payne, “Models of freeway traffic and control”, Simulation Council Proceedings, Vol. 1, No. 1, 1971, pp. 51-61.
[9] M. Papageorgiou, “Macroscopic modeling of traffic flow on the Boulevard Paripherique in Paris”, Transportation Research Part B, Vol. 23, No. 1, 1989, pp.29-34.
[10] M. Papageorgiou, M.Blosseville, “Modeling and real-time control of traffic flow on the Southern Part of Boulevard Peripherique in Paris”, Transportation Research Part A, Vol. 24, No. 5, 1990, pp.345-359.