12
Word-Embedding based Content Features for Automated Oral
Proficiency Scoring
Su-Youn Yoon, Anastassia Loukina, Chong Min Lee, Matthew Mulholland, Xinhao Wang and Ikkyu Choi
Educational Testing Service 660 Rosedale Road, Princeton, NJ, USA
syoon,aloukina,clee001,xwang002,mmulholland,[email protected]
Abstract
In this study, we develop content features for an automated scoring system of non-native En-glish speakers’ spontaneous speech. The features calculate the lexical similarity between the question text and the ASR word hypothesis of the spoken response, based on traditional word vector models or word embeddings. The proposed features do not require any sample training responses for each question, and this is a strong advantage since collecting question-specific data is an expensive task, and sometimes even impossible due to concerns about question exposure. We explore the impact of these new features on the automated scoring of two different question types: (a) providing opinions on familiar topics and (b) answering a question about a stimulus material. The proposed features showed statistically significant correlations with the oral profi-ciency scores, and the combination of new features with the speech-driven features achieved a small but significant further improvement for the latter question type. Further analyses suggested that the new features were effective in assigning more accurate scores for responses with serious content issues.
1 Introduction
This study aims to develop new features to score the content of non-native speakers’ spontaneous speech as a part of an automated oral proficiency scoring system. The system provides holistic proficiency scores using audio files and their transcriptions generated by an automated speech recognition (ASR) system. Previously, studies in automated speech scoring have mainly focused on assessment of fluency (Cucchiarini et al., 2000; Zechner et al., 2009), pronunciation (Witt and Young, 1997), and intonation and rhythm (Lai et al., 2013; Wang et al., 2015). More recently, researchers started exploring assessment of grammar (Chen and Zechner, 2011; Bhat and Yoon, 2015) and vocabulary(Yoon et al., 2012).
To date, limited studies have explored approaches to evaluating the content of spoken responses. Xie et al. (2012) explored content features based on the lexical similarity between the response and a set of sample responses for each question. A content-scoring component based on word vectors was also part of the automated scoring engine described by Cheng et al. (2014). In both of these studies, content features were developed to supplement other features measuring various aspects of speaking proficiency. Neither study reported the relative contributions of content and speech features to the system perfor-mance. Loukina et al. (2017) considered a content-scoring engine based on many sparse features such as unigrams and bigrams and trained on a large corpus of existing responses. They showed that this approach achieved performance comparable to that based on fluency and pronunciation, but there was only little improvement from combining the two sets of features.
Approaches like those above require a sizable amount of response data for each question, and collect-ing question-specific data is an expensive and difficult task. Furthermore, for high-stakes assessment this can be impossible due to concerns about question exposure. A content feature that does not require any test takers’ responses for new questions has a strong advantage when scoring a large scale operational assessment.
To address this issue, Higgins et al. (2006) developed a system for scoring off-topic essays without the need for question-specific responses; the system was based on similarity features between the question text and the test response. The performance of this system was lower than the benchmark system trained on question-specific responses, but it achieved a substantial improvement over a majority-based baseline. Louis and Higgins (2010) further improved this system by expanding question texts to include synonyms, inflected forms, and distributionally similar words to the question content. The performance of Louis and Higgins (2010) showed a substantial improvement for questions consisting of only a small amount of text. More recently, Evanini et al. (2013) developed a set of content features based on both the questions and listening and reading materials for automated speech scoring and reported significant correlations between these content features and the proficiency scores.
Various approaches based on deep-neural networks (DNN) and word-embeddings trained on large corpora have showed promising performance in various NLP tasks, such as document similarity detection (Kusner et al., 2015; Mueller and Thyagarajan, 2016; Neculoiu et al., 2016). In contrast to traditional similarity features, which are limited to a reliance on exact word matching, these new approaches have the advantage of capturing topically relevant words that are not identical. Yoon et al. (2017) and Rei and Cummins (2016) applied this approach to the task of off-topic detection in spoken responses and essays, respectively, and achieved substantial improvements over systems that only use word-matching.
In this study, we combine the approach suggested by Evanini et al. (2013) and with more recent advances in word embeddings and develop a new set of low-resource content features: these features are trained using the prompt text expanded with word-embeddings without relying on any pre-existing responses to a given question. We conducted the following research:
• Using the prompt texts included in each question, we developed two sets of content features: fea-tures based on the traditional content vector analysis (CVA) approach and feafea-tures based on word embeddings.
• We trained automated scoring models using traditional speech-driven features and new content fea-tures and compared the performance of the models.
• We investigated the impact of question types on the performance of the content features and the automated scoring models. We provided an in-depth discussion about what aspects of the content can be assessed by these new content features.
2 Data
We used a large collection of spoken responses from an assessment of English proficiency for academic purposes1. The speaking section of the assessment was composed of6questions in which speakers were prompted to provide responses lasting between 45 and60 seconds per question, resulting in approxi-mately5.5minutes of speech per speaker. All questions extracted spontaneous speech.
Among the6questions, two questions (hereafter, Independent questions) asked examinees to provide information or opinions on familiar topics based on their personal experience or background knowledge. These questions were short and typically consisted of just a few sentences. The questions were designed to elicit responses based on personal experience or views on specific topics. Thus, the responses differed widely in their content. For the four remaining questions (hereafter, Integrated questions), test takers read and/or listened to stimulus materials and then answered a question relevant to the passage. We used 49 Independent questions and 98 Integrated questions in this study.
All responses were scored by trained raters using a 4-point scoring scale, where 1 indicates low speak-ing proficiency and 4 indicates high speakspeak-ing proficiency. The rubrics consist of three major perfor-mance categories: delivery (pronunciation, intonation, rhythm, and fluency), language use (diversity, sophistication, and precision of vocabulary, and range, complexity, and accuracy of grammar), and topic development (progression of ideas, the degree of elaboration and completeness). We used the TOEFL iBT Speaking Test Rubrics, which provide descriptions about the typical characteristics of candidate
performance for each score level. Approximately 10% of data set was double-scored, and an estimation of the inter-rater agreement was obtained from this dobule-scored sub-set. Both Pearson correlation and weighted kappa were0.54for Independent questions and0.61for Integrated questions.
We used 103,868and 49,281responses for training and evaluation of automated scoring models, respectively. In addition, 154,992responses were used to obtain an inverse-document frequency (idf) model for content features. The proposed features in this study did not use any question-specific sample responses for content model training, and thus, theidf Train set did not contain any responses answering the questions used in the scoring models. Finally, we used73,500responses to train question-specific content models as a benchmark. The size of the data sets is summarized in Table 1.
Dataset N. of questions N. of responses Responses
per question Integrated Independent Total
Scoring Model Train 147 34,426 69,442 103,868 706.6
Scoring Model Evalua-tion
147 16,298 32,983 49,281 335.2
idf Train 438 53,323 101,669 154,992 353.9
Question-specific Content Model Train
147 (same ques-tions as Scoring Model partition)
73,500 24,500 49,000 500
Table 1: Number of questions, and responses for each partition
There were no overlaps among all datasets. There was a strong bias towards the middle scores (score 2 and 3); the most frequent score was3(50%) and followed by2(37%) with approximately 87% of the responses belonging to these two score levels. The percentages of responses with score4 and score1
were 9% and 4%, respectively.
3 Features
3.1 Content features
We developed two sets of content features using the prompt texts. The prompt texts consisted of the question sentences and optional listening and reading materials.
The first feature was atf −idf (term frequency - inverse document frequency) weighted cosine simi-larity score between the prompt text and the response (hereafter,prompt-based CVA). First, we obtained anidf model using theidf Train set which covered a wide range of questions except the147questions used in Scoring Model Train and Evaluation set. For each word in theidf Train set, we calculated the total number of responses divided by the number of responses containing it. Next, we built a question-specifictf model for each question. We converted the prompt text into a single vector and counted the number of the occurrences for each word.
The second set of features were features based on word-embeddings. Using the publicly available word embedding vectors trained on the Google News corpus by Mikolov et al. (2013), we developed the following two features used for the off-topic essay detection in Rei and Cummins (2016):
• averaged word embeddings: we created a vector for each question by mapping each word in the question text to a corresponding word embedding vector and averaging them. Next, we created a vector for a test response using the same process. Finally, we calculated the cosine similarity between the question vector and the response vector.
As a benchmark, we compare the proposed features, which are based only on the prompt materials, to a feature trained on the test takers’ sample responses to the147questions (hereafter,response-based CVA). First, we obtained the ASR-based transcriptions for responses in the Question-specific Content Model Train set. All responses that answer the same question were converted into a single vector and a question-specifictf was built from this vector using the same process as the prompt-based tf model. Finally, we calculated atf −idf weighted cosine similarity score between a test response vector and the question-specifictf vector.
3.2 Speech-driven features
We used 35 features generated by an automated proficiency scoring system for non-native speakers’ spontaneous speech. For a given spoken response, the system performs speech processing, including speech recognition, forced-alignment, pitch and power analysis, and generates a word hypotheses and time stamps. Given the word hypotheses and descriptive features of pitch/power, it generates the follow-ing five groups of features that capture information relevant to fluency and pronunciation. The numbers in parentheses are the number of features that belong to each group.
• Speech rate features (3): These features compute the words spoken per minute with and without trailing and leading pauses. Speech rate has been consistently identified as one of the major co-variates of language proficiency and the features in this group have some of the highest correlations with the overall human score.
• Segmental quality features (6): These features measure how much the pronunciation of individual segments deviates from the pronunciation that would be expected from a proficient speaker. Features are derived from the confidence scores of the ASR system or acoustic scores of the forced alignment system. For instance, the normalized confidence score of the ASR system belongs to this group.
• Pause pattern features (9): These features capture pausing patterns in the response, such as mean duration of pauses, mean number of words between two pauses, and the ratio of pauses to speech.
• Prosody features (11): These features measure patterns of variation in the time intervals between stressed syllables as well as the number of syllables between adjacent stressed syllables (Zechner et al., 2011).
• Timing features (6): These features capture variation in the duration of vowels and consonants. This category includes features such as relative proportion of vocalic intervals or variability in ad-jacent consonantal intervals (Lai et al., 2013) as well as features which compare vowel duration to reference models trained on native speakers (Chen et al., 2009).
4 Experiment 1
4.1 Feature Generation
We first generated word hypotheses for each response in Table 1 using an ASR system. A gender in-dependent acoustic model (AM) was trained on 800 hours of spoken responses extracted from the same English proficiency test using the Kaldi toolkit (Povey et al., 2011). The AM training dataset consisted of 52,200 spoken responses from 8,700 speakers. It was based on a 5-layer DNN withp-norm nonlinearity using layer-wise supervised backpropagation training. The language model (LM) was a trigram model trained using the same dataset used for AM training. This ASR system achieved a Word Error Rate of 23% on 600 held-out responses. Detailed information about the ASR system is provided in (Tao et al., 2016).
Next, we normalized both the prompt texts and the ASR-based transcriptions of the responses; all words were tokenized, and stop words and disfluencies were removed from the texts. The length of the original and the processed texts after removing stop words and disfluencies are summarized in Table 2.
Question
type Text normalization
Prompts Responses
mean STD max min mean STD max min Independent tokenized 41.0 15.5 100 20 97.3 22.1 173 11
+stop word and disflu-ency removal
27.5 10.9 72 14 40.4 10.35 85 0
Integrated tokenized 341.6 37.5 446 249 129.5 31.11 248 11 +stop word and
disflu-ency removal
[image:5.595.76.518.62.174.2]230.3 26.1 302 168 53.1 13.7 107 0
Table 2: Descriptive analysis of the number of words in prompt texts and responses
After removing stop words and fillers, the texts were approximately2/3of the original texts. The re-sponses contained an average of97words for the Independent responses and129words for Integrated re-sponses, but there were large variations across different responses. After the normalization process, the length of the responses was40%of the original responses on average. The responses were shortened in larger proportion than the prompts because the responses contained disfluencies such as ‘uh’, ‘um’, which were removed.
From these normalized transcriptions, we created four content features as described in Section 3. In addition,35speech-driven features were generated using the original wave files and the same ASR word hypotheses.
4.2 Results
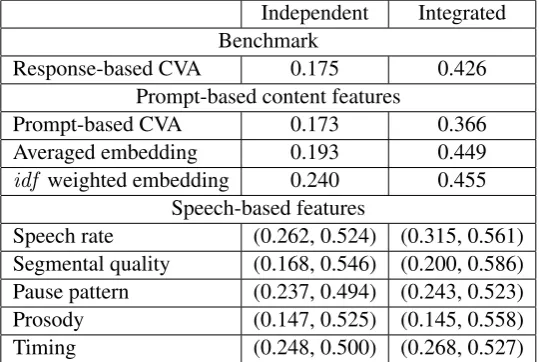
First, we conducted correlation analyses between features and human scores using the Scoring Model Train set. Table 3 presents Pearson correlation coefficients. For speech-driven features, the minimum and maximum for each group are presented.
Independent Integrated Benchmark
Response-based CVA 0.175 0.426 Prompt-based content features
Prompt-based CVA 0.173 0.366
Averaged embedding 0.193 0.449 idf weighted embedding 0.240 0.455
Speech-based features
Speech rate (0.262, 0.524) (0.315, 0.561) Segmental quality (0.168, 0.546) (0.200, 0.586) Pause pattern (0.237, 0.494) (0.243, 0.523) Prosody (0.147, 0.525) (0.145, 0.558) Timing (0.248, 0.500) (0.268, 0.527)
Table 3: Pearson Correlation Coefficients between features considered in this study and human scores for Independent and Integrated questions.
The correlations of content features were largely influenced by the question types. In general, the correlations for Integrated questions were substantially higher than those for Independent questions. The best performing feature was idf weighted embedding, and the correlation coefficients were0.240and
0.455, respectively.
[image:5.595.163.433.423.604.2]of pause pattern group (0.494for Independent questions). Among all features, the normalized acoustic model score in the Segmental quality group showed the best correlation with human scores with coeff-cients of0.546for Independent and0.586for Integrated.
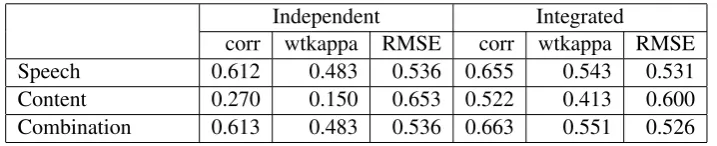
We next considered whether adding content features to speech features improves performance of the automated scoring model. We trained multiple linear regression (MLR) models using both speech-driven and content features as the independent variables and the human score as the dependent variable. In order to compare the performance of the new features with the speech-driven features and investigate the impact of adding them to the existing model, we trained three models: speech (model based on 35 speech-driven features), content (model based on 3 prompt-based content features), and combination (model based on both speech-driven and content features, 38 features in total). In order to investigate the impact of the question types on the performance of content features, we trained each model for Independent and Integrated questions separately, yielding a total of 6 models. The models were trained on the Scoring Model Train partition using RSMTool (Madnani et al., 2017). Table 4 shows the performance of all models in terms of agreement between automated and human scores.
Independent Integrated
[image:6.595.119.478.263.336.2]corr wtkappa RMSE corr wtkappa RMSE Speech 0.612 0.483 0.536 0.655 0.543 0.531 Content 0.270 0.150 0.653 0.522 0.413 0.600 Combination 0.613 0.483 0.536 0.663 0.551 0.526
Table 4: Correlations, weighted kappas and root mean squared error (RMSE) between the automated scores and human scores
We observed the following points:
• The performance of content models was strongly influenced by question type; the model perfor-mance for the Integrated questions was consistently better than that for the Independent questions.
• The speech models outperformed the content models for both question types.
• The combination of content features and speech-driven features (feature-level fusion) achieved a further improvement for Integrated questions; both correlations and weighted kappas increased ap-proximately0.008in absolute value. Based on the Steigers Z-test for dependent correlations, this improvement was statistically significant at 0.01 level (p <0.01).
4.3 Discussion
While adding content features lead to a statistically significant improvement in model performance for Integrated questions, this improvement was small and the scores from the two models were highly cor-related with r = 0.986. Content features also received very low coefficients in the linear regression. However, the result is consistent with previous studies; Loukina and Cahill (2016) observed that con-tent features such as unigrams or bigrams trained on question-specific sample responses achieved little improvement when combined with speech-driven features. They further argued that the majority of speakers who perform well along one dimension of language proficiency are also likely to perform well along other dimensions (see also Xi (2007), who reports similar results for human analytic scores). Con-sequently, the gain in performance from combining different systems is small or non-existent.
Figure 1: Average score predicted by the model based on speech features (blue) and content features (orange) for responses with different human scores.
Human score 1.0 2.0 3.0 4.0 All
[image:7.595.216.399.65.215.2]N 1,548 12,721 16,054 2,661 32,984 Speech 0.860 0.523 0.387 0.925 0.531 Combination 0.836 0.518 0.389 0.912 0.526 Difference -0.024 -0.005 0.002 -0.013 -0.005
Table 5: RMSE between the human scores and automated scores generated by the ‘Speech’ model, RMSE between the human scores and automated scores generated by the ‘Combination’ model, and the difference in RMSE between the two models.
We calculated RMSE between human scores and automated scores and averaged them for each human score level (see Table 5). Adding content features to speech features improved the model performance on low-proficiency responses: the decrease in RMSE was largest for score point 1 where it decreased from 0.86 to 0.84. Since less than 5% of the responses received score 1, this improvement had very little impact on overall model performance.
5 Experiment2
In Experiment 1, we found that new content features could reduce the automated score errors for the lowest score point. Based on this observation, we hypothesized that the new features could identify responses with substantial content issues and assign more accurate scores than the model based only on the speech-driven features for these responses. In order to examine this hypothesis, we artificially created a dataset with content issues by pairing responses with mismatched prompts for feature calculation.
5.1 Data
We first randomly selected 438 questions that did not overlap with the 147 questions used for the Scoring Model Train and Evaluation sets. Each question in our assessment was designed to elicit content that was substantially different from other questions, and therefore, mismatched responses have substantial con-tent issues. For each question in the set of147, we randomly selected100responses from the responses to the438questions. A total of14,700responses (4,900responses for Independent questions and9,800
5.2 Method
For each response in the content-abnormality dataset, we generated both speech-driven features and con-tent features. For the concon-tent features, we did not use the original prompt text that elicited the response, but instead we used the new prompt text that was one of the 147questions randomly selected as de-scribed in Section 5.1. Next, we generated three automated scores using the automated models dede-scribed in Section 4.
[image:8.595.201.392.204.261.2]5.3 Results
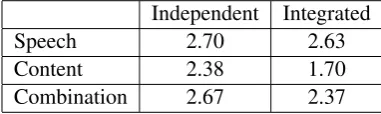
Table 6 presents the average of the automated scores of the content abnormality dataset.
Independent Integrated
Speech 2.70 2.63
Content 2.38 1.70
Combination 2.67 2.37
Table 6: Comparison of the automated scores for responses with content abnormality
The average scores of the speech models were 2.70 for Independent questions and 2.63 for Inte-grated questions, and they were similar to the average of the original human scores. In contrast, the average scores of the content models were lower than those of the speech models, and this trend was par-ticularly salient for the Integrated questions. Finally, the models based on both features assigned lower scores than speech models on average, but the differences were relatively small; it was0.03for Inde-pendent questions and0.26for Integrated questions. This may be due to the low coefficients assigned to the content features in the linear regression models; the coefficients for Independent questions were lower than Integrated questions, and the difference of Independent questions was even smaller than that of Integrated questions.
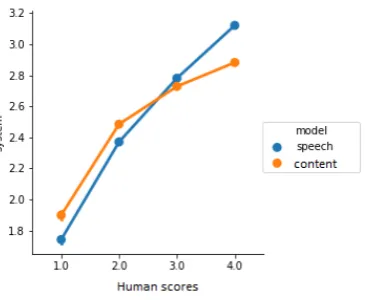
[image:8.595.173.428.460.613.2]Next, we further analyzed the automated scores for Integrated questions. Figure 2 shows the relation-ships between the automated scores and the original human scores.
Figure 2: Average predicted scores of the models based on speech features (blue), content features (orange), and both feature sets (gray) conditioned by human scores.
the content abnormality. In contrast, the content model consistently assigned lower scores for responses with the content abnormality. This result supports that the new content features are sensitive to the severe content issues and predict a more accurate score, which penalizes the content issues appropriately.
5.4 Discussion
Experiment 1 showed that the new content features improved the scoring accuracy for the responses with the lowest proficiency score. Furthermore, experiment 2 showed that these features could prevent the inflation of automated scores for responses with the critical content abnormality that caused a severe mismatch between delivery and content. However, we did not uncover evidence that new content features can improve score accuracy for responses with subtle and complicated content issues. These results are expected considering the nature of the proposed content features. The features were based on word unigrams and therefore may be able to make distinctions between responses with or without key concepts. However, they would not be able to differentiate whether the combination of these individual words conveys an appropriate meaning or not, which may be a key point for differentiating proficiency levels between the intermediate and advanced learners. Further qualitative review of a small set of responses was consistent with this conclusion: the scores of the content model were more accurate than those of the speech model when scoring responses with good coverage of the key words but low fluency. However, both models assigned high scores to responses that could be described as a continuous stream of mostly intelligible and relevant words but incoherent in terms of the content.
The holistic proficiency scores were not only based on the content, but raters also took into account other aspects of speaking proficiency, such as pronunciation, fluency, grammar, and vocabulary. How-ever, if a test taker has comparable skills across all performance categories, then the score based on only one performance category may be comparable to the holistic proficiency score. For instance, if a re-sponse shows comparable skills for both the delivery and content, then the delivery-based score may be similar to the holistic proficiency score. If the majority of responses belong to this type, automated scores only measuring limited performance categories may show strong correlations with the experts’ holistic proficiency scores. In this study, correlations between the automated scores based solely on speech fea-tures and the scores based on the combination of the content and speech feafea-tures were very high, and two scores were seemingly identical. However, when scoring responses with severe content abnormality, the two scoring models showed different behaviors, and the scores based on both content and speech features correctly reflected the content abnormality. This result illustrates the importance of the coverage of the performance categories that automated scoring models assess; when scoring responses with mismatched proficiency levels in different performance categories, automated scoring systems assessing with limited coverage may show sub-optimal performance.
6 Conclusions
In this study, we proposed content features for an automated scoring system of non-native speakers’ spontaneous speech. The content features calculated the similarity between the prompt texts and the ASR hypothesis of test responses, and therefore do not require any sample responses for each item during the training. The inclusion of new features achieved a small but statistically significant improvement for Integrated questions over the existing model based on speech-driven features solely assessing delivery skill. A further experiment using responses with artificially induced content abnormality showed that the inclusion of the new features may increase the validity of the automated scores by preventing the system from generating inflated scores for responses with good delivery skills but severe content issues.
Acknowledgements
References
Suma Bhat and Su-Youn Yoon. 2015. Automatic assessment of syntactic complexity for spontaneous speech scoring.Speech Communication, 67:42–57.
Miao Chen and Klaus Zechner. 2011. Computing and evaluating syntactic complexity features for automated scoring of spontaneous non-native speech. InProceedings of the 49th Annual Meeting of the Association for Computational Linguistics 2011, pages 722–731.
Lei Chen, Klaus Zechner, and Xiaoming Xi. 2009. Improved pronunciation features for construct-driven assess-ment of non-native spontaneous speech. InProceedings of NAACL, pages 442–449.
Jian Cheng, Yuan Zhao D’Antilio, Xin Chen, and Jared Bernstein. 2014. Automatic assessment of the speech of young English learners. InProceedings of the Workshop on Innovative Use of NLP for Building Educational Applications, pages 12–21.
Catia Cucchiarini, Helmer Strik, and Lou Boves. 2000. Quantitative assessment of second language learners fluency by means of automatic speech recognition technology. The Journal of the Acoustical Society of America, 107(2):989–999.
Keelan Evanini, Shasha Xie, and Klaus Zechner. 2013. Prompt-based content scoring for automated spoken lan-guage assessment. InProceedings of the Eighth Workshop on Innovative Use of NLP for Building Educational Applications, pages 157–162.
Derrick Higgins, Jill Burstein, and Yigal Attali. 2006. Identifying off-topic student essays without topic-specific training data. Natural Language Engineering, 12(02):145–159.
Matt Kusner, Yu Sun, Nicholas Kolkin, and Kilian Q. Weinberger. 2015. From word embeddings to document distances. InProceedings of the 32nd International Conference on Machine Learning (ICML-15), pages 957– 966.
Catherine Lai, Keelan Evanini, and Klaus Zechner. 2013. Applying rhythm metrics to non-native spontaneous speech. InProceedings of SLaTE, pages 159–163.
Annie Louis and Derrick Higgins. 2010. Off-topic essay detection using short prompt texts. InProceedings of the NAACL HLT 2010 Fifth Workshop on Innovative Use of NLP for Building Educational Applications, pages 92–95. Association for Computational Linguistics.
Anastassia Loukina and Aoife Cahill. 2016. Automated scoring across different modalities. InProceedings of the Workshop on Innovative Use of NLP for Building Educational Applications, pages 130–135.
Anastassia Loukina, Nitin Madnani, and Aoife Cahill. 2017. Speech- and Text-driven Features for Automated Scoring of English Speaking Tasks. InProceedings of the First Workshop on Speech-Centric Natural Language Processing, pages 67–77, Copenhagen, Denmark. Association for Computational Linguistics.
Nitin Madnani, Anastassia Loukina, Alina von Davier, Jill Burstein, and Aoife Cahill. 2017. Building better open-source tools to support fairness in automated scoring. InProceedings of the EACL Workshop on Ethics in Natural Language Processing, pages 41–52.
Tomas Mikolov, Ilya Sutskever, Kai Chen, Greg S Corrado, and Jeff Dean. 2013. Distributed representations of words and phrases and their compositionality. In Advances in neural information processing systems, pages 3111–3119.
Jonas Mueller and Aditya Thyagarajan. 2016. Siamese recurrent architectures for learning sentence similarity. InProceedings of the Thirtieth AAAI Conference on Artificial Intelligence, AAAI’16, pages 2786–2792. AAAI Press.
Paul Neculoiu, Maarten Versteegh, and Mihai Rotaru. 2016. Learning text similarity with siamese recurrent networks. InProceedings of the 1st Workshop on Representation Learning for NLP, pages 148–157, Berlin, Germany, August. Association for Computational Linguistics.
Marek Rei and Ronan Cummins. 2016. Sentence similarity measures for fine-grained estimation of topical rele-vance in learner essays. InProceedings of the 11th Workshop on Innovative Use of NLP for Building Educa-tional Applications, pages 283–288.
Jidong Tao, Shabnam Ghaffarzadegan, Lei Chen, and Klaus Zechner. 2016. Exploring deep learning architec-tures for automatically grading non-native spontaneous speech. In Acoustics, Speech and Signal Processing (ICASSP), 2016 IEEE International Conference on, pages 6140–6144. IEEE.
Xinhao Wang, Keelan Evanini, and Su-Youn Yoon. 2015. Word-level f0 modeling in the automated assessment of non-native read speech. InSLaTE, pages 23–27.
Silke Witt and Steve Young. 1997. Performance measures for phone-level pronunciation teaching in CALL. In Proceedings of the Workshop on Speech Technology in Language Learning, pages 99–102.
Xiaoming Xi. 2007. Evaluating analytic scoring for the TOEFLR Academic Speaking Test (TAST) for opera-tional use. Language Testing, 24(2):251–286.
Shasha Xie, Keelan Evanini, and Klaus Zechner. 2012. Exploring content features for automated speech scoring. InProceedings of NAACL, pages 103–111.
Su-Youn Yoon, Suma Bhat, and Klaus Zechner. 2012. Vocabulary profile as a measure of vocabulary sophis-tication. In Proceedings of the Seventh Workshop on Building Educational Applications Using NLP, pages 180–189. Association for Computational Linguistics.
Su-Youn Yoon, Chong Min Lee, Ikkyu Choi, Xinhao Wang, Matthew Mulholland, and Keelan Evanini. 2017. Off-topic spoken response detection with word embeddings. Proc. Interspeech 2017, pages 2754–2758.
Klaus Zechner, Derrick Higgins, Xiaoming Xi, and David M. Williamson. 2009. Automatic scoring of non-native spontaneous speech in tests of spoken English. Speech Communication, 51(10):883–895.