ORIGINAL ARTICLE DOI 10.1007/s10086-003-0529-7
Yuko Fujiwara · Yoshihisa Fujii · Yutaka Sawada Shogo Okumura
Assessment of wood surface roughness: comparison of tactile roughness
and three-dimensional parameters derived using a robust Gaussian
regression filter
Received: October 30, 2002 / Accepted: February 21, 2003
Abstract Japanese oak and Japanese beech were sanded by hand with abrasive papers of varying grit number. Two three-dimensional parameters selected to characterize their surface roughness – one parameter for the distribution of roughness-profile peaks and the other for the relative area of the roughness-profile peaks above the threshold height – were compared against tactile roughness. The parameters were obtained from roughness profiles as determined by a robust Gaussian regression filter (RGRF) using seven cut-offs. The RGRF filtering process was adjusted specifically for the evaluation of wood surface roughness. Except for a cutoff wavelength of 0.25 mm, the RGRF lent itself well to the determination of roughness profiles. No distortion of roughness profiles occurred around deep valleys, and there was a good correlation between the parameters and tactile roughness.
Key words Wood surface roughness · Tactile roughness · Three-dimensional parameter · Robust Gaussian regression filter
Introduction
Surface roughness is an important criterion when assessing wood product quality. It is usually evaluated by surface texture parameters defined in standards such as ISO 4287-1997 and JIS B 0601-2001. However, these parameters, which are based on a single roughness profile, cannot
Y. Fujiwara (*)w · Y. Fujii · Y. Sawada · S. Okumura
Graduate School of Agriculture, Kyoto University, Kyoto 606-8502, Japan
Tel. 81-75-753-6245; Fax 81-75-753-6245 e-mail: [email protected]
Part of this study was presented at the 2002 Kansai Branch Office lecture meeting of the Japan Society for Precision Engineering, Kyotanabe, August 2002
always adequately characterize the surface roughness of wood because the surface of machined wood shows irregu-larities caused by heterogeneities in both machining tools and the cellular structure of wood. There is no established parameter for characterizing the roughness of wood sur-faces despite numerous reports1–7
published on the subject since the 1950s.
Such a parameter would have to correspond to tactile roughness because the surface of wood products is often assessed by tactile contact. Only a few reports have exam-ined the relation between the surface roughness of wood and tactile roughness. Fujii et al.8
found that there was no relation between certain parameters described in JIS B 0601-1994 and tactile roughness. Fujiwara et al.9–11
tried to link three-dimensional parameters, which are also what the present study is based on, to tactile roughness. Their at-tempt failed because the primary profile had local deep valleys due to vessel features in the wood. This was mainly due to the filtering process of ISO 11562-1996, in which roughness profiles are pushed up at the edges of vessels above original primary profiles, and artificial peaks appear around the edges. These artificial peaks, which have little effect on tactile roughness, strongly distort the roughness profiles on which the parameters are based. To eliminate such effects, Brinkmann et al.12
applied the robust Gaussian regression filter13
(RGRF) to the evaluation of a metal sur-face processed by plateau honing and showed that it is applicable to surfaces with local deep valleys. With this filtering scheme, the tolerance to end the filtering process should be preset according to the material and the purpose of the evaluation.
Materials and method
Specimens
Specimens (35 65 15 mm) of air-dried flat and edge grain boards of Japanese oak (Quercus mongolica var. grosseserrata) and Japanese beech (Fagus crenata) were sanded manually with the grain using varying grit numbers of abrasive papers: P80, P120, P150, P180, and P240. The fiber direction was parallel to the 35-mm side of the speci-mens. The average annual ring widths and specific gravities were 0.64–2.00 mm and 0.59–0.69, respectively, for speci-mens of Japanese oak and 1.2–3.1 mm and 0.63–0.69, re-spectively, for Japanese beech.
Surface roughness measurement
Primary profiles were obtained of 15 10 mm areas using a stylus instrument (Surfcom1400A-3DF-12, Tokyo Seimitsu) with a 5µm tip radius and 90° tip angle. The stylus was moved perpendicular to the fiber direction with a speed of 0.6 mm/s over a distance of 15 mm. This was repeated at 10µm intervals parallel to the fiber direction so that 1001 primary profiles were obtained for each specimen. The out-put signal from the stylus was recorded at a sampling inter-val of 10µm. Roughness profiles were obtained from the primary profiles using the RGRF with cutoffs of 0.25, 0.8, 2.5, 8.0, 16.0, and 32.0 mm.
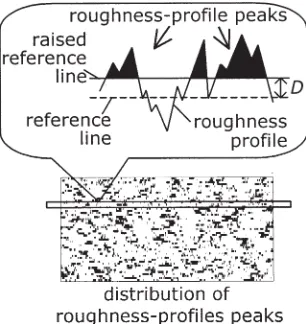
Two three-dimensional parameters (i.e., the distribution of roughness-profile peaks and the relative area of rough-ness-profile peaks above the threshold height) were used in this study. Figure 1 shows an example of the distribution of profile peaks and the definition of the roughness-profile peak. The roughness-roughness-profile peaks were defined as the outwardly directed portion of the roughness profile con-necting two adjacent points of the intersection of the profile with the raised reference line, which was set at a threshold height of D from the original reference line. The distance between the original and the raised reference line was defined as the threshold height. In the figure illustrating the distribution of the profile peaks, the roughness-profile peaks are shown in black, and the others in white. The other parameter, the relative area of roughness-profile peaks above the threshold height, was denoted by Arp in the
present study. The parameter Arp was the area of black
regions in a distribution of roughness-profile peaks. It was defined as the proportion of the number of data points above the threshold to all data points contained in the 1001 profiles.
Tolerance to stop the filtering process of the RGRF
The RGRF filtering process was described in detail by Bodschwinna13
and Brinkmann et al.,12
among others. Thus, we need only provide a brief outline of the RGRF and the determination of the threshold for stopping the filtering process used in this study. The RGRF is applicable to the
evaluation of surface irregularities of materials with local deep valleys, such as the vessels found on hardwood sur-faces. It is characterized by the iteration of the filtering process using a Gaussian regression filter (GRF), which works in the same way as the Gaussian filter defined by JIS B 0632-2001 and ISO 11562-1996, with the difference that in the case of the RGRF process there is no data loss at either end of the profile, and there is additional vertical weighting. The end of the iteration is determined using the equation
mi mi1 T (1)
where i is the number of iteration steps; mi is the median of
the difference between the primary and i-th waviness profile, which are the low-frequency components obtained from the i-th iteration of the filtering process; and T is a user-specified tolerance. Brinkmann et al.12 reported that the median value for a metal surface processed by plateau honing converges after two to five iterations. In the present study, the tolerance is determined by the following experiment.
Specimens (35 65 10 mm) obtained from air-dried flat or edge grain boards of Japanese oak, Japanese beech, and Japanese cypress (Chamaecyparis obtusa) were finished by a fixed-knife planner with a feed speed of 1 m/s. The bias angles of the knife were 15°–20° for Japanese oak and Japanese beech and 40°–45° for Japanese cypress. The fiber direction was parallel to the long side of the specimens. The species were specially selected to cover a range pore structures. Five primary profiles were obtained from the surface of each specimen using the stylus instrument men-tioned above. The stylus was moved perpendicular to the fiber direction over a distance of 30 mm, and the output signal from the stylus was recorded at a sampling interval of 5µm. Roughness profiles were obtained from the primary profiles using the RGRF with cutoffs of 0.8, 2.5, and 8.0 mm. The filtering process was completed after the 10th iteration, and the values of the medians mi (i 0, 1, 2, . . . , 10) for
the absolute value of the difference between mi and mi1
was averaged based on the five profiles for each specimen. This average is denoted by δ in this study. Waviness profiles were obtained for the 0th, 1st, 2nd, 5th, and 10th iteration steps.
Sensory evaluation
A paired comparison test was used to evaluate tactile roughness. Each of 15 male and 15 female subjects was asked to wear an eye mask obstructing his or her vision while he or she rubbed an index finger on the surface of a pair of specimens and identified the rougher of the two. The pairs of specimens were chosen randomly from among 10 specimens, and the subject judged the roughness of each possible pair from 45 pairs. The tactile perception of roughness was estimated statistically from the results of the sensory evaluation. The score for each specimen was determined according to the number of judgments of “rougher surface” using the equation
x R N
nN
0 5. (2)
where x is the score for each specimen, R is the number of judgments of “rougher surface,” N is the number of sub-jects, and n is the number of specimens. The score standard-ized using the standard deviation σ as shown in Eq. (3) is the tactile roughness Z of a specimen.
Z x 0 5.
σ (3)
where σ is defined as
σ x
n 0 5. 2
(
)
Â
. (4)Results and discussion
Tolerance to end the filtering process of RGRF
Figure 2 shows waviness profiles determined following the 0th, 1st, 2nd, 5th, and 10th iteration at a cutoff wavelength of 2.5 mm for Japanese oak, Japanese beech, and Japanese cypress superimposed on primary profiles. It is clear from Fig. 2 that the waviness profiles converge as the number of iterations is increased. For Japanese oak, the waviness pro-files for the last two iteration steps had almost the same shape. There was only a slight difference between the wavi-ness profiles of Japanese beech and Japanese cypress except for the 0th iteration step. The first few iteration steps could not remove the effects of deep valleys from the waviness profiles of Japanese oak, and the last few iteration steps were too much for Japanese beech and Japanese cypress. Figure 3 shows the variation of |mi mi1|, δ, with the
number of iteration steps for a cut-off wavelength of 2.5 mm. The values of δ for all three species decreased
exponentially with each iteration step, and those for Japanese oak were the largest at each step. This suggests that the value of δ, which is sufficiently low to remove the effects of deep valleys of Japanese oak, is enough for the convergence of the waviness profiles of Japanese beech and Japanese cypress. Based on these findings, the tolerance was selected to be 0.1µm in this study. Figure 4 shows primary, waviness, and roughness profiles for Japanese oak determined by GRF and RGRF using a tolerance of 0.1µm. The waviness profile determined by GRF was distorted Fig. 2. Variation of waviness profiles (determined by a robust Gaussian regression filter) with iteration steps for primary profiles of three species at a cutoff wavelength of 2.5 mm. The numerals 0–10 represent iteration steps in the filtering process
Fig. 3. Variation of |mi mi1|, δ, with the number of iteration steps for
downward around vessels, and the edges of vessels in a roughness profile were pushed up to produce higher peaks above the mean line compared to the primary profile. The waviness profile determined by RGRF eliminated these vessel-induced effects.
Relation between three-dimensional parameters and tactile roughness
Distribution of roughness-profile peaks
Figure 5 shows the relation between the tactile roughness and the distribution of roughness-profile peaks at seven threshold heights for a cutoff wavelength of 8.0 mm. The area of the roughness-profile peaks increased with tactile roughness for all threshold heights except for 0µm. Similar results were obtained for cutoffs of 0.8 to 32.0 mm. The Fig. 4. Primary, waviness, and
roughness profiles determined by the Gaussian regression filter (GRF) and the robust Gaussian regression filter (RGRF) at a cutoff wavelength of 8.0 mm for Japanese oak. p.p., w.p., and r.p., primary, waviness, and roughness profiles, respectively; m.l. and r.l., mean and reference lines, respectively
tactile roughness showed that the surfaces of both Japanese oak and Japanese beech sanded with P180 abrasive paper were rougher than those sanded with P150. Figure 6 shows the same distribution for Japanese oak as is seen in Figure 5 but at a cutoff wavelength of 0.25 mm and a threshold height of 10µm. For all surfaces except for P80, the rough-ness-profile peaks appeared at the edge of vessels. These peaks are a kind of artifact caused by the filtering and cannot affect the tactile feeling. This suggests that too low a cutoff wavelength is not suitable for evaluating the surface roughness of wood, especially if there are deep valleys on its surface.
Relative area of roughness-profile peaks
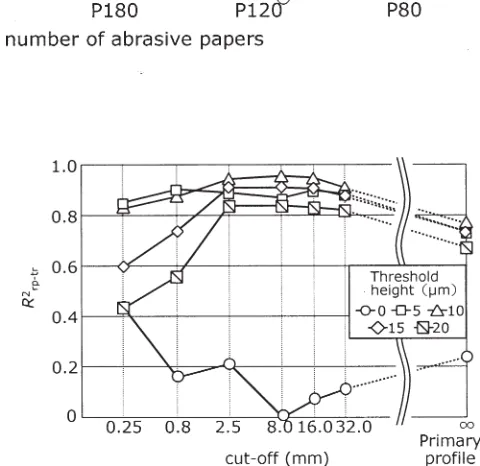
Figure 7 shows the relation between the tactile roughness and Arp at five threshold heights for a cutoff wavelength of
8.0 mm. As defined earlier, Arp is the relative area of
rough-ness-profile peaks above the threshold height. The loga-rithm of Arp increased monotonically with tactile roughness
for each threshold. The coefficient of determination (R2
) between Arp and the tactile roughness depended on the
threshold height and showed a maximum at a threshold height of 10µm.
Figure 8 shows the variation of the coefficient of deter-mination between Arp and the tactile roughness with cutoffs
for five threshold heights. Because the primary profiles can be considered the roughness profiles at a cutoff wavelength of infinity, the coefficients of determination for the primary profile were also plotted in Fig. 8. The coefficients of deter-mination showed maxima at cutoffs of 0.8–8.0 for all thresh-old heights except 0µm.
Conclusions
The roughness parameters for evaluating a wood surface should correspond to tactile roughness because the rough-ness of the wood surface is often evaluated by touch. It is better to use three-dimensional parameters to characterize the roughness of a wood surface given the material’s hetero-geneity. Two three-dimensional parameters were found to correlate well with tactile roughness. It was also found while Fig. 6. Relation between tactile
roughness and distribution of roughness-profile peaks deter-mined at a cutoff wavelength of 0.25 mm and a threshold level of 10µm for Japanese oak. Black regions denote roughness-profile peaks
Fig. 7. Relation between tactile roughness and Arp at five threshold
heights for a cutoff wavelength of 8.0 mm
estimating the parameters that the RGRF, in which a toler-ance specifically selected for the characterization of a wood surface was employed, greatly reduced the effects of deep valleys from roughness profiles. Further study is necessary to confirm the applicability of the present method to other machining processes and wood species.
Acknowledgment This research was supported by a Grant-in-Aid for Scientific Research from the Japanese Ministry of Education (Research Fellowships of the Japan Society for the Promotion of Science for Young Scientists No. 03562, 2000–2003).
References
1. Ehlers W (1958) Über die Bestimmung der Güte von Holzoberflächen. Holz Roh Werkstoff 16:49–60
2. pahlitzsch G, Dziobek K (1961) Beitrag zur Bestimmung der Oberflächengüte spanend bearbeiteter Hölzer Erste Mitteilung: Meverfahren und Beurteilungsmethoden für bandgeschliffene Hölzer. Holz Roh Werkstoff 19:403–417
3. peters CC, Cumming JD (1970) Measuring wood surface smooth-ness: a review. Forest Prod J 20:40–43
4. Westkämper E, Riegel A (1993) Qualitätskriterien für geschliffene Massivholzoberflächen. Holz Roh Werkstoff 51:121–125
5. Westkämper E, Schadoffsky O (1995) Oberflächentopographie von Massivholz: Einflüsse und Verfahren bei der messtechnishcen Erfassung und Bewertung von Holzoberflächen (Teil 1). HOB 3:74–78
Fig. 8. Variation of coefficient of determination between relative area of roughness-profile peaks and tactile roughness, R2
rptr, with cutoff
6. Westkämper E, Schadoffsky O (1995) Oberflächentopographie von Massivholz: Einflüsse und Verfahren bei der messtechnishcen Erfassung und Bewertung von Holzoberflächen (Teil 2). HOB 4:50–54
7. Lemaster R, Taylor JB (1999) High speed surface assessment of wood and wood-based composites. In: Proceedings of the 14th international wood machining seminar, Paris. Epinal, Cluny, pp 123–130
8. Fujii Y, Yoshizane M, Okumura S (1997) Evaluation of surface roughness by various parameters I. Relationships between several roughness parameters and tactile roughness (in Japanese). Mokuzai Gakkaishi 43:574–579
9. Fujiwara Y, Inui K, Fujii Y, Sawada Y, Okumura S (1998) An approach to the three-dimensional evaluation of the surface rough-ness of wood: relationship between the distribution of peaks on the surface and tactile roughness (in Japanese). Mokuzai Gakkaishi 44:447–451
10. Fujiwara Y, Ishii A, Sawada Y, Fujii Y, Okumura S (1999) Novel filtering methods of evaluating surface roughness of wood. evalua-tion based on tactile roughness and 3D measurement of surface roughness. In: Proceedings of the 14th international wood machin-ing seminar, Paris. Epinal, Cluny, pp 571–580
11. Fujiwara Y, Fujii Y, Sawada Y, Okumura S (2001) Development of a parameter to reflect the roughness of a wood surface that corre-sponds to tactile roughness: a novel filter to exclude local valley effects. Holz Roh Werkstoff 59:351–355
12. Brinkmann S, Bodschwinna H, Lemke H-W (2000) Accessing roughness in three-dimensions using Gaussian regression filter. In: Proceedings of 8th international conference: metrology and prop-erties of engineering surfaces, Huddersfield