University of New Orleans University of New Orleans
ScholarWorks@UNO
ScholarWorks@UNO
University of New Orleans Theses and
Dissertations Dissertations and Theses
8-8-2007
Surface Optochemical Sensors
Surface Optochemical Sensors
Georgeta CrivatUniversity of New Orleans
Follow this and additional works at: https://scholarworks.uno.edu/td
Recommended Citation Recommended Citation
Crivat, Georgeta, "Surface Optochemical Sensors" (2007). University of New Orleans Theses and Dissertations. 582.
https://scholarworks.uno.edu/td/582
Surface Optochemical Sensors
A Dissertation
Submitted to the Graduate Faculty of the
University of New Orleans
in partial fulfillment of the
requirements for the degree of
Doctor of Philosophy
in
Chemistry
by
Georgeta Crivat
B.S. University of Bucharest, 1996
ACKNOWLEDGMENTS
I would like to express my appreciation to all those who gave me the opportunity to complete
this dissertation.
First and foremost, I am deeply grateful to my supervisor Prof. Zeev Rosenzweig. He has been
exceptionally supportive. As my advisor he constantly challenged me not to settle. He taught me
to strive for excellence. His suggestions stimulated and encouraged me. After Hurricane Katrina
our whole group was displaced. Zeev and Nitsa Rosenzweig opened not only their home but their
hearts to our entire group. To have had the experience working with him has truly been a gift
that I know could never be repaid.
I would also like to thank Prof. Matthew Tarr, Prof. Richard B. Cole, Prof. Branko S. Jursic,
Prof. Guijun Wang, Prof. Kazuya Kikuchi, Dr. Nitsa Rosenzweig, Dr. Laurie Locascio, Dr.
Michael Gaitan and Dr. Darwin Reyes for their suggestions and fruitful discussions on my
courses and research projects.
I would like to acknowledge my close friends and colleagues: Gabriela Blagoi, Liliana and Mihai
Viciu, Doinita Neiner, Speranta Stoian, Simona and Marius Tanasescu, Harry Rees, Paul E.
Golder, Louise Golder, Darshita Shah, Brian Hutchison, Silvia Lacerda, Vania de Paoli, Lifang
Shi , Ashley Quach, Arriel Wicks, Bryant Johnson for their love, friendship, and support.
I would like to express my sincere gratitude to Laurie Locascio, Michael Gaitan, Steven
Choquette and Darwin Reyes of NIST for their kindness and consideration after Hurricane
Katrina.
TABLE OF CONTENTS
List of Figures……….viii
List of Tables………...xiii
Abstract………xiv
Chapter 1: Background of Surface Optochemical Sensors for Pancreatic activity………1
1.1 Surface Optical Chemical Sensors for Detecting Zinc Ion Release Events from Pancreatic Beta Cells………..5
1.2 Surface Optical Chemical Nano-Sensor for Detecting Pancreatic Enzymatic Activity ……….6
1.3. Fluorescence and Fluorescent Molecules……….8
1.4. Jablonski Diagram………9
1.5. Fluorescence Efficiency and Lifetime………11
1.6. Mechanism of Sensing of Optochemical Sensors………..12
1.6.1. Photoinduced Electron Transfer………...12
1.6.2. Fluorescence Resonance Energy Transfer………16
References………..19
Chapter 2: Experimental………..21
2.1. Spectrofluorometry Measurements……….21
2.1.1. Light Source………...21
2.1.2. Monochromator………..22
2.2. Digital Fluorescence Imaging Microscopy System………23
2.2.1. Microscope objective……….24
2.2.2. Filter Cube……….25
2.2.3. Dicroic Mirror………26
2.2.4. Excitation and Emission Filters……….27
2.2.5. Spectrograph………...28
2.2.6. Light Source ………...28
2.2.7. Phase Contrast Microscopy………29
2.2.8. Charge Coupled Device (CCD Camera)………30
2.3. Microplate Readers……….32
2.3.1. Double Monochromators………...32
2.3.2. Light Source………...33
2.3.3. Temperature Control (Chamber) Module………...33
2.4. Absorption Spectrometry………...34
2.5. Atomic force microscopy………...35
References………..38
Chapter 3: A Fluorescence –Based Zinc Ion Sensor For Zinc Ion Release From Pancreatic Cells ………...40
3.1. Introduction……….40
3.2.Specific Experimental and Technical Details………...43
3.2.1. Materials and Reagents………...43
3.2.2. Fluorescence Spectroscopy and Microscopy……….44
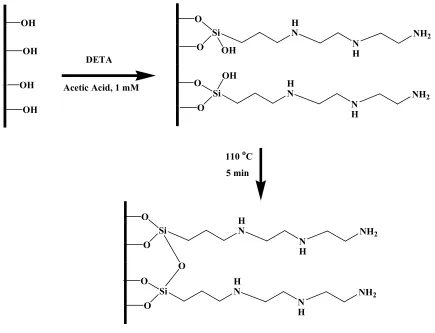
3.2.4 Synthesis of Zinc Sensing Glass Slides………...47
3.2.4.1. Silanization of Glass Slides……….47
3.2.4.1.1. Choice of Silanization Agent………...48
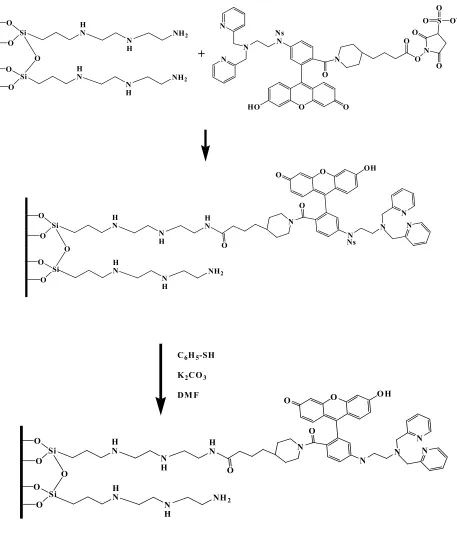
3.2.4.2. Conjugation of ZnAF-2 to Silanized Glass Coverslips………...52
3.2.5. Cell Culture and Maintenance………...55
3.3. Results and Discussion………...55
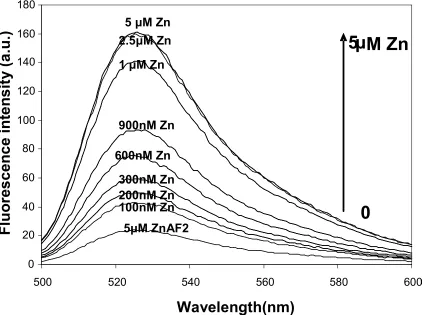
3.3.1. Zinc Ion Fluorescence Sensing Properties of Modified ZnAF-2……….55
3.3.2. Calibration Curve of ZnAF2 Modified Glass Coverslips………...57
3.3.3. Photo stability of Zinc Sensing Glass Coverslips……….59
3.3.4. Selectivity of Zinc Ion Sensing Glass Coverslips……….59
3.3.5. Reversibility of Zinc Ion Sensor………...61
3.3.6. Time Dependence Measurements……….63
3.3.7 Application of the Zinc Sensors for the Measurement of Zinc Release from Pancreatic Cells………...64
3.4 Summary and Conclusions………..68
References...70
Chapter 4: Targeted Fluorescence Detection of Zinc Ion Release from Beta Pancreatic Cells ……….72
4.1 Introduction……….72
4.2. Specific Experimental and Technical Details………75
4.2.1. Materials and Reagents……….75
4.2.2. Fluorescence Microscopy and Spectroscopy Measurements………76
4.2.3. Maintenance of Min-6 Cell Line in Culture………...77
4.2.4. Synthesis of the A2B5-ZnAF-2 Bioconjugate………..77
4.3. Results and Discussion………...80
4.3.3. Targeted Attachment of A2B5-ZnAF-2 Bioconjugate to Min-6 Cells………...83
4.3.4. Zinc Ion Release Measurements of A2B5-ZnAF-2 Bioconjugate Attached to Min-6 Cells………..86
4.4. Summary and Conclusions………..89
References………..91
Chapter 5: Fret –Based Surface Nano-Sensor In Microfluidic System For Detecting Pancreatic Enzymatic Activity………92
5.1 Introduction………...92
5.1.1. Polyelectrolite Multilayers and Electrostatic Self-Assembly (ESA)……….93
5.1.1.1 Choice of Polyelectrolyte polymers ………...96
5.1.2. Microfluidics and Micropatterning Techniques……….98
5.1.3. Quantum Dots ………...100
5.1.3.1. Biological Application of Quantum Dots………...101
5.1.3.2. FRET Based Quantum Dot Sensor………..102
5.1.4. FRET in PEMs……….104
5.2. Specific Experimental and Technical Details………...105
5.2.1. Materials and Reagents………...105
5.2.2. Digital Fluorescence Microscopy………...105
5.2.3. Fabrication Scheme of Microfluidic System………106
5.2.4. Fabrication of FRET Sensor in PEMs Using Layer-by-Layer Deposition in Microfluidic System………..108
5.2.4.1. Preparation of Water Soluble Quantum Dots………108
5.2.4.3. Synthesis of FRET Sensor for Enzymatic Activity………...112
5.2.5 Cell Culture and Maintenance……….113
5.3 Results and Discussion………..114
5.3.1. Fluorescence imaging and spectroscopy………114
5.3.2 Atomic force microscopy (AFM)………...116
5.3.3. Distribution of Quantum Dots and Their Emission Properties on Polyelectrolyte Multilayers………..118
5.3.4. FRET Distribution at Different Salt Concentration of PEMs……….120
5.3.5. Enzymatic Application of FRET Based Sensor………...123
5.4. Summary and Conclusions………..127
References………...130
Chapter 6: Discussion……….133
References………..138
LIST OF FIGURES
Chapter 1
Figure 1.1 Representation of Jablonsky diagram………..10
Figure 1.2 Diagram representing the mechanism of photo induced electron transfer (PET) …...13
Figure 1.3 Representation of complex formation of glass cover slips zinc film sensor in presence of zinc ions………15
Chapter 2
Figure 2.1 Representation of light path through an inverted epifluorescence microscope………27
Figure 2.2 Representation of a CCD pixel. The capacitor is formed by deposition of a silicon dioxide layer on top of polysilicon substrate. The electrode is deposited on top of a SiO2
layer………31
Figure 2.3 Representation of an atomic force microscope set-up………35.
Chapter 3
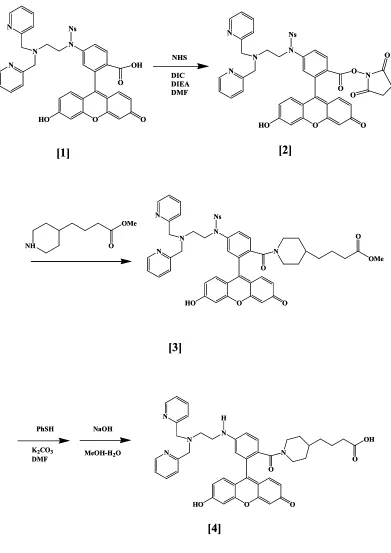
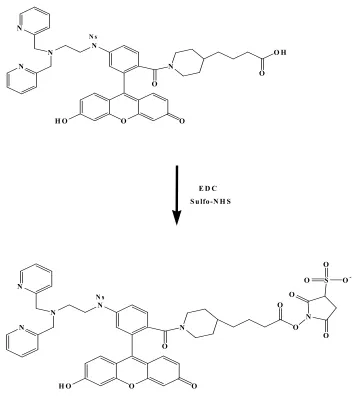
Figure 3.1 Representation of synthesis of carboxyl modified ZnAF2 ………...46
Figure 3.2 a APTES (Aminopropyl) triethoxysilane) and figure 3.2 b. DETA (3-Trimethoxysilylpropyl) diethylenetriamine) ……….48
Figure 3.3 Representation of silanization procedure……….51
Figure 3.4 Representation of the activation of the carboxyl-modified ZnAF-2 with EDC/sulfo NHS………...52
Figure 3.6 Emission spectra of 5uM carboxyl-modified ZnAF-2 at increasing zinc ion concentration between 0 to 5 µM………..56
Figure 3.7 Emission spectra of a zinc ion sensing glass slide in solutions of increasing zinc ion concentration (a) 0, (b) 5, (c) 20 and (d) 80 nM………57
Figure 3.8 Representation of the calibration curve of the response of the 1 µM Zn sensors to increasing concentrations of zinc1nM-80nM………58
Figure 3.9 Selectivity studies of 1µM zinc sensor versus 1 µM of Zn, Ca, Mg, Na, and Fe………60
Figure 3.10 Reversibility experiment shows exposure alternately to 1 µM of Zn, followed by 1mM TPEN treatment………62
Figure 3.11 Response time measurements of zinc ion sensing glass slides ………..63
Figure 3.12 Emission spectra of a zinc ion sensing glass slide prior to and following 20mM glucose-stimulated zinc release from Min-6 cells. The spectra were taken at 1 second time intervals………..65
Figure 3.13a)A 10X transmission image of Min-6 cells in suspension, b) A fluorescence image of a zinc ion sensing glass slide prior to stimulation with glucose, c) A fluorescence image of the same zinc ion sensing glass slide following the stimulation and zinc ion release from beta cells deposited on the glass slide………67
Chapter 4
Figure 4.2 Representation of calibration curve describing the fluorescence intensity of A2B5-ZnAF-2 versus zinc ion concentrations ranging from 0 to 5µM. The insert shows a linear response between 0 and 1µM zinc ion concentration………82
Figure 4.3Digital fluorescence image of confluent Min-6 cells labeled with the A2B5-ZnAF2 bioconjugate that are attached to the surface of a well……….83.
Figure 4.4 Phase contrast image (a) and fluorescence image (b) of MIN6 cells incubated with A2B5-FITC………84
Figure 4.5 c) Phase contrast image and d) fluorescence image of H9C2 cells incubated with A2B5-FITC; phase contrast (e) and fluorescence image (f) of Min 6 cells incubated with anti-GFAP-FITC………...85
Figure 4.6 Representation of the average intensity of fluorescence transients of 1.56±0.13 in cell experiments and control experiment when cells labeled with antibody sensor were treated with Krebs-Ringer buffer ………..86
Figure 4.7 A is the basal fluorescence image of MIN6 cells at confluence labeled with A2B5-ZnAF2 bioconjugate; B,C,D successive fluorescence images after 20mM glucose .39% increase in the overall fluorescence intensity was observed. The arrows are pointing to the most active zinc-insulin release areas………...88
Chapter 5
Figure 5.1 Schematic representation of layer-by-layer assembly (LbL)………...94
Figure 5.2 a) PAH (Poly (allylamine hydrochloride); b) PSS (Polystyrenesulfonate)………….97
Figure 5.3 Schematic representation of fabrication scheme of PEMs using layer-by-layer deposition in microfluidic system………107
Figure 5.5 Representation of incorporating FRET sensor in polyelectrolyte multilayers……..111
Figure 5.6 a) Fluorescence images of Rhodamine-PAH (red line) and quantum dots (green line); b) quantum dots with 1, 3, 5, 7 and 9 layers separation from Rhodamine-PAH (orange lines) in microfluidic
system………..115
Figure 5.7 Representation of fluorescence spectra from channels containing CdSe/ZnS quantum dots, Rhodamine and quantum dots and rhodamine separated by multiple layers of polyelectrolytes: 1, 3, 5, 7, and 9……….115
Figure 5.8 A) Atomic force microscopy (AFM) top view image of a 9 layers PEMs on a PDMA substrate. B) Cross-section (average) graph of the image in A………..117.
Figure 5.9 Photoluminiscence properties of thioglycolic acid stabilized CdSe quantum dots incorporating in polyelectrolytes ………120
Figure 5.10 Representation of FRET distribution between quantum dots and free diffusing rhodamine in PEMs when salt concentration is () 0.1 M () 0.2 M and () 0.5M. The data shows a tendency to less defined rate of energy transfer with the distance at increasing the salt concentration………121
Figure 5.11 Representation of FRET distribution at 0.5M salt concentration of PEMs () with and () without fixed rhodamine. The more defined energy transfer is showed at bound rhodamine………123
Figure 5.12 Emission spectra of the quantum dot FRET-based sensor at 0.25mg/mL trypsin………..124
Figure 5.14 Fluorescence images of rhodamine labeled neurotensin-PAH sensor in microfluidic system before and after adding trypsin………126
LIST OF TABLES
ABSTRACT
The objective of my research is to develop new surface optochemical sensors for studying
cellular processes by investigating techniques to modify surface properties. The spectral
characteristics of the modified surfaces and coatings are designed to show remarkable changes
after interaction with analytes from biological fluids and cells.
My studies focused on pancreatic cells and addressed the need for improved techniques to
measure zinc release from pancreatic cells (chapter 3, 4) and to measure the metastasis potential
of cancerous pancreatic cells (chapter 5).
Chapter 3 describes the development of zinc sensing glass slides by conjugating a
carboxyl-modified ZnAF-2 to an amino functionalized glass surface. The sensor was used for the
measurement of glucose-stimulated zinc ion release from cultured beta pancreatic cells with
impact in diabetes research. In chapter 4 is described conjugation of the carboxyl-modified
ZnAF-2 to antibody molecules (A2B5) that specifically recognize pancreatic cells. This enabled
for the first time the use of targeted zinc sensors to monitor zinc release events from pancreatic
cells.
Chapter 5 describes development for the first time of a fluorescence sensor to measure the
proteolysis activity of pancreatic cancer cells in microfluidic systems. The sensor was fabricated
using a Layer by layer (LbL) deposition of polyelectrolyte. The sensor was based on
Fluorescence Resonance Energy Transfer (FRET) between luminescent quantum dots (serve as
donors) and rhodamine molecules (serve as acceptors) that are separated by multi-layers of
polyelectrolytes. The microfluidic platform enables precise delivery of reactants to assemble the
CHAPTER 1
BACKGROUND OF SURFACE OPTOCHEMICAL SENSORS
FOR PANCREATIC ACTIVITY
An optochemical fluorescence surface sensor employs a recognition component which expresses
changes in spectral characteristics upon interaction with a specific analyte. The chemical or
physical reaction between analyte and sensor molecule takes place at the solid interface. Changes
in absorption, emission quantum yield or shift in the wavelength in the emission spectra are
generally used to determine the concentration of specific substances by using spectroscopic
methods. Fluorophores which specifically bind corresponding analytes are defined as probes for
analyte recognition [1].
As a biosensor, the film is provided with an active biological sensing element inserted in the
transduction process. A transducer converts the interaction analyte-sensor in a continuous
electrical or optical signal corresponding to the analyte concentration. The sensitivity and
selectivity of a biosensor is highly dependent on the affinity of sensor-analyte interaction and
transducer performance [2, 3].
Generally, the interaction of fluorescent substances with analytes from biological specimens
provides one with information about their particular location on proteins, membranes or
conformational changes (e.g., protein folding involving FRET) and their physiological status
There are inherent problems associated with using freely diffusing dyes, such as overloading
with fluorescent probes, interference reactions with other analytes from environment,
permeability through membranes and lack of site specific information. Covalent immobilization
of the sensing molecule to a substrate prevents the dye from leaking in the medium or
permeating through membranes.
When a cell is bearing of receptors, surface antigens with specificity for a given antibody or
hormone, then incorporating target molecules with specificity for a given substrate, immobilizes
the sensor onto the material of interest, and provides with site specific information.
When using freely diffusing probes in intra or extra cellular analysis, cytotoxicity and chemical
and photo stability are issues to take into account.
Previously, fluorescent probes were immobilized on particles used as intracellular sensors. These
probes were encapsulated by biologically localized embedding (pebbles), liposomes, and
lipobeads [4-9]. Toxicity issues were overcome by incorporating the sensor in a hydrophilic
polymer matrix or phospholipid layer (liposoms). The sub- micrometer sensors have millisecond
response time. However, the leakage rate of fluorophores from liposome affects the accuracy of
measurements. Lipobeads, particle based sub-micromiter sensors, coated with a phospholipid
membrane, were further developed to enhance the stability of the sensor. They were used to
detect intracellular pH and oxygen in physiological conditions [9].
In the development of a surface sensor, the immobilization of the fluorophore to a physical
support is a key step in the design of the sensor.
There are several approaches to incorporate the fluorophore in a film using mechanical,
molecules on a surface include the elimination of fluorophore leakage into the surrounding
solution and enhanced stability and lifetime of the sensors [10].
We investigated two techniques to present the sensor: covalent immobilization of the sensor on
modified glass surfaces and electrostatic immobilization of the sensor by processing multilayer
thin films.
The covalent immobilizations methods are preceded by a chemical modification step of the glass
slide surface such to provide it with nucleophilic functional groups to enable further conjugation
with fluorophores.
The development of ultra thin organic films, using electrostatic attraction between polymers as a
driving force, is a versatile technology which enables the control of the structure and properties
of the films within nanometer scale [11, 12].
It is also described in literature fabrication of ultra thin film optical chemical sensors for pH,
metal ions (Fe, Hg); 2, 4-dinitro toluene, organic nitro compounds, i.e. using electrostatic
Layer-by-Layer assembly [13].
The goal of these studies was to develop film/coating sensors for detecting pancreatic activity.
The pancreas is a gland organ with digestive and endocrine functions. The endocrine pancreas is
represented by millions of clusters of cells organized in islets of Langerhans. The most important
types of cells localized in these islets are beta cells which secrete insulin, alfa cells which secrete
glucagon and delta cells which secrete somatostatin. Unfortunately, it is relatively difficult to
discriminate between them using typical staining techniques. [39, 40] Therefore, there is a need
specialized secretory functions with relevance in their pathology, methods that allows for cell
identification using cell-secreted products as the analyte are an obvious choice.
The exocrine pancreas is responsible for the secretion of bicarbonate ions (centroacinar cells)
and digestive enzymes (basophilic cells). The most important diseases which affect the pancreas
are diabetes mellitus and pancreatic cancer. Diabetes mellitus is a metabolic disorder which is
characterized by the inability of the beta cells to secrete adequate amounts of insulin to preclude
hyperglycemia. The disease results in severe complications (e.g., acidosis and non ketoacidosis
coma, renal failure, blindness, retinal damage). Reports suggest that zinc is associated with the
function of beta cells including insulin synthesis, storage and release [14]. Insulin is co-stored as
a hexamer complex with two zinc ions within the secretory vesicles of beta pancreatic cells.
When pancreatic cells are stimulated by elevated glucose concentration, insulin is co-released
with zinc by exocytosis. Dissociation of the insulin-zinc complex occurs in conditions of
exposure to extra cellular pH [14, 15]. The dissociation results in the formation of insulin
monomers, which are the biologically active form of insulin, and free zinc ions. The role of zinc
ions in insulin secretion and in the pathology of diabetes is not entirely understood. However, it
is thought that zinc deficiency might affect the capacity of islets to synthesize and release insulin
[14]. Complications of diabetes could also originate from the high level of intracellular oxidants
associated with decrease in the zinc dependent antioxidant enzymes (e.g., superoxide dismutase
1.1 Surface Optical Chemical Sensors for Detecting Zinc Ion Release Events from Pancreatic Beta Cells
A variety of analytical techniques are used to detect and quantify zinc in aqueous samples.
Inductively coupled plasma atomic emission spectroscopy [21, 22] and atomic absorption
spectrophotometry [23] are used extensively to detect zinc at trace levels. Due to the trace level
of zinc ions in biological samples a pre-concentration step was required to realize sufficient
sensitivity [21]. X- ray fluorescence spectroscopy has been used successfully to detect zinc ions
in tissues without a pre-concentration step [24]. Another detection technique, based on using
radioisotopes of Zn, is limited by the significant hazardous potential, isotope availability and
cost. None of these techniques could be used for real time zinc ion detection in cellular systems.
Miniaturized fluorescence sensors that were developed in the last two decades provided a new
analytical tool for the detection of intra- and extra -cellular ion levels.
Among the zinc ion fluorescent indicators that were used for the analysis of zinc ion in beta cells
include ultraviolet excitable quinoline-based dyes like
6-methoxy-8-quinolyl-para-toluenesulfonamide (TSQ) [16], zinquin [17] and visible light excitable fluorophores like
Fluozin-3 [18]. The basic limitation of these dyes is their narrow zinc ion selectivity, especially
in the presence of calcium. Additionally, the diffusion and partitioning of the dye through the
cellular membrane affects the accuracy of extra cellular measurements of zinc.
Recently, a new zinc sensitive fluorophore {6-[N- [N’, N’-bis (2-pyridinylmethyl)-2-aminoethyl]
amino-3’, 6’-dihydroxy-spiro [isobenzofuran-1(3H), 9’-[9H] xanthene]-3-one} (ZnAF-2) was
synthesized [19]. This dye is structurally and spectroscopically similar to fluorescein and has a
other zinc ion sensitive dyes still remained a problem. The purpose of the modification of
ZnAF-2 with a piperidine carboxylic acid aliphatic chain was to allow conjugation chemistry to various
substrates and prevent the permeability issues.
We designed fflluuoorreesscceenncce based glass slide film sensors for studying zinc release events from e
pancreatic cells (Chapter 3). The direct application of the sensor is on studies of pathogenesis
and pharmacology of diabetes mellitus.
For the targeted measurement of zinc ion release from pancreatic β cells, a coating of beta cells
with an antibody sensor was developed (Chapter 4). The sensor was developed by conjugation of
antibody A2B5, for targeting of the biological system, with ZnAF2 for zinc release
measurements.
1.2 Surface Optical Chemical Nano-Sensor for Detecting Pancreatic Enzymatic Activity
Pancreatic adenocarcinoma is a malignant tumor with a poor prognosis. It is the fifth leading
cause of death in United States [20]. This prognosis originates from the high potential of
invasiveness and malignancy of pancreatic cancer into neighboring blood vessels. The tumor cell
invasion is described as a protease-driven digestion of extra-cellular matrix and basement
membrane. In addition to a tumor associated trypsinogen, the cancer cells have also the ability to
synthesize a trypsinogen activity stimulating factor (TASF) [20].
Detection of enzymatic activity, in conjunction with detection of CA19-9, lipase, iron and
albumin in the serum proved to be sensitive markers in the diagnosis and study of pancreatic
zymography (electrophoretic technique for measuring proteolytic activity) and western-blott
analysis which use gel electrophoresis to discriminate native proteins based on size and net
charge and denatured proteins based on size [26, 27]. However, these techniques are invasive
and destructive as they necessitate obtaining of samples from tissue homogenates or extracts.
Fluorescence detection of enzymatic activity by encapsulation of enzymes within liposome based
nano-biosensors was reported to improve enzyme stability against denaturation, unfolding and
environmental effects [28].
Among the fluorescence detection methods used to probe enzymatic activity, fluorescence
resonance energy transfer (FRET) is used due togenerally provide with improved spatial
resolution and sensitivity. FRET based sensors are less sensitive to environmental changes and
illumination factors - as a result it is a step forward in analytical performance as compared to
intensity based fluorescence sensors. There is a large interest in employing FRET in the design
of biological assays. As donors, luminescent quantum dots appear to be a practical alternative to
organic fluorophores due to their higher photo and chemical stability, high emission quantum
yield, wide excitation range (which enables choosing an excitation wavelength such that to avoid
direct excitation of the acceptor) and wavelength tunability [29-31]. Quantum dots conjugated to
peptides labeled with molecular acceptors were also used as donor probes in the design of
sensors for enzymatic activity [29, 32, and 33].
However Cd-containing quantum dots have a limited applicability in the analysis of cells and
Therefore, to improve the biocompatibility of quantum dots and lessen toxicity issues, we
incorporated quantum dots as donor probes and rhodamine labeled peptides as acceptors in
polyelectrolyte multilayers, using layer-by-layer deposition techniques.
Furthermore, we designed a surface sensor for monitoring the proteolytic activity of pancreatic
exocrine cells with direct application in studies of tumor invasion and metastasis of malignant
tumors.
1.3. Fluorescence and Fluorescent Molecules
Fluorescence is defined as a type of luminescence and involves the absorption of light by a given
molecule, propelling it to a singlet excited state, where from the molecule returns to ground state
by emission of light. In the excited singlet state the electron is paired to the second electron in
ground electronic state. As compared to fluorescence, phosphorescence, which is another type of
luminescence, requires emission of a photon from triplet excited state. The electron has the same
spin orientation with the one corresponding to the ground state. The outcome of this is that the
transition to ground state is not spin-allowed and the emission lifetime is longer (103-100 s-1) as
compared to the emission lifetime in fluorescence (10 ns) [34].
Fluorescent molecules are generally aromatic molecules (example: quinine, fluorescein,
rhodamine B, acridin Orange, and i.e.) with planar, rigid structures. Aliphatic molecules with
extended π electron systems can also be fluorescent. The electronic transition is a transition of π
to π* low-lying singlet excited state. Potentially fluorescent molecules are also those which
contain a lone pairs of electrons which can be promoted in electronic transitions, like nitrogen
Fluorophores can be classified as intensity-based probes and wavelength ratiometric probes.
In intensity based measurements, fluorophores show only changes in intensity in the emission
spectra but no spectral shift due to a difference in the quantum yield between free and
complexes.
Wavelength ratiometric probes show spectral shifts in the absorption and emission spectra upon
interaction with an analyte.
Sensitivity of fluorescence based methods is higher than absorption methods since a single
fluorescent molecule could generate thousands of photons.
Typically fluorophores are also characterized by a high rate of photobleaching. This process
results in destruction of fluorophores by irradiation and loss of fluorescence.
There are a few characteristics which differentiate fluorescence from scattering (Raman,
Rayleigh): emission occurs at longer wavelengths than excitation, two clearly separated peaks
for excitation and emission are observed, quantum yield is independent of the excitation
wavelength.
1.4. Jablonski Diagram
A Jablonski diagram is the representation of the physical processes which occurs during
excitation of a molecule and its emission (Figure 1.1).S0 represents ground singlet electronic state
while S1 and S2 represent first and second excited singlet electronic states. 0, 1, 2 represent the
vibrational energy levels of each of these electronic states.
The surplus of energy from S2 is subsequently lost through nonradiative vibrational relaxation
which brings it to a zero vibrational level of S2. It is possible then that the molecule relaxes to the
lowest vibrational level of S1 through a nonradiative internal conversion which occurs in 10-12 s
or less [34, 35]. Internal conversion is complete before the fluorescence emission which occurs
in 10-8 s.
Figure 1.1 Representation of a Jablonsky diagram.
Fluorescence emission returns the molecule to any vibrational ground state level. As a result the
emission spectrum is a mirror image of the absorption spectrum (S0 →S1). Because the spacing of
vibrational levels in the excited state resembles the ground state, the vibrational structures are
similar in the absorption and emission spectra [1].
Typically, the fluorescence spectrum appears at longer wavelengths due to the energy lost during
vibrational relaxation (Stokes shift).
In special cases, through a non-radiative intersystem crossing, the molecules could undergo a
spin conversion from singlet S1to triplet state T1.
The emission of light from triplet state is called phosphorescence and is represented at longer
wavelength in the emission spectrum. Heavy atoms like iodine and bromine perturb the electron
spins and enhance state mixing which enhance the phosphorescence [34, 35].
The non-radiative deactivations represented in Figure 1.1.
are internal conversion, intersystem crossing and vibrational relaxation. The internal conversion
is a transition between the same spin states while intersystem crossing involves different spin
states. Vibrational relaxation is a fast process and result from collisions between molecules and
their quenchers.
1.5. Fluorescence Efficiency and Lifetime
Quantum yield (Φf) and fluorescence lifetime are the most important characteristics of
fluorescence. Quantum yield is defined as the ratio between the number of emitted photons and
number of absorbed photons [35].Considering the rate constants of some of the radiative and
Φ
f=k
f/ (k
f+k
ic+ k
is + kq) (1.1)
Where the subscripts f corresponds to fluorescence, ic stands for internal conversion, is for
intersystem crossing, kq is for quenching [35]. The brightest molecules approach unit in their
quantum yield.
The fluorescence lifetime (τ) is defined as the first order decay process of a fluorescent molecule
which excited by a photon, relaxes from excited state through different radiative and
nonradiative processes.
1.6. Mechanism of Sensing of Optochemical Sensors
Fluorescence based sensors show changes in fluorescence quantum yield, wavelength, anisotropy
and lifetime upon interaction with specific analytes. The advantages of using intensity based
sensors include that they are sensitive, versatile, and only require simple instrumentation.
1.6.1. Photoinduced Electron Transfer
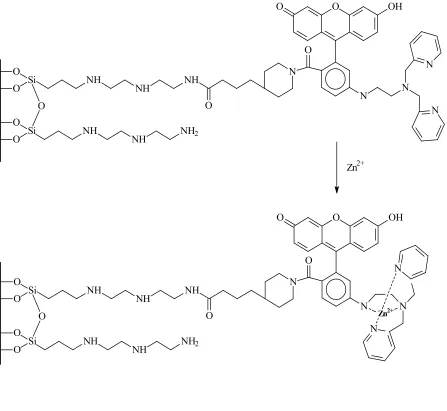
ZnAF2, a fluorescent sensor molecule for Zn2+ used in the design of glass cover slip zinc film
sensors and antibody zinc sensors, was synthesized from corresponding 6-aminofluorescein
[19].The excitation wavelength of this compound is in the visible range, a characteristic which
photoinduced electron transfer phenomenon (PET). Photoinduced electron transfer is a transfer
of a lone pair of electrons of a neighboring amine in presence of the light, into the aromatic ring
[1].
Photoinduced electron transfer was largely used to design sensors for metal ions [1, 36,
37].Typically in the absence of zinc ions the dye forms an exciplex complex with amine groups.
In the presence of metal ions the exciplex is no longer formed and aminofluorescein becomes
fluorescent.
Aminofluorescein itself has low quantum yield fluorescence due to a high HOMO (highest
occupied molecular orbital) level of the electron donating group [19]. In the presence of light at a
suitable wavelength (Figure 1.2.), fluorescein molecules propel an electron from the HOMO
orbital to the LUMO orbital (lowest unoccupied molecular orbital).
Figure 1.2 Diagram representing the mechanism of photo induced electron transfer
LUMO
HOMO
N:
hν
ν
ν
ν
LUMO HOMO PET LUMO HOMO
Zn
2+ LUMO HOMO LUMO HOMON:
hν
ν
ν
ν
LUMO HOMO PET LUMO HOMO LUMO HOMO
N:
hν
ν
ν
ν
One of the lone pair of electrons of neighboring nitrogen, from the zinc binding site, will occupy
HOMO orbital of the excited molecule. The outcome of this configuration consists in blocking
the fluorescence pathway (PET). When the electron donation is constrained by a complex
formation with zinc ion (Figure 1.3) and involving the lone pair of electrons of nitrogen (which
Figure 1.3 Representation of complex formation of glass cover slips zinc film sensor in presence of zinc ions
O
O Si NH NH NH
O
N O
N N
O
O Si O
NH
NH NH2
N
N
O OH
O
Zn2+
N O
O Si NH NH NH
O
N
N
O
O Si O
NH
NH NH2
N N
Zn2+
O
O OH
1.6.2. Fluorescence Resonance Energy Transfer
Fluorescence resonance energy transfer (FRET) is a non-radiative transfer of excited-state
energy from a donor (D) to an acceptor (A). Energy transfer occurs when the emission spectrum
of a donor molecule overlaps with the absorption spectrum of an acceptor. Förster resonance
energy transfer involves a dipole-dipole coupling mechanism followed by a non-radiative
transfer of excitation energy to the acceptor. The resonance term is to define a transfer which
does not involve photons.
The rate of energy transfer (kT) is a measure of the relative orientation of donor and acceptor
dipoles in the interaction space, distance between them and the degree of spectral overlap of
donor emission spectrum and acceptor absorption spectrum(relation 1.3) [38]. τD represents the
decay time of donor in absence of acceptor, R0 is the Förster distance and r represents the actual
donor-acceptor distance.
The distance at which the energy transfer is 50% efficient is known as Förster distance and
covers a range between 2 and 7nm.
k
T=1/τ
D( R
0/r)
6
(1.3)
If R0 = r, the transfer efficiency is then equal to 50%. The typical application of FRET is in
measuring the separation distance between two sites of a molecule. Förster distances ranging
from 2 to 9nm are particularly useful in measuring distances of large biological molecules (ex.
The efficiency of resonance energy transfer was shown by Förster to be dependent on the r6
power distance between donor and acceptor [38]:
E= R
0 6/( R
0 6+r
6) (1.4)
The transfer efficiency approaches unity when the distance between donor and acceptor falls
below the Förster distance. For a system where donors and acceptors are randomly distributed in
solution, the R0 is expressed as follows:
R
0= [3000/2
π
3/2NA
0]
1/3
(1.5)
N represents Avogadro number and A0 is the concentration of acceptor with a 76% energy
transfer [38].
The transfer efficiency is typically calculated (rel.1.6) using the relative fluorescence intensity of
donor (FD) without acceptor and in presence of acceptor (FDA) [38].
E= 1- F
DA/ F
D(1.6)
The orientation factor k2 is a function of the donor and acceptor transition dipole moments and
accounts the angles between dipoles and the vector joining them. The relative orientation of
donor and acceptor ranges from 0, when the dipoles are oriented perpendicular to each other, to 4
FRET in PEMs (polyelectrolyte multilayers) was employed to investigate the distribution of
donor and acceptors within the matrix and evaluate their average separation (Chapter 5). The
distance –dependentfluorescence resonance energy transfer was exploited in the design of the
FRET based surface sensor for enzymatic activity. The sensor was developed by incorporating
quantum dots as donors and rhodamine labeled neurotensin as acceptors in polyelectrolyte
multilayers using layer-by-layer deposition techniques. The changes in FRET signals between
quantum dots and immobilized rhodamine on neurotensin, were indicative of the enzymatic
References
1. Joseph R. Lakowicz, Principles of Fluorescence Spectroscopy, Chapter 19: Fluorescence Sensing, pg 531-572, Kluwer Academic /Plenum Publishers, 1999
2. Cooper, M.A.; Nat. Rev. Drug. Discov. 2002, 1(7), 515-528
3. Gabriela Blagoi, Fluorescence Resonance Energy Transfer (FRET) Based sensors for Bioanalysis, Dissertation: Chapter 1, 2004
4. Clark, H. A.; Hoyer, M.; Philbert, M. A.; Kopelman, R. Anal. Chem. 1999, 71 (21), 4831-4836.
5. Nguyen, T.; Rosenszweig, Z. Anal. Bioanal. Chem. 2002, 374, 69-74
6. McNamara, K. P.; Rosenzweig, N.; Rosenzweig, Z. Mikrochim. Acta 1999, 131, 57-64. 7. Ji, J.; Rosenzweig, N.; Griffin, C.; Rosenzweig, Z. Anal. Chem. 2000, 72(15), 3497-3503. 8. Ji, J.; Rosenzweig, N.; Jones, I.; Rosenzweig, Z. Anal. Chem. 2001, 73 (15), 3521-3527. 9. Ma, A.; Rosenzweig, Z. Anal. Chem.; 2004; 76(3); 569-575.
10. Tan, S.-Z.; Niu, C.-G.; Jiang, J.-H.; Shen, G.-L.; Yu, R.-Q. Analytical Sciences2005, 21, 967-971
11. Yoo,D.; Shiratori, S.S.; Rubner, M.F. Macromolecules 1998, 31, 4309-4318 12. Decher, G. Science1997, 277, 1232
13. Lee, S.-H., Multilayer thin films employing electrostatic layer-by-layer self-assembly for optical device applications , Thesis , Source DAI-B 61/09, p. 4751, Mar 2001
14. Chausmer, A.B.; Journal of the American College of Nutrition1998, 17, 109-115 15. Kennedy, R.; Huang, L.; Aspinwall, C. J Am Chem Soc 1996, 118, 1795-1796
16. Jindal, R.M.; Taylo, R.P.; Gray, D.W.; Esmeraldo, R.; Morris, P.J . Diabetes 1992,41, 1056-1062
17. Qian, W.J.; Aspinwall, C.A.; Battiste, M.A.; Kennedy ,R.T. Anal Chem2000 ,72, 711-717 18. Qian, W.J.; Gee, K.R.; Kennedy, R.T. Anal Chem2003, 75, 3468-3475.
19. Hirano, T.; Kikuchi, K.; Urano, Y.; Higuchi, T.; Nagano, T. J Am Chem Soc 2000 , 122, 12399-12400
20. Uchima, Y.; Sawada, T.; Nishihara, T.; Umekawa, T.; Ohira, M.; Ishikawa, T.; Nishino, H.; Hirakawa, K. International Journal of Molecular Medicine2003, 12, 871-878
21. Zhefeng, F.; Liming, D.; Xiaotao, J.CJI 2001, 3 (11)
22. Wilharlitz, P.; Dreew, S.; Krismer, R. et al. Mikrochim Acta. 1997, 125: 45 23. el-Yazigi, A.; Al-Saleh, I.; Al-Mefty, O. Clin.Chem.1986, 32(12): 2187-90
24. Twining, B.S.; Baines, S.B.; Fisher, N.S.; Maser, J.; Vogt, S.; Jacobsen, C.; Tovar-Sanchez, A.; Sanudo-Wilhelmy, S.A. Anal Chem. 2003, 75(15):3806-16
25. Nakae, Y.; Naruse, S.; Shibata, T.; Kitagawa, M.; Kondo, T.; Hayakawa, T.; Kuno, N.; Kurimoto, K. Rinsho byori 1994, 42(2):139-42.
26. Terada, T.; Morita, T.; Hoso, M.; Nakanuma, Y. J. Clin Pathol. 1994, 47(10), 924-927
27. Terada, T.; Yukisato,K.; Keigo,A.; Yoshiko,M.; Masako, K.; Kenichi, H.; Teiichi, M.;
Tetsuo, O.; Yasuni, N. Virchows Arch1997, 431,195–203
28. Vamvakaki, V.; Fournier, D.; Chaniotakis, N. A. Biosensors & bioelectronics 2005, 21, 384-388
31.Tran, P. T.; Goldman, E. R.; Anderson, G. P.; Mauro, J. M.; Mattoussi, H. Phys. Status Solidi B 2002, 229, 427-432.
32. Medintz, I. L.; Clapp, A. R.;. Brunel, F. M.; Tiefenbrunn, T.; Uyeda, H. T.;Chang, E. L.; Deschamps, J. R.; Dawson, P. E.; Mattoussi, H. Nat. Mater.2006, 5 (7), 581-589.
33. Clapp, A. R.; Medintz, I. L.; Mattoussi, H. Chem Phys Chem 2006, 7 (1), 47-57
34. Joseph R. Lakowicz, Principles of Fluorescence Spectroscopy, Chapter 1: Introduction to Fluorescence, pg 1-23, Kluwer Academic /Plenum Publishers, 1999
35. Howard A. Strobel; William R. Heineman, Chemical Instrumentation: A Systematic approach: Chapter15.2 Luminescence Spectra: Energy, Intensity, and Lifetime pg.517-522, John Wiley & Sons, 1989
36. Czarnik, A.W. Principle of fluorescent probe design for ion recognition, in Topics in Fluorescence Spectroscopy, Vlume 4: Probe Design and Chemical Sensing, J.R. Lakowicz, Plenum Press, New York, pp. 49-70, 1994
37. Fabrizzi, L.; Poggi, A. Chem.Soc. Rev. 1995, 24, 197-202
38. Joseph R. Lakowicz, Principles of Fluorescence Spectroscopy, Chapter 13: Energy Transfer, pg 367-395, Kluwer Academic /Plenum Publishers, 1999
39. Kerem, E.; Schwartz-Arad, D.; Bartfeld, E.; Ron, N.; Ariel I.; Zajicek, G. Histochemistry and
Cell Biology 1989, 91(1), 47-50
40. Callea, F.; Desmet, V. L. The Histochemical Journal 1982, 14(4), 545-552
CHAPTER 2
EXPERIMENTAL
This chapter describes the methods and chemical instrumentation used in performing the
experiments. Specific details about the experimental set-up are provided in chapters 3, 4, and 5.
Instrumental Methods
2.1. Spectrofluorometry Measurements
A spectrofluorometer requires a wavelength isolation module in both excitation and emission,
and light collecting optics which couple the wavelength isolation modules with sources of light.
For a given substance, the absorption and emission spectrum is depicted versus wavelength. The
fluorescence spectrum appears at longer wavelength than the excitation due to the energy lost in
the singlet excited state through vibration relaxations. The excitation and emission measurements
in this dissertation were performed using a Photon Technology International Spectrofluorometer
(QM-1 model). This instrument is equipped with a xenon lamp as light source, two
monochromators for wavelength isolation and a photomultiplier tube detector.
2.1.1. Light Source
spectrofluoremeter. The output light ranges from 250-750nm. A fused quartz envelope encloses
two tungsten electrodes and xenon gas under high pressure. Light is generated when a high
voltage pulse is applied through electrodes and xenon ions are formed. During operation, xenon
arc lamps generate ultraviolet radiation that ionizes the surrounding oxygen and causes ozone to
form. Heat and ozone generated during operation of the lamp are removed by directing cooled air
through the lamp.
2.1.2. Monochromator
A monochromator is an optical system which narrows the spectral band of the incident light. A
monochromator contains an entrance slit, a lens which collimates the light, a dispersing device, a
lens which focuses the dispersed light and an exit slit. The entrance slit, a rectangular aperture,
along with the exit slit is adjustable, playing a role in the performance of the monochromator.
Collimated light is dispersed by either a grating or prism. The components of the incident beam
are refracted in different angles by prisms. In comparison, gratings provide better resolution and
dispersion of incident radiation. The PTI fluoremeter is equipped with two monochromators, one
for excitation mode and one for emission mode.
2.1.3. Photomultiplier tube
Photomultiplier tubes are detectors which convert the intensity of light proportionally into
current. Sealed in an envelope under vacuum are a photocathode, sets of dynodes as amplifiers
ejection of a photoelectron. The photocathode typically operates at high negative potentials
between -1000-2000V. Also, the array of dynodes is kept at negative potentials, which approach
zero toward the end of dynode chain. The difference in potential between the photocathode and
the dynode causes the photoelectron to be attracted and accelerated toward the first dynode.
Additional electrons are produced, a process that continues to propagate down the chain of
dynodes, resulting in a current pulse arriving at the anode. Amplification of the signal is directly
related to the voltage and number of dynodes.
2.2. Digital Fluorescence Imaging Microscopy System
Fluorescence microscopy, which exploits the properties of fluorescence emission of single
molecules upon specific excitation, gives information about their spatial distribution with direct
application in biological experiments. Spectroscopic properties of fluorescent molecules change
with changes in the parameters of the medium used during imaging: pH, viscosity, refractive
index, ionic concentrations, etc.
Fluorescence measurements of fluorescent indicators were performed on an epifluorescent
microscope Olympus IX-70.
Fluorescence microscopes are typically equipped with a mercury orxenon lamp (or laser system)
as a light source. The output of the lamp passes through collecting optics to a filter cube that
contains a set of excitation and emission filters and a dichroic mirror. The fluorescence produced
after excitation of the sample is collected by the objective and directed through different paths to
the detector and eyepiece. The filter cube, for ZnAF2 imaging and spectral data, contained a
emission filter. The filter cube for FRET measurements contained 425±40nm excitation filter, a
460nm dichroic mirror and 475nm long pass emission filters. The images are obtained using a
CCD camera (Rupert Scientific, Model 256HB) for recording spectral fluorescence data [1].
This camera is coupled to a 150-mm three-mirror spectrograph (Acton Research Inc.) An
exposure time of 0.1 s was used to acquire the fluorescence spectra and images. The Roper
Scientific software WinSpec/32 was used for image analysis. Adobe PhotoShop v3.0 and Image
J software were used to process the images.
2.2.1. Microscope objective
Microscope objectives are designed to focus excitation light on a sample and to collect emission
light from the sample. When excitation and emission light travel through the same objective it is
called epifluorescence microscopy. As compared to transmitted fluorescence, epifluorescence
more efficiently separates excitation and emission light. The spatial resolution of a microscope
[1] is defined as the minimum separation distance between two distinguishable points in a field.
R=1.22λ/2(NA) (1)
NA= n sinα (2)
R stands for the separation distance, NA is the numerical aperture of the objective; n in relation
of incident light. Using immersion oil instead of air as medium, improves the resolution by a
factor of 1.5.
F = 10
4• (NA
2/M)
2(3)
The light-gathering power of the objective (F) (3), which affects the brightness of the image, is a
function of numerical aperture and the square of the magnification of the image.
In fluorescence imaging, as the magnification increases and numerical aperture increases, the
spatial resolution increases, but there is a risk of photobleaching the sample.
The fluorescence images and spectra were recorded using a 20× microscope objective with NA =
0.5 and a 40× microscope objective with NA = 0.9. NA values for oil immersion objectives
range from 0.1 for low magnification objectives to 1.6 for high magnification objectives.
Typically, objectives are composed of three groups of doublets of lenses, a lens triplet group, and
three individual internal single-element lenses. A front lens and a meniscus second lens are
designed to capture the incident light at high numerical aperture minimizing the spherical
aberration.
2.2.2. Filter cube
A dichroic mirror is mounted along with the excitation and emission filter on an optical device
called a filter cube. The block mounting provides flexibility to change the filters and dichroic
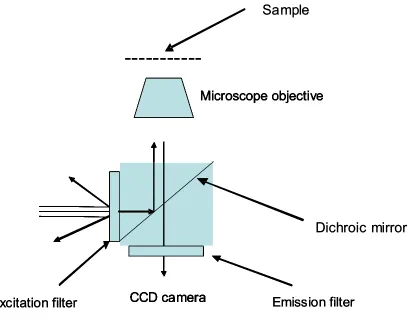
mirror, allowing adaptation for each experiment set-up. Figure 2.1 represents the typical light
filters are placed in front and underneath the dichroic mirror, a set-up which allows separation
between the excitation and emission light.
2.2.3. Dichroic mirror
A dichroic mirror is a color filter which separates the excitation and emission paths. The surface
of the mirror is coated with a thin layer of metal. The thickness and type of coating control the
percent of reflectivity and transmission of incident light as well as the wavelength of processed
waves. The principle by which these optical devices operate is interference. The values below the
transition wavelength are reflected into the objective, while the ones above the value are
transmitted. The excitation light reflected by dichroic mirrors is directed through the objective to
Figure 2.1 Representation of light path through an inverted epifluorescence microscope
The fluorescence light is collected by the objective and transmitted by the dichroic mirror to the
emission filters.
2.2.4. Excitation and Emission Filters
To enhance the efficiency of separation between excitation and emission light, excitation and
emission filters are used along with the dichroic mirror (figure 2.1.). The excitation filters are
located in front of dichroic mirror and select the desired excitation wavelength. Reflection losses
CCD camera
Microscope objective
CCD camera
CCD camera
Microscope objective
Excitation filter
CCD camera
CCD camera
Emission filter
Microscope objective
CCD camera
CCD camera
Microscope objective
Excitation filter
Emission filter
Dichroic mirror
---Sample
CCD camera
CCD camera
Microscope objective
CCD camera
CCD camera
Microscope objective
Excitation filter
CCD camera
CCD camera
Emission filter
Microscope objective
CCD camera
CCD camera
Microscope objective
Excitation filter
Emission filter
Dichroic mirror
filters placed underneath the dichroic mirror select the desired emission wavelength which and
eliminates residual excitation light.
2.2.5. Spectrograph
Diffraction gratings are used to separate polychromatic radiation into monochromatic. The
dispersed radiation is then directed to the CCD camera. Grating selection allows for the selection
of desired wavelengths according to each experimental requirement.
2.2.6. Light Source
A 100 watt high-pressure mercury lamp was used as the light source for the fluorescence
microscopy system. The reason to use a high intensity light source is to enhance the detection of
emission from fluorescent probes that have a low quantum yield. However photobleaching,
photochemical destruction of fluorescent molecules due to exposure to intense illumination,
could occur and is therefore minimized by using neutral density filters.
A high pressure mercury lamp is a continuous optical source in the visible and UV spectrum. In
the discharge spectrum, visible and UV regions are represented unevenly with peaks at 313, 334,
365, 406, 435, 546 and 578 nm. The output intensity at other visible wavelengths is less intense.
Fluctuations in the emission of the lamp are caused by changes in internal pressure and
temperature.
Two tungsten electrodes are placed in an arc quartz tube. The tube is filled with mercury. The
The emission intensity of the lamp decreases in time due to accumulation of electrode metals on
the lamp [2]. The lifetime of mercury lamp is limited to 200 hours.
2.2.7. Phase Contrast Microscopy
Since imaging of transparent specimens is less efficient in bright field microscopy, this is
overcome by using contrast-enhancing optics, which allows visualization of colorless details.
The use of phase contrast microscopy introduces considerable improvement for “in vitro”
biological experiments, because it allows visualization of cellular details with similar
transparency. Phase contrast microscopy was employed in experiments of visualization of beta
pancreatic cells labeled with antibody A2B5-ZnAF2 sensor. In high contrast images, cellular
details are more distinguishable due to differences in their refractive index. Phase contrast optics
allow for better imaging of cellular membranes and adhesions of Min6 cells cultured at
confluence. A Zeiss Axiovert 200 system was employed for recording phase contrast images in
biological experiments. Enhancement of image contrast is ensured by using phase contrast
optical components, to convey changes in amplitudes of electromagnetic waves by changes in
phase.
The output of a tungsten-halogen lamp passes through a collector lens and focuses on a
condenser. A phase plate in the light path after illumination of the sample separates the
undeviated light from the highly refracted light which is retarded in phase. The waves are
focused at image plane and phase contrast image is formed. The phase effect of the image in the
2.2.8. Charge Coupled Device (CCD Camera)
Nowadays, fluorescence microscopy techniques widely use as charged coupled plasma devices
CCD camera as imaging detectors. A CCD camera is an array of coupled light sensitive
capacitors. Charge coupled plasma devices are organized in pixels which accumulates charges
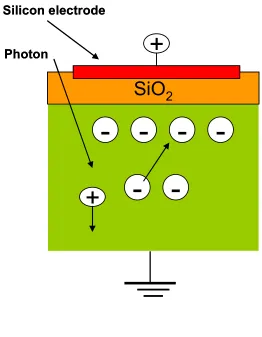
upon light exposure. CCD chips are silicon based integrated circuits. The layer of silicon is
p-type semiconductor doped with boron. Output light from specimens is focused by lens on the
capacitor. Interaction of photons with silicon atoms causes ejection of electrons (figure 2.2).
Incident light, on the silicon chip, should have high enough energy to create electron-hole pairs.
The accumulated charge is directly proportional with the amount of incident light. As a
capacitor, the pixel, a subunit of CCD devices, stores charges between plates. When a voltage
pulse is applied to the read out gate, the charge packets travel across the chip through registers.
The shift registers transport data from a latch in a serial mode [3]. The last pixel in the series
transfers the charge to an amplifier which converts it in a voltage [4]. The voltage is then
digitized in an intensity value. Two dimensional images are formed by reading charge at each
particular pixel. One slice of image is formed by a one-dimensional array of pixels while the
whole image is captured by a two-dimensional array.
CCD cameras are also used as detectors in fluorescence spectroscopy. A spectrograph is a
monochromator without an exit slit, where the dispersion device, a concave diffraction grating, is
typically coupled with a CCD camera. This association allows of detection of low concentration
fluorescent probes. CCD cameras have a high signal-to-noise ratio and are more sensitive than a
photomultiplier tube [5].In a photomultiplier tube, there is a background current referred as dark
Dark counts are minimized by cooling the tube to -400 C [3]. In a CCD camera, cooling to -900 C
minimizes the dark counts to less than an electron per pixel[5].
Figure 2.2 Representation of a CCD pixel. The capacitor is formed by deposition of a silicon
SiO
2
+
Silicon electrode
-
-
-
--
-Photon
+
SiO
2
+
Silicon electrode
-
-
-
--
-Photon
2.3. Microplate Readers
The spectroscopic measurements of zinc release events from beta pancreatic cells, cultured at
confluence, were performed using a SpectraMax M2 microplate reader (Molecular Devices,
Inc.).
Microplate readers are multi-detection systems with a double monochromator, dual-mode
cuvette ports and a top reading capability.
The system is equipped with a spectrophotometer for absorbance (UV-Vis) measurements and a
spectrofluorometer for fluorescence. The microplate reader was used in spectrum module with a
capability to detect 96 wells microplates. SoftMax Pro software was employed.
2.3.1. Double Monochromators
The microplate reader uses two monochromators: an excitation monochromator and an emission
monochromator for tuning different wavelength settings. The output of a xenon flash lamp, as
light source, is directed to a concave holographic grating for tuning the different excitation
wavelengths. In a concave grating the focusing is combined with dispersion. The advantage of
using a concave grating is in the elimination of two monochromator mirrors. Holographic
gratings are polished glass materials, covered with a photoresist to reduce astigmatism at
multiple angles [6]. The selected light travel through 1mm fiber optic bundles to cuvette ports
and microplates. In the cuvette mode, the incident light is reflected by an elliptical mirror and
and reaches a photomultiplier tube detector. For microplate mode, the light passes through the
second fiber optic to a focusing elliptical mirror. The resulted beam investigates then the top of
the microplates. The fluorescence light is collected and directed to the second wavelength
isolation module and then to the PMT detector.
2.3.2. Light Source
A xenon flash lamp is a light source with a continuous light output between 250-700nm. Spectral
outputs, in the discharge spectrum, show sharp lines near 450 and 800nm. The anode and
cathode are sealed in a quartz envelope filled with xenon gas. Directed airflow through the
housing of the lamp removes excess heat and ozone produced during operation. The flash is
generated by ionization of xenon atoms when a high voltage pulse is applied at the cathode.
Collision of xenon atoms with the electrons, which travel across the arc, results in ionization of
the gas[7].
2.3.3. Temperature Control (Chamber) Module
When performing biological experiments, one of the drawbacks related to exploring precise
biological functions “in vitro” pertains to the requirements for optimum growth conditions
(5%CO2, 370C temperature, media, humidity). To address the biological significance of the cell
culture requirements, the spectroscopic experiments monitoring zinc release from beta pancreatic
2.4 Absorption Spectrometry
Spectrophotometric techniques explore the properties of molecules of interacting with specific
frequencies of radiation. The absorption spectrum of a particular substance is a representation of
absorption intensity versus wavelength. Since molecules have discrete energy levels, they absorb
those frequencies which propel them from ground state to excited electronic state. The total
energy of a molecule could be expressed as sum of translational, rotational, vibrational,
electronic and nuclear orientation energy. Absorption of ultraviolet and visible radiation
promotes particular transitions of these categories.
Beer’s law is used to relate the intensity of absorption with the concentration of absorptive
molecules in the light path.
A=εbc (1)
In expression (1), A is absorbance; b is the path length; ε is defined molar absorptivity and c is
concentration.
For absorption measurements a Varian UV-VIS-NIR spectrophotometer system, model CARY
500 Scan was employed. This system is a double beam spectrophotometer.
The advantages of using a double channel consist in compensation for the fluctuations in lamp
intensity, detector or electronics. The sample module is doubled with a reference cell. The output
of a mercury lamp light source travels through a wavelength isolation device (monochromator),
2.5. Atomic force microscopy
Atomic force microscopy (AFM) belongs to a very high-resolution category of scanning force
microscopy. Atomic force microscope is an ideal instrument for studying surfaces, films and
coatings with a nanometer resolution. It provides the ability to image the topography of various
surfaces like conductive and insulators materials [8], organic films [9, 10], biomaterials like
amino acid crystals [11], fibrinogen [12] and obtain information about height, optical
absorption, or magnetism.
The principle by which AFM works is by measuring attractive or repulsive forces between a tip
and the sample. The sample surface is scanned by a tip mounted to a cantilever spring (Figure
2.3). AFMs measure the forces between the tip and surface of the sample through the vertical
deflection of the cantilever. This data is then converted to “force-versus-distance curves” [8].
Figure 2.3 Representation of an atomic force microscope set-up
Laser
Cantilever and tip
Photodetector
Sample surface
Laser
Cantilever and tip
Photodetector
Cantilevers are typically made of silicon or silicon nitride with an oxide layer on the surface.
There are differences in the properties of the top and bottom sides. The top side is covered with a
gold layer to enhance the reflectivity of the laser beam. The bottom face is exposed to changes in
surface stress due to interaction with sample. The shape of the cantilever changes when repulsive
forces create a vertical deflection [8].
While scanning the surface, different set-ups make use of moving the sample vertically by a
piezoelectric translator mounted near the sample or by moving the cantilever through a voltage
applied to an attached piezoelectric translator [8]. Typically a translator is a device which
converts a form of energy into another. Piezoelectric ceramics are used to exploit their ability to
generate an electric field in a material, in response to a voltage gradient or mechanical stress
applied to it [13]. The piezoelectric material contracts or expands in these conditions causing the
sample or the tip attached to it to move.
Today optical lever techniques are largely used to measure the deflection of the cantilever [8,
14 and 15]. A laser beam falls on the end of the cantilever and is reflected. Interaction of forces
between the cantilever tip and the surface features of the sample, results in different degree of
deflection. The laser beam is reflected under an angle twice the value of the angular deflection of
the cantilever. The reflected light reaches a position-sensitive detector.
Atomic force microscopy is a versatile techniques, it allows measurement of topography of solid
substrates as well as studies of force interaction in air, organic solvents [16-20] gases, vacuum,
or aqueous solution [21].
The cantilever tips are attached at the end of the cantilevers. They are made of oxidized silicon