R E S E A R C H
Open Access
A parallel nonlinear adaptive enhancement
algorithm for low- or high-intensity color images
Zhigang Zhou
1,2, Nong Sang
1*and Xinrong Hu
2Abstract
This article addresses the problem of color image enhancement for images with low or high intensity and poor contrast (LIPC or HIPC). A parallel nonlinear adaptive enhancement (PNAE) algorithm using information from local neighborhood is presented to resolve the problem in parallel. The PNAE algorithm consists of three steps. First, a red-green-blue (RGB) color image is converted to an intensity image, then an adaptive intensity adjustment with local contrast enhancement is parallelly performed, and finally, colors are restored. The PNAE algorithm can be adjusted to control the level of enhancement on the overall lightness and the contrast achieved at the output separately. Most of the parameters used in PNAE are robust for LIPC and HIPC color image enhancement. Experimental results show that PNAE outperforms two popular methods in both computational efficiency and overall content preservation of image while improving local contrast for LIPC and HIPC image enhancement.
Keywords:High intensity; Low intensity; Adaptive enhancement; Parallel; Statistics of visual representation
1 Introduction
Color images obtained by image acquisition devices like digital camera usually suffer from certain defects, such as low or high intensity with poor contrast and noises, and these defects result in poor visual quality. The study of image enhancement to improve visual quality has gained increasing attention and become an active area in image and video processing [1]. Reviews of various image enhancement techniques can be found in [2,3]. This article focuses on processing two kinds of poor contrast color images: one is low intensity with poor contrast (LIPC) images and another is high intensity with poor contrast (HIPC) images. Some LIPC images are poor contrast images with only dark regions (Figure 1a), and some LIPC images are poor contrast images with both bright and dark regions (Figure 1b,c). The HIPC images usually result from overexposure and have an overall high intensity with poor contrast (Figure 1d).
The objective of LIPC and HIPC image enhancement is to improve the perception of information contained in an image for human viewers, or to provide‘better’inputs for other automated image processing systems. The
main requirements to achieve the objective are how to properly adjust the intensity and enhance the local con-trast simultaneously, which are our focus in the paper.
Traditional image enhancement methods have certain intensity adjustment abilities, but the abilities for contrast enhancement or detail protection are not strong. These methods include logarithmic compression, gamma correc-tion, histogram equalization [4], etc. The limited perform-ance of these methods results in feature loss or feature un-enhanced [5]. In addition, they may not be able to en-hance all the regions proportionately. For example, with logarithmic enhancement, the low intensity pixel values can be enhanced at the loss of high intensity values [6]; with histogram equalization enhancement, the equaliza-tion may over-enhance the image, resulting in an un-desired loss of visual data, quality, and intensity scale. Enhancement results suffer from local detail losses due to the global treatments on the images [2]. Global processing is often the basic idea of these techniques, so they are not sophisticated enough to preserve or enhance significant image details.
There are some image enhancement algorithms that can adjust the intensity and enhance the contrast at the same time. Retinex-based algorithms, such as Multi-scale Retinex (MSR), are capable of providing better-than-observed imagery, especially where scene content is * Correspondence:[email protected]
1Science and Technology on Multi-spectral Information Processing Laboratory, School of Automation, Huazhong University of Science and Technology, Wuhan 430074, People's Republic of China
Full list of author information is available at the end of the article
greatly obscured, as in the case of rain, fog, or severe haze [7]. The Multi-scale Retinex for Color Restoration (MSRCR) [8] is an effective technique that achieves in-tensity adjustment, local contrast enhancement, and color consistency simultaneously. However, a common problem of Retinex-based algorithms is that separate nonlinear processing is needed for each of the three color bands, and the color restoration is nonlinear. It not only produces artifacts at the boundaries, but also makes the algorithm computationally intensive [6]. In 2005, Tao and Asari proposed a more promising algorithm called adaptive and integrated neighborhood-dependent approach for nonlinear enhancement (AINDANE) [9], and it is more effective than MSRCR. The AINDANE method is composed of two processes. The first process is an adaptive intensity enhancement, and the second process is an adaptive contrast enhancement. The first process is to adjust the intensity of the image, and the sec-ond process is to restore the contrast after the intensity enhancement. The AINDANE method usually performs well for low illuminated images, but it may over-enhance the dark regions of an image and not provide a solution to overexposed images. In 2006, an algorithm called optimal fuzzy transformation (OFT) was proposed [10]. The OFT is an effective technique that achieves better visualization of details on images with poor contrast, regardless of the dark or light background of these details, but the two pro-cesses of intensity adjustment and contrast enhancement in OFT are not parallel. To provide a solution to images
captured under extremely nonuniform lighting conditions, methods like multilevel windowed inverse sigmoid (MWIS) [11] and space-variant luminance map (SVLM) [12] were proposed in 2006 and 2010, respectively. The major con-tribution of MWIS is using a multilevel windowed inverse sigmoid function to render images captured under ex-tremely nonuniform lighting conditions. The major con-tribution of SVLM is that a two-dimensional gamma correction is developed to adjust the intensity in dark re-gions and bright rere-gions in the luminance domain. The two algorithms reveal the details of the original image as well as minimize the loss of the edge sharpness in the nonuniform and low lighting conditions. Two innovative techniques named locally tuned sine nonlinear enhance-ment (LTSNE) [5] and neighborhood-dependent nonlin-ear enhancement (NDNE) [6] were proposed in 2008 and 2010, respectively. LTSNE and NDNE can also obtain fine details of the original image. The major contribution of LTSNE is the simultaneous enhancement and compres-sion of dark and bright pixels using a nonlinear sine squared function with image-dependent parameters. For the NDNE algorithm, as an improved algorithm of LTSNE, its major contribution is that the computations of the image-dependent parameters are simplified. The pro-cessing time is reduced, and the visual quality of the proc-essed image is improved. Although the algorithms mentioned above are adaptive processing methods based on local neighborhood, they have a common disadvantage that the two processes, intensity adjustment and the
contrast enhancement, are not parallel. From the imple-mentation point of view, parallel processing is faster on multiprocessors and improves the computational effi-ciency in practical applications. In order to further improve the computational efficiency, a simultaneous dy-namic range compression and local contrast enhancement (SDRCLCE) algorithm [1] was proposed in 2011. The major contributions of the SDRCLCE algorithm were its parallelization property and its generalization ability to combine with any continuously differentiable intensity mapping function. The SDRCLCE algorithm employs a complicated hyperbolic tangent function as the intensity mapping function, which increases the computational effi-ciency due to the computation of the first-order derivative function. Moreover, the hyperbolic tangent function can-not be used to decrease image intensity and enhance HIPC images.
To sum up, those image enhancement algorithms dis-cussed above have certain deficiencies:
1. Some algorithms are based on global processing and cannot effectively enhance local contrast.
2. Some algorithms are not fit for the parallel structure.
3. Some algorithms can only be used to enhance LIPC images, but not HIPC images.
4. For some algorithms, the intensity mapping functions are complicated, or the normalization methods for the intensity values in the enhanced images are ineffective.
A parallel nonlinear adaptive enhancement (PNAE) al-gorithm based on the local neighborhood is proposed in the paper. The algorithm enhances both LIPC and HIPC images. We compare PNAE with NDNE and SDRCLCE both quantitatively and visually with LIPC and HIPC images because these two popular algorithms are more ef-fective than many commonly used enhancement algo-rithms for LIPC and HIPC images and the facts were shown in [1,6]. The main differences between PNAE with SDRCLCE and NDNE are summarized as follows:
1. SDRCLCE and NDNE employ a complicated hyperbolic tangent function and a sine function as the intensity mapping function, respectively, which reduce the computational efficiency. The proposed PNAE algorithm employs a simple power function as the intensity mapping function, which can be used to enhance LIPC and HIPC images with higher computational efficiency.
2. A new simple and effective normalization method is proposed in the PNAE algorithm that improves the normalization method of SDRCLCE in both enhancement effect and calculation efficiency.
3. PNAE has the parallel processing ability as SDRCLCE, while NDNE does not have the ability.
In the following section, the PNAE algorithm is dis-cussed in detail. Experimental results of the algorithm are discussed in Section 3, followed by the conclusions and discussions of future work in Section 4.
2 The PNAE algorithm
The PNAE algorithm for LIPC and HIPC image en-hancement consists of three steps. First, a red-green-blue (RGB) color image is converted to an intensity image, then an adaptive intensity adjustment with con-trast enhancement based on the local neighborhood is performed parallelly on the intensity image, and then colors are restored to produce the enhancement result. The primary step is the adaptive intensity adjustment with contrast enhancement based on the local neighbor-hood. Because the contrast may be degraded in the intensity-adjusted image, a contrast enhancement process is applied simultaneously to enhance the contrast to im-prove visual effect. Finally, an enhanced color image is ob-tained by performing a linear color restoration process using the chromatic information of the original image. The structure of PNAE is shown in Figure 2, and the shaded blocks represent the primary step of the PNAE algorithm.
2.1 Adaptive intensity adjustment based on the local neighborhood
As mentioned above, we need to convert an RGB color image to an intensity image first. To compute the input intensity image, several existing methods can be employed, such as the NTSC standard method [13] and the intensity value V of the hue-saturation-value (HSV) [14] color model. According to [15], the HSV intensity value is suggested as it achieves color consistency in the RGB color image enhancement. However, considering the computational efficiency and the convenience when comparing with the NDNE and SDRCLCE algorithms, the NTSC standard is used in the paper to obtain the in-tensity. The intensity formula is given by
I xð ;yÞ ¼76:245Irðx;yÞ þ149:685Igðx;yÞ þ29:07Ibðx;yÞ
255
ð1Þ
where Ir(x,y),Ig(x,y), and Ib(x,y) are the red, green, and blue components of a pixel located at (x, y) in the RGB color image. The intensity image is further normalized to
Iinðx;yÞ ¼
I xð ;yÞ
To decrease the intensity values of the high-illumination pixels and increase the intensity values of the low-illumination pixels simultaneously, the intensity image is treated with enhancement and compression processes, respectively, using a specifically designed non-linear sine intensity mapping function defined in [6] as
T Ið inðx;yÞÞ ¼sin2 π
2Iinðx;yÞ
q
h i
; Iinðx;yÞ∈½0;1 ð3Þ
The parameterq in (3) corresponds to the local mean intensity value of the pixel. According to the mathemat-ical theory (see Appendix),
sin2 π 2Iinðx;yÞ
q
h i
≈π2
4 Iinðx;yÞ
2q;
Iinðx;yÞ∈½0;1 ð4Þ
We normalized the formula (4), letp= 2q, and get the new normalized intensity mapping function
T Ið inðx;yÞÞ ¼Iinðx;yÞp; Iinðx;yÞ∈½0;1 ð5Þ
The powerpis given as
p¼c1
Iaveðx;yÞ þε
1−Iaveðx;yÞ
½ þεþc2; ð6Þ
whereIave(x,y)∈[0,1] is the normalized local mean in-tensity value of the pixel at location (x,y),c1and c2are constants determined empirically, and ε= 0.01 is a nu-merical stability factor introduced to avoid division by zero whenIave(x,y) = 1.
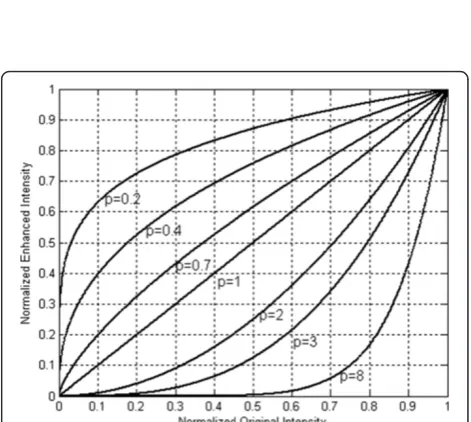
It is easy to see that pis increasing on Iave(x,y). The change curves of function (5) are drawn in Figure 3 for p= 0.2, 0.4, 0.7, 1, 2, 3, and 8. The intensity mapping function (5) is a decreasing convex function with p< 1 and a decreasing concave function with p> 1 as shown in Figure 3. Notice that if a pixel is in a dark neighbor-hood, then Iave(x,y) is smaller andp is less than 1 with appropriate c1and c2, thenT(Iin(x,y)) is bigger thanIin (x,y). Hence, the intensity of the pixel in the dark neigh-borhood would be pulled up. On the contrary, the inten-sity of a pixel in a bright neighborhood would be pulled down. Therefore, the intensity mapping function (5) has
the ability to adjust image intensity adaptively, based on the situation of the local neighborhood.
Generally, noises may also be enhanced as Iave(x, y) is close to 0, but the enhancement for those noises in ex-treme dark regions can be restrained by the parameter c2in formula (6). The parameter c1is used to avoid the great lowering of pixel values in extremely bright regions because of a super high value of Iaveð Þx;y
1−Iaveð Þx;y. The effects of
c1andc2will be discussed in detail in Section 3.
In PNAE, the local average of the image Iave(x, y) in formula (6) is computed by
Iaveðx;yÞ ¼Iinðx;yÞ⊗FLPFðx;yÞ; ð7Þ
where the operator⊗denotes the 2D convolution oper-ation, andFLPF(x,y) denotes a spatial low-pass filter ker-nel function and is subject to the condition
∬
FLPFðx;yÞdxdy¼1: ð8ÞFigure 2The framework of the proposed PNAE algorithm.
Figure 3Curves of mapping function (5) in terms ofIin(x,y).For
In PNAE,FLPF(x,y) is a Gaussian smoothing operator, andIave(x,y) is computed by
Iaveðx;yÞ ¼
X
m;n ð Þ∈Ω
ωmnIinðm;nÞ; ð9Þ
where (x,y) is the center pixel of the M×M neighbor-hoodΩ,Iin(m,n) is the intensity value of the pixel in the location (m, n) of the original intensity image, andωmn is the weight of the pixel in the location (m,n) given by
ωmn¼K−1exp − m−x
ð Þ2þ
n−y
ð Þ2
2σ2
" #
;ðm;nÞ∈Ω;
ð10Þ
where σ is the standard derivation ofωmn, and Kis the normalization factor given by
K¼ X
m;n ð Þ∈Ω
exp −ðm−xÞ
2þ
n−y
ð Þ2
2σ2
" #
: ð11Þ
Formula (9) is a discrete form of formula (7) with the discrete spatial low-pass filter, the Gaussian kernel func-tion in (10). In NDNE and SDRCLCE, a multiscale and a single-scale Gaussian smoothing operator is used, respectively, to produce the mean intensity image. Con-sidering the computational efficiency, a single-scale Gaussian smoothing operator with one neighborhood is used to enhance image in PNAE. The effects of the neighborhood radius R (M= 2R+ 1) and σ will be dis-cussed in details in Section 3, too.
2.2 Adaptive contrast enhancement based on the local neighborhood
The formula of intensity adjustment with local contrast enhancement used in SDRCLCE is given by
Cenhout½Iinðx;yÞ ¼I xð ;yÞT I½ inðx;yÞ þI xð ;yÞT′½Iinðx;yÞ
½Iinðx;yÞ−Iaveðx;yÞ;
¼Cout1þCout2
ð12Þ
where Cenh
out½Iinðx;yÞ denotes the result of intensity
ad-justment with local contrast enhancement forIin(x,y), I x;y
ð Þis given by
I xð ;yÞ ¼ Iinðx;yÞ
Iaveðx;yÞ; ð13Þ
and T′[Iin(x,y)] denotes the first-order derivative of the mapping function (5), which isT′[Iin(x,y)] =p[Iin(x,y)]p−1 Iin(x,y). In formula (12), the itemCout1can be used to ad-just intensity of the original image, and the itemCout2can
be used to enhance local contrast. Moreover, Cout1 and Cout2do not depend on each other and can be computed independently and simultaneously, i.e., formula (12) is a parallel process for intensity adjustment and local contrast enhancement with a dual core processor.
In formula (12), the value of Cenhout½Iinðx;yÞ can be out of the range of [0, 1]. In PNAE, the proposed method to normalize the value ofCenh
out½Iinðx;yÞis given by
Cenhoutnorm½Iinðx;yÞ ¼
0;Cenh
out½Iinðx;yÞ≤0
1;Cenhout½Iinðx;yÞ≥1
Cenhout½Iinðx;yÞ;else
8 <
: ð14Þ
where Cenhoutnorm½Iinðx;yÞ denotes the normalized value
for the output value ofIin(x,y). Though quite simple, the proposed normalization method is still an effective way and has a higher computational efficiency than the normalization method in SDRCLCE, which is confirmed in our experiments in Section3.
2.3 Color restoration
In order to recover the enhanced RGB color image, a simplified multiplicative model based on the chromatic information of the original image can be applied with minimum color distortion. If PRGB
in ¼½Rin;Gin;Bin and PRGB
out ¼½Rout;Gout;Bout denote the input and output color values of each pixel in RGB color space, respectively,
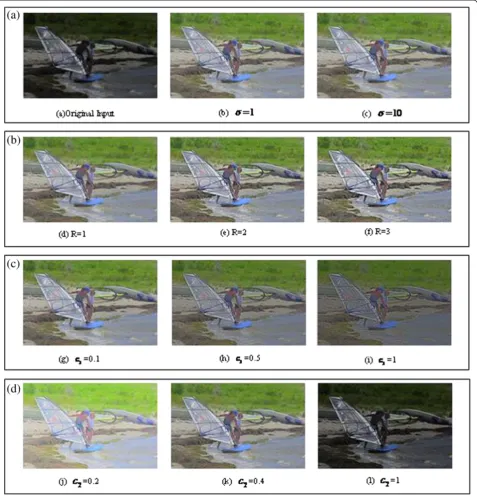
Figure 6The influence of various parameters of the proposed PNAE algorithm. (a)Tweakingσwith fixedc1,c2, andR.(b)TweakingRwith fixedc1,c2, andσ.(c)Tweakingc1with fixedR,c2, andσ.(d)Tweakingc2with fixedR,c1, andσ.
Table 1 The parameter values of Figure 6
A B C D
c1= 0.1,c2= 0.4, R= 1
c1= 0.1,c2= 0.4, σ= 1
c2= 0.4,R= 1, σ= 1
c1= 0.1,R= 1, σ= 1
(b)σ= 1 (d)R= 1 (j)c1= 0.1 (j)c2= 0.2
(c)σ= 1 (e)R= 2 (h)c1= 0.5 (k)c2= 0. 4
then the multiplicative model of linear color remapping in RGB color space is expressed as [1]
PRGBout ðx;yÞ ¼βðx;yÞPRGBin ðx;yÞ; ð15Þ whereβ(x,y) is given by
βðx;yÞ ¼C
enh
out½Iinðx;yÞ þε
Iinðx;yÞ þε ð16Þ
and ε= 0.01 is a numerical stability factor introduced to avoid division by zero whenIin(x,y) = 0.
3 Results and discussion
In this section, we focus on five issues that include feasi-bility test and parameter influence discussion of the pro-posed method, demonstrations of LIPC and HIPC image enhancement results, visual comparisons with NDNE and SDRCLCE, computational speed evaluation, and quantitative comparisons with the results produced by these methods.
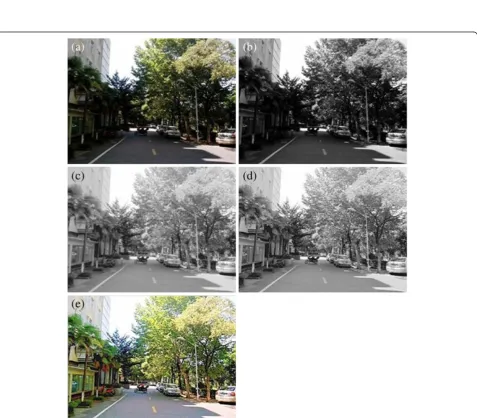
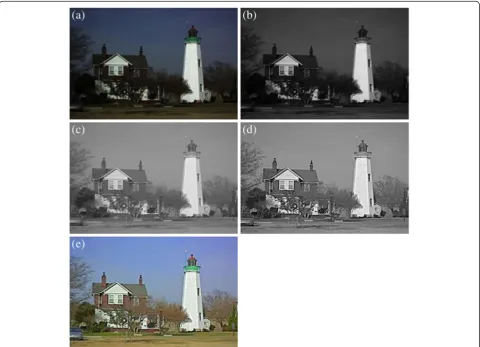
3.1 Feasibility test and parameter influences on PNAE We use a LIPC image (Figure 4a) acquired with a digital camera in daylight and the LIPC image (Figure 5a) in the Test Images Database of Computer Vision Group [16] to test the feasibility of PNAE.
The result at each step of PNAE is shown in Figures 4 and 5. As the most important step of the intensity ad-justment with local contrast enhancement, Figures 4d and 5d show remarkably high-quality results. The great visual improvement demonstrated by the comparison between Figures 4e and 5e with their original images im-plies the feasibility of the PNAE algorithm.
There are four parameters in the PNAE algorithm: the neighborhood radius R (M= 2R+ 1), c1, c2, and σ. In order to study the effects of the parameters, we design four parameter tweaking experiments below:
1. Tweakingσwith fixedc1,c2, andR(Figure6A) 2. TweakingRwith fixedc1,c2, andσ(Figure6B) 3. Tweakingc1with fixedR,c2, andσ(Figure6C) 4. Tweakingc2with fixedR,c1, andσ(Figure6D)
The parameter values of the above four experiments are shown in Table 1. Figure 6 (a) is a LIPC image in the Test Images Database of Computer Vision Group [16]. As shown in A of Figure 6, the algorithm is robust to parameterσ. As shown in B of Figure 6, a larger Rvalue leads to a more obvious contrast enhancement result. In order to avoid over-enhanced image and improve the computational efficiency,R= 1 is suitable for a lot of ex-periments. As shown in C of Figure 6, a larger c1value leads to a smaller value of the overall lightness, andc1∈ (0, 0.4] is suitable for a lot of experiments. As shown in D of Figure 6, a larger c2 value also leads to a smaller value of the overall lightness. The parameter c2∈[0.3, 0.5] is suitable for LIPC image enhancement, and c2> 1 is suitable for HIPC image enhancement, verified by a lot of experiments. In the next section, we will see that the parameters in PNAE algorithm are somewhat robust and we only need to tweak parameter c2 for LIPC and HIPC image enhancement.
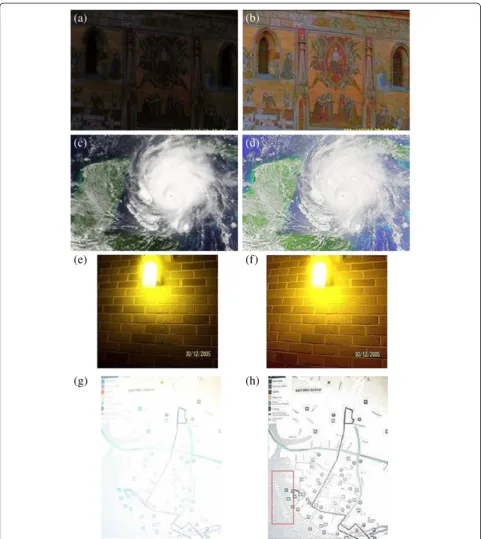
3.2 LIPC and HIPC image enhancement result demonstration The PNAE algorithm has been applied to a large num-ber of LIPC and HIPC images captured under varying
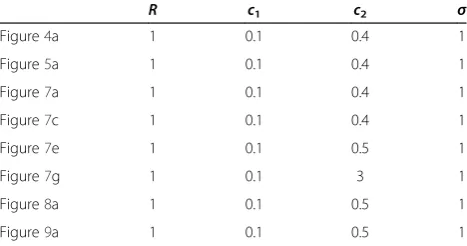
lighting conditions and images in the Test Images Data-base of Computer Vision Group [16] for performance evaluation. In this section, we test the PNAE algorithm with three LIPC images and one HIPC image. Figure 7b shows the enhancement result in LIPC image with only dark regions. Figure 7d,f shows the enhancement results in LIPC images with both bright and dark regions. Figure 7h shows the enhancement result in an overexposed HIPC image. A larger value ofc2is needed for the overex-posed image shown in Figure 7g in order to compress the overexposed area by the specifically designed nonlinear in-tensity mapping function (5). Parameters set for all the ex-periments for PNAE are given in Table 2. It can be seen from Table 2 that the parametersR, c1, andσ have some robust properties and it is sufficient to only tweak the parameter c2 for LIPC and HIPC image enhancement. Figure 7b,d,f achieves better visual effects. The letters are much clearer in the red rectangle in Figure 7h, while these letters cannot be seen clearly in the original image.
To provide a fair comparison, we use the same intensity mapping function (5) and the same Gaussian smoothing operator to calculateIave(x,y) for the proposed PNAE al-gorithm and SDRCLCE alal-gorithm in the following experi-ments with only different normalization methods.
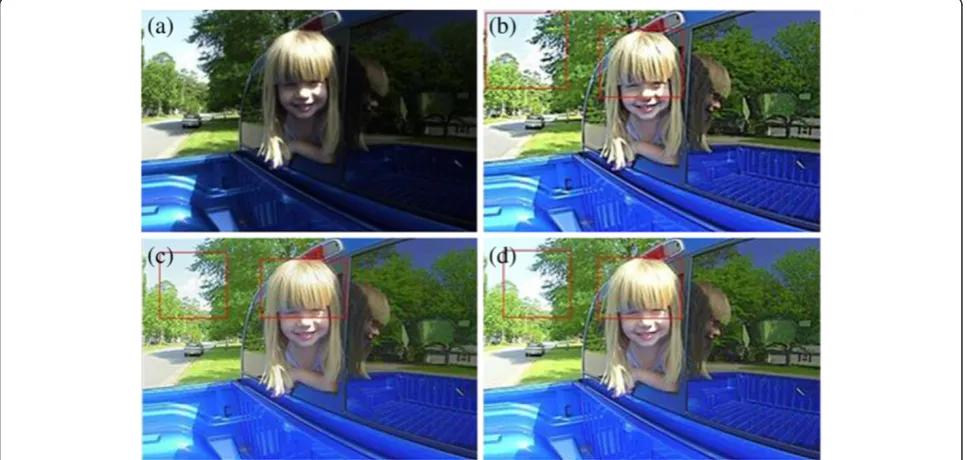
3.3 The visual quality comparisons with NDNE and SDRCLCE Figures 8 and 9 are provided for visual quality compari-sons with NDNE and SDRCLCE. To provide a fair com-parison, the parameter settings of PNAE and SDRCLCE are the same. The parameter settings of NDNE are given in Table 3. In Figures 8 and 9, NDNE produces some-what over-enhanced results. The enhancement results in Figure 8c,d by SDRCLCE and PNAE, respectively, have almost the same visual effects, but the situations are differ-ent in Figure 9. The enhancemdiffer-ent result in Figure 9d by PNAE is visually better than that in Figure 9b,c, especially in the rectangular regions. The different results in the rectangular regions of Figure 9c,d are caused by the differ-ent normalization methods used in PNAE and SDRCLCE, respectively. Figure 9 shows that the image enhanced by
Table 2 The parameter values in all experiments of PNAE
PNAE has an overall higher visual quality in both the low-intensity and high-low-intensity regions.
3.4 Computational speed evaluation
Table 4 lists the results of comparisons of PNAE with NDNE and SDRCLCE on average computation time, re-spectively, using Matlab version 7.9 (R2009b) on the plat-form of Intel Core2 processor, running at 2.00 GHz with
1.93 GB of memory, with twenty 360 × 240 and twenty 460 × 350 test color images.
Table 4 shows that the average processing time of PNAE is less than that of SDRCLCE and is much shorter than that of NDNE. The PNAE algorithm requires approximately 60% of the average processing time of NDNE and 80% of average processing time of SDRCLCE. The PNAE algo-rithm requires less processing time than NDNE because
Figure 9The second performance comparisons with NDNE and SDRCLCE. (a)Original image.(b)Enhanced by NDNE.(c)Enhanced by SDRCLCE.(d)Enhanced by PNAE.
NDNE uses a complicated intensity mapping function, and NDNE cannot be parallelized in a sequential process framework. The PNAE algorithm requires less processing time than SDRCLCE because PNAE uses a more efficient and simpler normalization method than SDRCLCE. Table 4 shows that the average processing times of PNAE and SDRCLCE are much shorter than NDNE because PNAE and SDRCLCE are all based on a parallel process-ing architecture.
3.5 The quantitative comparisons with NDNE and SDRCLCE A quantitative assessment of image enhancement is not an easy task as an improved perception is difficult to quantify owing to the lack ofa prioriknowledge of the most favorable enhanced image. It is therefore necessary to establish a basis which is used to define a good meas-ure of enhancement [17]. In this section, the visually op-timal (VO) region, EMEE and average discrete entropy DEave as quantitative measures are used to analyze the experimental results in only intensity channel of the ori-ginal image and their enhanced image for a color image. In [18], a statistical method is used to compare the per-formance of different enhancement algorithms. Figure 10 illustrates the concept of the statistics of visual representa-tion, which is composed of the global mean of the image and the global mean of the regional standard deviation of the image. The VO region approximately ranges from 40 to 80 for the mean of standard deviation and from 100 to 200 for the intensity mean of the image.
Recently, some practically efficient image enhance-ment measures based on the human visual system have been proposed, such as AWC [19,20] and EMEE [20,21]. The contrast measure AWC was based upon the Weber contrast law and later developed into EMEE, based on Fechner's law and the well-known entropy concept. The EMEE was used to measure our results. The EMEE is calculated by dividing an image intok1× k2sized blocks, processing each block with Equation 17,
and averaging the results. The EMEE is summarized by the following formula:
whereΦis a given enhancement algorithm; par denotes parameters in the enhancement algorithm;k1and k2are the numbers of horizontal and vertical blocks in an image, which are related to the blocks and the image size;IW
max;k;land IWmin;k;l are the maximum and minimum
intensity values of the block, respectively; and c is a small constant to avoid dividing by 0. A higher EMEE value indicates an image with a higher contrast.
The discrete entropy DE of an image X measures its content, where a higher value indicates an image with richer details [17]. It is defined as
DEð Þ ¼X −X
255
i¼0
p xð Þi logðp xð Þi Þ ð18Þ
wherep(x1) is the probability of pixel intensityx1that is estimated from the normalized histogram. The average absolute discrete entropy difference DEave between the input imageXiand the output imageYiis defined as
Figure 10Concept of VO region. Table 3 The parameter values in NDNE for Figures 8a and 9a
Values
Figure8a p= 2.5114,M=N= 5,c1= 5,c2= 20,c3= 240,Wi= 1/3,i= 1, 2, 3
Figure9a p= 2.3158,M=N= 5,c1= 5,c2= 20,c3= 240,Wi= 1/3,i= 1, 2, 3
Table 4 Comparisons of average processing times of NDNE, SDRCLCE, and PNAE (unit, seconds)
Color images size (pixels) NDNE SDRCLCE PNAE
360 × 240 0.18 0.12 0.11
DEave¼
Of an enhancement algorithm, the smaller DEave value means a better preservation ability for the overall content of the input image while improving its contrast [17].
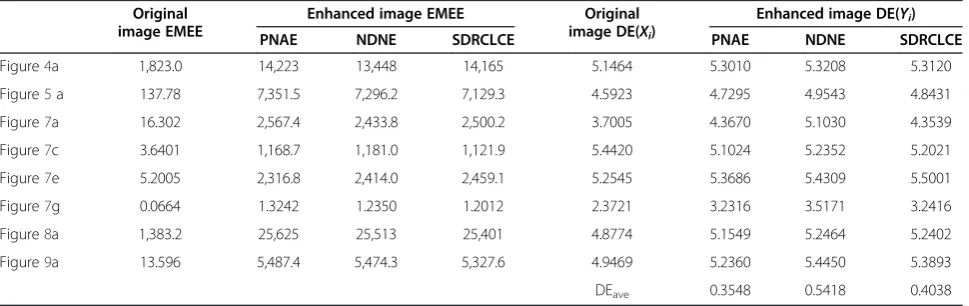
In the section, we use four typical original images of Figures 7a,e, 8a, and 9a to calculate the global intensity mean value M and the regional mean value of standard deviation D. Those results by NDNE, SDRCLCE, and PNAE are shown in Table 5. We also calculated the EMEE (the block size is 8 × 8), DE, DEave values for all images in Table 6 by using their original normalized tensity images and their corresponding normalized in-tensity adjustment with contrast-enhanced images. The results of the comparisons among NDNE, SDRCLCE, and PNAE are shown in Table 6.
As shown in Table 5, Figures 7a,e, 8a, and 9a are all enhanced to the VO region by PNAE and SDRCLCE, but Figures 8a and 9a are not enhanced to the VO re-gion by NDNE because the rere-gional standard deviation
D is more than 80. The M results of PNAE are similar to those of NDNE because of their approximately equivalent intensity mapping functions. The M and D values of PNAE are similar to those of SDRCLCE on the whole because of the only difference on the nor-malization method.
As shown in Table 6, in addition to Figure 7c,e, the EMEE values for PNAE of the remaining six images are greater than the EMEE values for both NDNE and SDRCLCE. The average absolute discrete entropy differ-ence DEavefor PNAE, NDNE, and SDRCLCE are 0.3548, 0.5418, and 0.4038, respectively. Since the EMEE and the DEave are related to the ability of contrast enhance-ment and the overall image content preservation, one can say that the proposed PNAE preserves the overall content of the image better than NDNE and SDRCLCE while improving its local contrast.
4 Conclusions
This paper proposes an adaptive algorithm of intensity ad-justment and local contrast enhancement for LIPC and HIPC color image enhancement. The proposed PNAE al-gorithm, inspired by the algorithm SDRCLCE, is able to simultaneously enhance the image intensity and local con-trast with better visual effects. The performance of the pro-posed PNAE algorithm has been compared with two popular methods both quantitatively and visually. Experi-mental results show that the PNAE algorithm not only out-performs those two in terms of computational efficiency, but also provides better visual representation in quantitative comparisons. Compared with NDNE and SDRCLCE, PNAE has the following merits:
1. PNAE has a higher computational efficiency than NDNE and SDRCLCE because PNAE uses a simpler intensity mapping function and a simpler normalization method.
2. Some parameters in PNAE are certainly robust for LIPC and HIPC color image enhancement and make the algorithm adjustable to separately control the level of enhancement on the overall lightness and the contrast achieved at the output.
Table 6 Values of EMEE, DE, and DEavein NDNE, SDRCLCE, and PNAE
Original image EMEE
Enhanced image EMEE Original
image DE(Xi)
Enhanced image DE(Yi)
PNAE NDNE SDRCLCE PNAE NDNE SDRCLCE
Figure4a 1,823.0 14,223 13,448 14,165 5.1464 5.3010 5.3208 5.3120
Figure5a 137.78 7,351.5 7,296.2 7,129.3 4.5923 4.7295 4.9543 4.8431
Figure7a 16.302 2,567.4 2,433.8 2,500.2 3.7005 4.3670 5.1030 4.3539
Figure7c 3.6401 1,168.7 1,181.0 1,121.9 5.4420 5.1024 5.2352 5.2021
Figure7e 5.2005 2,316.8 2,414.0 2,459.1 5.2545 5.3686 5.4309 5.5001
Figure7g 0.0664 1.3242 1.2350 1.2012 2.3721 3.2316 3.5171 3.2416
Figure8a 1,383.2 25,625 25,513 25,401 4.8774 5.1549 5.2464 5.2402
Figure9a 13.596 5,487.4 5,474.3 5,327.6 4.9469 5.2360 5.4450 5.3893
DEave 0.3548 0.5418 0.4038
Table 5 Values ofMandD in NDNE,SDRCLCE, and PNAE
Figure7a 23.87 15.60 104.43 43.61 104.87 41.01 103.14 45.40
Figure7e 84.21 35.84 148.1 54.92 149.4 53.86 146.3 55.19
Figure8a 58.19 40.28 120.9 60.74 121.1 85.20 117.1 59.01
3. The proposed PNAE preserves the overall content of the image better than NDNE and SDRCLCE while improving its local contrast.
Moreover, the PNAE algorithm is amenable to parallel processing like the SDRCLCE algorithm and can be used to enhance LIPC and HIPC color image enhancement like the NDNE algorithm. The acceleration of PNAE and optimal design of parameters are left to our future study.
5 Consent
Written informed consent was obtained from the pa-tient’s guardian/parent/next of kin for the publication of this report and any accompanying images.
Appendix
Using the Taylor mean value theorem, there is
sinx¼x−x
According to (21), there is
sin2 π
For further discussion, please email Zhigang Zhou at [email protected].
Competing interests
The authors declare that they have no competing interests.
Authors' information
ZZ received his M.S. degree in computational mathematics from Chengdu University of Technology, Chengdu, China, in 2006. He is now a Ph.D. candidate in the Institute for Pattern Recognition and Artificial Intelligence, Huazhong University of Science and Technology, China. His research interests include digital image processing and pattern recognition. NS was born in 1968. He is a Ph.D. degree holder and a professor in National Key Laboratory of Science & Technology on Multi-spectral Information Processing, Institute for Pattern Recognition and Artificial Intelligence, Huazhong University of Science and Technology (HUST). He is a vice dean of the automation institute, HUST. His research interest covers computational modeling of biological vision perception, and applications in computer vision, image analysis and object recognition based on statistical learning, medical image processing and analysis, interpretation of remote sensing images, and intelligent video surveillance.
XH was born in 1973 and earned her Ph.D. at the Institute for Pattern Recognition and Artificial Intelligence, Huazhong University of Science and Technology in 2008. Now she is a professor and a vice dean in the School of Mathematics and Computer Science, Wuhan Textile University, People's Republic of China. Her research interests include image processing, virtual reality technology, and computer vision.
Acknowledgements
The paper is partially supported by the National Science Foundation of China with grant no. 61103085.
Author details
1Science and Technology on Multi-spectral Information Processing Laboratory, School of Automation, Huazhong University of Science and Technology, Wuhan 430074, People's Republic of China.2School of Mathematics and Computer Science, Wuhan Textile University, Wuhan 430073, People's Republic of China.
Received: 24 January 2014 Accepted: 25 April 2014 Published: 16 May 2014
References
1. CY Tsai, CH Chou, A novel simultaneous dynamic range compression and local contrast enhancement algorithm for digital video cameras. EURASIP Journal on Image and Video Processing6, 1–19 (2011). https://link.springer. com/article/10.1186/1687-5281-2011-6
2. SS Bedi, R Khandelwal, Various image enhancement techniques - a critical review. International Journal of Advanced Research in Computer and Communication Engineering2(3), 1605–1609 (2013)
3. MK Saini, D Narang, Review on image enhancement in spatial domain, in
Proc. of Int. Conf. On Advances in Signal Processing and Communication
(Lucknow, India, 2013), pp. 76–79. 21–22 June 2013
4. TK Kim, JK Paik, BS Kang, Contrast enhancement system using spatially adaptive histogram equalization with temporal filtering. IEEE Transactions on Consumer Electronics44(1), 82–87 (1998)
5. S Arigela, KV Asari, A locally tuned nonlinear technique for color image enhancement. WSEAS Transactions on Signal Processing
4(8), 514–519 (2008)
6. P Rupal, K Vijayan, Asari, A neighborhood dependent nonlinear technique for color image enhancement, inImage Analysis and Recognition Lecture Notes in Computer Science, vol. Volume 6111, 2010, pp. 23–34. http://link. springer.com/chapter/10.1007/978-3-642-13772-3_3
7. G Woodell, D Jobson, Z Rahman, G Hines,Advanced image processing of aerial imagery, in Proc(SPIE Visual Inform. Process. XIV, Kissimmee, FL, May, 2006). 2006 8. D Jobson, Z Rahman, G Woodell, A multiscale Retinex for bridging the gap between color images and human observation of scenes. IEEE Trans. Image Process.6(7), 965–976 (1997)
9. L Tao, VK Asari, Adaptive and integrated neighborhood-dependent approach for nonlinear enhancement of color images. J. Electron. Imaging
14(4), (2005). 043006-1-043006-14
10. R Vorobel, O Berehulyak, Gray image contrast enhancement by optimal fuzzy transformation, inArtificial Intelligence and Soft Computing–ICAISC 2006, Lecture Notes in Computer Science, vol. Volume 4029, 2006, pp. 860–869. https://link.springer.com/chapter/10.1007%2F11785231_90#page-1 11. K Vijayan Asari, O Ender, A Saibabu, Nonlinear enhancement of extremely
high contrast images for visibility improvement, inComputer Vision, Graphics and Image Processing Lecture Notes in Computer Science, vol. Volume 4338, 2006, pp. 240–251
12. S Lee, H Kwon, H Han, G Lee, B Kang, A space-variant luminance map based color image enhancement. IEEE Transactions on Consumer Electronics
56(4), 2636–2643 (2010)
13. G Valensi, Color Television System. US Patent.3534153, (1970) 14. S Marsi, G Impoco, A Ukovich, S Carrato, G Ramponi, Video enhancement and
dynamic range control of HDR sequences for automotive applications. EURASIP Journal on Advances in Signal Processing2007(080971), 1–9 (2007) 15. L Tao, R Tompkins, VK Asari, An illuminance-reflectance model for nonlinear
en-hancement of color images, inProceedings of IEEE Computer Society Conference on Computer Vision and Pattern Recognition(San Diego, CA, USA, 2005), pp. 159–166. 20–26 June 2005
17. T Celik, T Tjahjadi, Automatic image equalization and contrast enhancement using Gaussian mixture modeling. IEEE Transactions on Image Processing
21(1), 145–156 (2012)
18. DJ Jobson, Z Rahman, GA Woodell, Statistics of visual representation. SPIE Proceeding4736, 25–35 (2002)
19. SS Agaian, Visual morphology, inSPIE Proceeding. Nonlinear Image Processing X, vol. 3646 (San Jose, CA, 1999), pp. 139–150
20. SS Agaian, B Silver, KA Panetta, Transform coefficient histogram-based image enhancement algorithms using contrast entropy. IEEE Transactions on Image Processing16, 741–758
21. SS Agaian, K Panetta, AM Grigoryan, A new measure of image enhancement, inIASTED Int. Conf. Signal Processing Communication
(Marbella, Spain, 2000), pp. 19–22. 19–22 Sept 2000
doi:10.1186/1687-6180-2014-70
Cite this article as:Zhouet al.:A parallel nonlinear adaptive
enhancement algorithm for low- or high-intensity color images.EURASIP Journal on Advances in Signal Processing20142014:70.
Submit your manuscript to a
journal and benefi t from:
7Convenient online submission 7Rigorous peer review
7Immediate publication on acceptance 7Open access: articles freely available online 7High visibility within the fi eld
7Retaining the copyright to your article