(:ol)yright 0 1986 by the Genetics Society of America
MONTE CARLO STUDIES
OF PLANT MATING SYSTEM
MIXED MATING MODELS
ESTIMATION MODELS: THE ONE-POLLEN PARENT AND
DANIEL J. SCHOEN* A N D MICHAEL T. CLEGG?
*Department of Biology, McGill University, 1202 Avenue Docteur Penfild, Montreal, Quebec H 3 A lB1, Canada, and ?Department
of
Botany and Plant Sciences, Universityof
Cal$ornka,Riverside, Calijiornia 92521 Manuscript received August 21, 1985 Revised copy accepted December 1 1, 1985
ABSTRACT
Estimation of mating system parameters in plant populations typically employs family-structured samples of progeny genotypes. These estimation models pos- tulate a mixture of self-fertilization and random outcrossing. One assumption of such models concerns the distribution of pollen genotypes among eggs within single maternal families. Previous applications of the mixed mating model to mating system estimation have assumed that pollen genotypes are sampled ran- domly from the total population in forming outcrossed progeny within families. In contrast, the one-pollen parent model assumes that outcrossed progeny within a family share a single-pollen parent genotype. Monte Carlo simulations of fam- ily-structured sampling were carried out to examine the consequences of viola- tions of the different assumptions of the two models regarding the distribution of pollen genotypes among eggs. When these assumptions are violated, estimates of mating system parameters may be significantly different from their true values and may exhibit distributions which depart from normality. Monte Carlo meth- o d s were also used to examine the utility of the bootstrap resampling algorithm for estimating the variances of mating system parameters. T h e bootstrap method gives variance estimates that approximate empirically determined values. When applied to data from two plant populations which differ in pollen genotype distributions within families, the two estimation procedures exhibit the same behavior as that seen with the simulated data.
HE mating system of a population determines how genetic information is
T
transmitted between generations. Knowledge of the mating system is central to understanding the mechanisms of evolutionary change. One ap- proach to describing the mating system in plant populations has involved the use of genetic markers to reconstruct the pattern of mating through analysis of parental and progeny genotypes (FYFE and BAILEY 1951; BROWN and AL-LARD 1970; CLEGG, KAHLER and ALLARD 1978; CLEGG 1980; SHAW, KAHLER and ALLARD 1981; RITLAND and JAIN 1981; SCHOEN and CLECC 1984). This approach entails the estimation of parameters which underlie models of plant mating systems. T h e parameters of interest include the proportion of seeds produced via random outcrossing as opposed to self-fertilization, the frequen-
928 D. J. SCHOEN AND M. T. CLEGG
cies of alleles in the outcrossed pollen pool (the pollen involved in outcrossing events) and the genotype frequencies of the mating parents.
Mating system estimation is relevant to many areas of evolutionary and applied genetics. For example, the effect of the mating system on genotype frequencies must be known in order to estimate the direction and intensity of selection acting on genotypes (CLEGG 1983). Knowledge of the mating system has also proven useful in understanding the structure of genetic variation among populations (LEVIN 1977; BROWN 1979; LOVELESS and HAMRICK 1984), the level of within-population genetic variability (BROWN 1979; HAMRICK, LIN-
HART and MITTON 1979) and the response of populations to selection (ALLARD
1960).
In estimating mating system parameters it is typically necessary to make several assumptions about the mating process. T h e assumptions most widely used for this purpose are incorporated in the mixed mating model (HAYMAN
1953; CLECC 1980). They state that (1) mating events are of two types- random outcrossing (occurring with probability t) and self-pollination (occur- ring with probability s = 1
-
t ) ;(2)
outcrossing rates are constant and inde- pendent of maternal genotype; and (3) pollen genotypes are distributed uni- formly among all eggs (i.e., each outcrossing event can be viewed as resulting from a random draw of pollen from an infinite pool of pollen of all genotypes). There are several reasons for choosing the mixed mating model to represent the pattern of genetic transmission in plant populations. First, many plants are self-compatible and may be self-pollinated to some degree. Second, the mixed mating model provides a simple description of the mating system, requiring the estimation of only the outcrossing rate and pollen pool allele frequencies. Third, the mating systems of many plant populations may be reasonably ap- proximated by the assumptions of the mixed mating model. T h e mixed mating model has often been successfully applied to mating system estimation in plants(CLEGG 1980). Nevertheless, in certain cases the mixed mating model fails to provide an adequate description of the mating system. For example, ENNOS
MATING SYSTEM PARAMETERS 929
maternal families. This question is posed for a much larger number of param- eter combinations than in our earlier paper, and the results obtained a r e often qualitatively different from those previously reported by us, especially for asymmetrical gene frequencies. Next, we examine the accuracy of variance estimates of mating system parameters obtained through the computationally simple bootstrap algorithm (EFRON 1979). This is done for simulations in which the pollen genotype distribution assumptions either a r e or a r e not violated. Lastly, we investigate each model’s performance with data from two plant populations. The populations studied are especially appropriate test cases, as independent evidence has indicated that they differ with regard to the sam- pling of pollen genotypes within maternal families (SCHOEN 1985).
MATERIALS A N D METHODS
The simulation algorithms assume an infinitely large population with a mating system characterized by the parameter values we seek to estimate (referred to as “true” values of mating system parameters). The simulations yield an array of progeny genotypes organized by family. For simplicity, we assume a single diallelic marker locus. Two methods of simulating family-structured data were used. In the first method, the prob- ability of an egg being outcrossed with pollen of genotype A I is equal to the product of the frequency of the allele in the pollen pool and the outcrossing rate, p - t . In the second, when an egg is outcrossed with pollen of a particular paternal genotype, all other outcrossing events of that seed parent involve the same paternal genotype. Fre- quencies of parental genotypes in both simulation methods are based on inbreeding equilibrium. The two simulation methods correspond with assumptions made in the mixed mating model and one-pollen parent model, respectively, and are hereafter re- ferred to as the mixed mating model and one-pollen parent model simulation methods. Each of two estimation procedures were applied to the simulated family-structured data; i.e., the estimation procedure based on the mixed mating model (CLEGG, KAHLER and ALLARD 1978) and the procedure based on the one-pollen parent model (SCHOEN and CLEGG 1984). When employing each procedure, we assume that maternal parent genotypes (or mating types) are unknown, and hence, estimation involves inferring a 3 X 3 (or 9 X 3) array of the numbers of progeny genotypes produced by the different maternal parent genotypes (or mating types) (CLEGG, KAHLER and ALLARD 1978; SCHOEN and CLEGG 1985). This assumption is often necessary because age- or tissue- specific expression of allozyme phenotypes (BROWN and ALLARD 1970) may lead to errors of identification of the maternal genotype. The procedure based on the mixed mating model gives estimates of the outcrossing rate ( t ) , the frequency of the A I pollen in the pollen pool
( p )
and the frequency of the genotypes A I A I , A1A2 and A2A2 among the maternal parents ( M I , , MI2 and MZ2). The procedure based on the one-pollen parent model gives estimates of the paternal parent genotype frequencies ( P I ] , P I * and P22) inplace of the pollen pool allele frequency. Table 1 shows the transition probabilities for both estimation models. The maximum likelihood and gene counting estimation pro- cedures as applied to mating system estimation by CLEGG, KAHLER and ALLARD (1978) and SCHOEN and CLEGG (1984) were used. In all above-described simulations, five progeny per family (k = 5) and 200 families (n = 200) were sampled. Sampling of families was simulated for populations characterized by the nine possible pairwise com- binations o f t = 0.8, 0.5 and 0.2 and
p
= 0.5, 0.6 and 0.8.930 D. J. SCHOEN AND M. T. CLECG TABLE 1
Probabilities of observing progeny genotypes given maternal parent genotypes (mixed mating model) or mating types (one-pollen parent model)
Progeny genotypes
Parental genotype(s) AIAI AI& AsAs
Mixed mating model
A I A I s
+
t p tq 0A d z s/4
+
t p / 2 112 s/4+
tq/2A2A2 0 tP s
+
tq1 s
+
t / 2S
s/4
+
t / 2114 $14 0 0 0
0 0
0
si4 114 s/4
+
t / 2S
s
+
112 1Diallelic locus was assumed. T h e probability of self-pollination = s = 1
-
1. T h e frequency of A I pollen in the outcrossed pollen pool = p = 1-
q.out 100 times, and the 100 sets of parameter estimates were used to calculate the standard deviations of the sample distributions. As we were also interested in how the bootstrap estimates varied among different samples, we calculated ten sets of bootstrap standard deviations, one set for each of ten different simulated data sets based on a given parameter combination.
To further examine the performance of the estimation procedures, families of prog- eny were obtained from two plant populations. T h e first was an experimental popula- tion of the common morning glory, Ipomoea purpurea Roth, described in detail in SCHOEN (1985) and SCHOEN and CLEGG (1985). This population was assembled from a pool of parent plants which had been genotyped at a diallelic marker locus coding for esterase (EC 3.1.1.1). Families consisted of one to six progeny from individual fruits. Statistical analyses of the progeny genotype distributions from this population revealed positive intraclass correlations between frequencies of detected outcrosses at the within fruit (family) level (SCHOEN 1985). T h e second population was a clonal seed orchard of white spruce, Picea glauca (Moench) Voss composed of 5 to 69 ramets of 33 genotypes. T h e population was also the object of an earlier study (SCHOEN 1985). Clones in this population were genotyped at a diallelic marker locus coding for glutamate dehydro- genase (EC 1.4.1.3) that is expressed in needle and seed tissue (CHELIAK and PITEL
1984). Families of ten progeny each were obtained by sampling at random from the pooled seeds of one to ten cones per ramet. Ramets from 9 of the 33 clones were used in this experiment. Analysis of the progeny genotype distributions at Gdh revealed no intraclass corrrelations between frequencies of detected outcrosses at either the within cone or within plant levels (SCHOEN 1985).
MATING SYSTEM PARAMETERS
TABLE 2
Deviation between the true and estimated numbers of heterozygous progeny produced by heterozygous maternal parents
93 1
True value True value of P of 2
0.5 0.8
0.5 0.5
0.5 0.2
0.6 0.8
0.6 0.5
0.6 0.2
0.8 0.8
0.8 0.5
0.8 0.2
Simulation method used
Mixed mating One-pollen parent Mixed mating One-pollen parent Mixed mating One-pollen parent
Mixed mating One-pollen parent Mixed mating One-pollen parent Mixed mating One-pollen parent
Mixed mating One-pollen parent Mixed mating One-pollen parent Mixed mating One-pollen Parent
Percents e deviation in the num&rs of hetero- zygous progeny pro- duced by heterozygous
maternal parents +0.85 +27.88 +2.29 +39.46 -2.94 +14.00
+0.20 +38.25 +0.20 +39.55 +2.00 +12.53
+2.49 +55.21 -1.77 +48.85
+1.18 +23.31
Mixed mating model was assumed in the calculation of the true clas- sification. Estimated numbers were obtained from the means of N =
1000 simulation-estimation trials.
parent and mixed mating models, assuming unknown maternal genotypes. Estimates of mating system parameters obtained by the three methods were then compared.
RESULTS
We present the estimates of mating system parameters based on each model separately. We include (1) comparisons of the true and estimated classifications of progeny genotype numbers given maternal parent genotypes (mating types);
(2)
mean estimates (and standard errors of the mean estimates) based on 1000 replications for each parameter combination; (3) selected plots of the distri- butions of these 1000 estimates for several parameter combinations; (4) boot- strap estimates of parameter standard deviations; and ( 5 ) analyses of family structured data from populations of morning glory and white spruce.932 D. J. SCHOEN AND M. T. CLEGG
excesses of heterozygous progeny (Table 2). T h e bias was greatest for unequal allele frequencies and large outcrossing rates.
T h e simulation results also indicated that
x2
statistics associated with the test of goodness-of-fit of estimated parameters to the data (when model assumptions were not violated) departed significantly from ax 2
distribution with 1 d.f. This was true for the four cases examined ( t = 0.8, 0.6 andp
= 0.5, 0.6). T h ex2
test proposed by CLEGG, KAHLER and ALLARD (1978) appears to be inappro- priate for this compound sampling process. A goodness-of-fit test based on Monte Carlo simulation, such as outlined by RITLAND and JAIN (1981), is a possible alternative.
Deviations between estimated and true values of t,
p ,
M I 1 and MI2 were small for the data simulated by the mixed mating model method (Tables 3 and 4). For data produced by the one-pollen parent model simulation method, how- ever, three results are of interest. First, there were often large and significant discrepancies between true and estimated values of mating system parameters (Tables 3 and 4). Estimates of the outcrossing rate,f,
were significantly smaller than the true values, particularly for simulations involving large outcrossing rates. Estimates of pollen pool allele frequency,$,
were significantly greater than the t r u e value when allele frequencies were unequal. T h e estimated fre- quencies of heterozygous maternal parents were biased upwards for large out- crossing rate and unequal allele frequencies. Second, the estimates varied more, as evidenced by the larger standard errors of the mean estimates (Tables 3 and 4). Third, unlike the apparently normal distributions of the parameter estimates obtained when the mixed mating model method of simulation was employed, the distributions of parameter estimates were often bimodal orj-
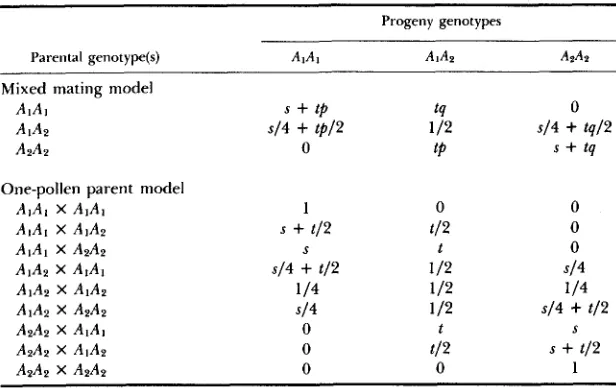
shaped. Figures 1-3 show representative distributions of parameter estimates obtained via the mixed mating model. T h e top half of each figure shows the distribution of parameter estimates when the simulations were conducted with- out violations of model assumptions, whereas the bottom half gives the distri- butions when there were violations of the pollen genotype distribution as- sumption. Departures from normality were not apparent when there were no violations of model assumptions (Figures 1-3, a-c), but when the assumption of uniform pollen genotype distribution was violated, especially for t = 0.8 and 0.5, pronounced departures from normality were observed (Figures 1-3, d-f).
MATING SYSTEM PARAMETERS
G G
zz-
G G0 0 0 0 0 0
1
0
-
9 98 8
9 9
g
ss
v ws s
2 2
'9'92 2
5
-8
0 0ii
2
."
i
.B
Yg
g.$
P
I b q n m
- -
t - m o n m - m mh h A h h h
- -
-4 - 3g
.C
CI
-
0 0 0 0 0 09 9
8 8
9 9Q
ss
w vs s $
ot-
5 ;
2 2
*
1'- m n - m m -
h:
9
"10 0 0 0 0 0 h
0
G C 2 q S S k
"
'50 0 0 0 0 0
h 9 9
3 4
4:
%'$3 9
2
4 1
p,$ 3
z
1 3
.Ek
g
ss
2:
&*I ' q O b o m t - a
o m o v m b
0 0
2 6
2 2
? ?u a
-
M O %
E h
-
h h Ah
- - =
3 c . l - m m m . 0 0 0 0 0 0
h 9 9 9 9
8 8
g
c s
z s
v v1,- n - b n n -
m e m b m m n
3 %
o g2% 2 % 2 2
2
5:
2
S e
sa
h 9 98 8
8 8
$ 3
9":2 2
2 2
1:
2
-g
.!
s u
2 2 2 2 2 2
h h
m h3
- -
S S
--
0 - 0 0
z z
r 3
Q
s s
w w v w b - I'* m t - a m O b= E 0 0
" M
f i e 3 %
G g
o m m n ot-
G Z G;t;; G G
0 0 0 0 0 0
h 9 9 9 9
8 8
Q
ss
sc
v v m o m n x'r:1,- 0 t- a m
" 4
3
e
4 4M .- C ? i?
% 5
FFL
FFL
pFLn
II) 2 . z 'J C .-
.-
Z E
24
e
U 322
E =Y a
g b
w 2 .x t:
.x
C.-
t:I E O E O E O
3
.
il
Ih: 5 -
9
$32
z
2
;
-
C C
E
.I
5,.
O Ez t
2:
- a & _ 0 e,-
CI-
933 %z
2 58
%g
b -E4
2
B
.=
d.I
4 y, I1
-
db m .-
.-
g
2
CI
.- .a
z
0
.-
Y-
z
.z 0 0 2 11 2 C934
8
P
3
k
.
?i
I.
8 2
I9%
4 g
Fa
'51
S f
3 k
*
.E a3 p
2
$ 9a ,
2
k $ $I&?
l-5
,<g
3B
E E
2;
gz
& 4
5
3
E 0 .* I*
E
9
0 , $ 3 )I *= E
a.;; .I U M" 3
CI
k
-9
i
0
* e
-
e
Y!!
rclE
z
9
*.
!!
I2
*
D. J. SCHOEN AND M. T. CLEGG
n h
_ -
nn
- _
AC-h0 0 0 0 0 0
9 9 9 9
3 v v PP P S
2 2 2
2 2 2 2 2 2
0 0 0 0 0 0 0 0 0
h
a
8 8
,g
r - m m 0 - f - b e -2
'3:
h
8 8
9 9B
14
2 % 2
0 4 - 0 * * mt
2 2 2 2 2 %
m z , , g
6
3 3 I<*
s s
%,*$
eomz
g g z
m o m.o
L 0
y
?
:
2 2 6
2 2 2
.;9
-0$ 2
T
z z
2
9 9
8 8
1-
PP PP v v 11l<g g g g
s g z z g z
2
5 9 " Y - ? ?2 2 2
3G - 2 G - 6 -
;
;
z
'f9 9
8 8
.E
,'.g
3Pg f-00 *Loo2
2 2 %
Y Y ? " " Y.o
z
2
.-2 2
o o
- -
00 0 =S. 0 0 0
p 9 9 9 9 9 9
2
,<S
22%22.9
c o m m II0 0 0 0 0 0 0 0 0
g
n h
- 3 p"
Y v v v v PP 71
A h
- _
AA
- -
0 0 0 0 0 0
p
8 8
o m m f - w f -
-
h hn h
3 3
Ah
0 0 - m 0 0
9 9 9 9
-
c l - 0 Qh
3
-
S P PPc c
cA n h h
2G-
- -
e,
0 0 0 0
z
-
p 9 90 0 0 0 0 0
rd C
A A 0
.- i.
Q
0 0
0 0
h
p
8 8
v v PP v v
-
v
m n n c Q m m
0 0 0 0 0 0
3
h h
h
v P O E O O S
"""
c??" ' 4 ' 4 Y LO" 2-0
$ g
.d Y y n 'c
C C c m n
0 C S
* . E CL m . 5 p E &
$ E z ? E = 0 2 m 2
$ 2 2
e M E.5b,3% 2 ' 5 2
i c 0 .-
Mrd
CT
'
2 . 2 5 em e,,p
4 FL t:-
? m 3 = m ,
2 % 6
U * S! - z *
g 2 . s
, B E
U T % U U Ia 2
3 x 2 z . 5 ; $ U
F E 0
Gi30
+ - . E OE +
I@
p
U
2
'5
$ %
%
2
B
ks!
b E t . 5 c
N .-
-
sa.
MATING SYSTEM PARAMETERS 935
1
f q
0 1
1
lo
1lo
FIGURE 1.-Joint distribution of 1000 estimates of outcrossing rate (2) and pollen pool allele frequency
(a)
obtained following the application of the estimation procedure, based on the mixed mating model, to family arrays produced via the mixed mating model simulation method (a-c) and the one-pollen parent simulation method (d-f ). True values of t are 0.8 (a and d), 0.5 (b and e) and 0.2 (c and f). True value of p = 0.5.As before, we compare the mean estimates of mating system parameters from each of the replications, with the true values used to simulate the family data. When the one-pollen parent model method of simulation was employed, deviations between expected and observed parameter estimates were small (Ta- bles 6 and
7).
When the mixed mating model method of simulation was em- ployed, however, estimates of the outcrossing rate were biased slightly down- ward for populations with unequal allele frequencies, and estimates of the frequency of heterozygote paternal parents were biased upward, sometimes approaching unity. Estimates of maternal parent frequencies were also influ- enced, but were less sensitive to violation of the assumption of correlated mating events (Table7).
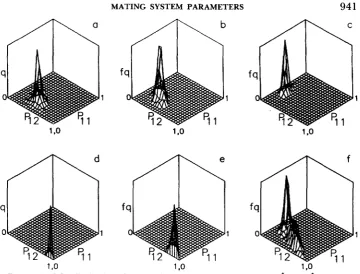
Normal distributions of outcrossing rate estimates and maternal parent frequencies based on family data simulated via either method were observed (data not shown). T h e distributions of the estimates of paternal parent frequencies, however, were strongly influenced by violation of the as- sumption of correlated mating events. This can be seen by comparing Figure 4a-c (no violation) with Figure 4d-f (violation). Even for relatively low out- crossing rates of t = 0.2, these latter distributions departed from normality. Similar distributions of paternal frequencies were observed in simulations in- volving asymmetrical gene frequencies; they are not illustrated here.936 D. J. SCHOEN AND M. T. CLEGG
1
.o
1 .o
1 .o
FIGURE ‘L.-Joint distribution of estimated outcrossing rate ( 2 ) and pollen pool allele frequency
( j ) ;IS for Figure 1 , except that the true value of p = 0.6.
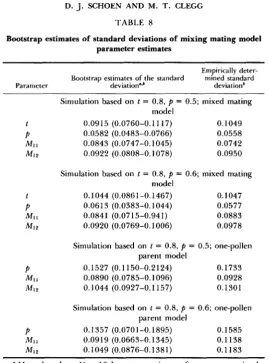
simulated population samples based on two parameter combinations (t = 0.8,
p
= 0.5, 0.6). For each set of parameter combinations, the mean and range of the ten bootstrap estimates were compared with the standard deviation of 1000 sets of parameter estimates obtained in simulations (the latter we call the empirically determined standard deviation) (Table 8). The bootstrap estimates of the standard deviations usually agreed well with the empirically determined values when there were no model violations. One exception was the estimate of the standard deviation of MI1 whenp
= 0.5 (Table 8). It is also notable that, when model assumptions were violated, both empirical and bootstrap standard deviations off
and8
increased in magnitude two- to threefold. T h e inflation of the bootstrap standard deviations, while not as large as that of the empirical standard deviations, may be useful in detecting violation of model assumptions. Similar results were obtained with one-pollen parent model pa- rameter estimates (data not shown).Estimates of mating system parameters in two plant populations: Table 9 gives the results of application of the mating system parameter estimation procedures to family data from 1. purpurea. When maternal genotype frequen- cies were not estimated, t* and
8
were as obtained by SCHOEN and CLECG (1985)MATING SYSTEM PARAMETERS 937
FIGURE J.-Joint distribution of 1000 estimates of maternal parent genotype frequencies ($11
and M12) obtained following the application of an estimation procedure, based on the mixed mating
model, to family arrays produced via the mixed mating model simulation method (a-c) and the one-pollen parent simulation method (d-f). True values of t and p are the same as in Figure 1. True values of MI1 and MI2 are based on inbreeding equilibrium.
those obtained when the MV were assumed to be known. T h e deviation was qualitatively similar to that seen in the Monte Carlo simulations when families simulated via the one-pollen parent model method were submitted to the mixed mating model estimation procedure; i.e.,
Z
was smaller, whereasj
was larger in comparison to the situation with known M,, and variances of the parameter estimates were increased. This result is expected when there is correlation between mating events within families, as appears to have existed in this I. purpurea population (SCHOEN 1985).On the other hand, for P. glauca, the mixed mating model gave estimates closest to those obtained when the M , were assumed to be known (Table 9). When the one-pollen parent model was applied to these data, the deviation was qualitatively similar to that observed in the Monte Carlo simulations where families simulated via the mixed mating model method were submitted to estimBtion procedure based on the one-pollen parent model; i.e.,
Z
was smaller and P I * approached unity. T h e result is expected, as previous work has dem- onstrated that mating events in the population of P. glauca were not correlated within families (SCHOEN 1985).DISCUSSION
938 D. J. SCHOEN AND M. T. CLECG TABLE 5
Deviation between the true and estimated numbers of mating events involving heterozygous paternal parents
~ ~~ ~~
Percentage deviation in the numbers of mating
True value True value events involving hetero-
of P o f t Simulation method used zygous paternal parents
0.5
0.5
0.5
0.6
0.6
0.6
0.8
0.8
0.8
0.8
0.5
0.2
0.8
0.5
0 .2
0.8
0.5
0 .2
Mixing mating One-pollen parent Mixing mating One-pollen parent Mixed mating One-pollen parent
Mixed mating One-pollen parent Mixed mating One-pollen parent Mixed mating One-pollen parent
Mixed mating One-pollen parent Mixed mating One-pollen parent Mixed mating One-pollen parent
+115.32
+157.80 +0.97 +133.79 -0.08 -1.80
+116.39 +2.06 +153.54 +1.84
+
128.61 -0.24+176.24 +1.76 +182.16 +1.06 +110.79 +1.87
One-pollen parent model was assumed in the calculation of the true classification. Estimated numbers were obtained from the means of N =
1000 simulation-estimation trials.
pollen genes within single maternal parent families can lead to errors of esti- mation. Specifically: (1) the estimation of parental genotype frequencies from family data is subject to large biases;
(2)
the estimated outcrossing and pollen pool frequencies may be biased; (3) the estimated parameters may have large variances; and(4)
the distribution of estimates may depart from normality. Biased estimates of mating system parameters are seen especially when out- crossing rates are large. In most cases, as the outcrossing rate is reduced, the models converge, and it matters little which estimation model is used. T h e extent of this convergence is a function of sample size. In the simulations reported above, based on five progeny per family, when t = 0.2 there is only a small chance that correlated outcrossing events will be detected in a family, in comparison to the situation where t = 0.8. With increasing family size, however, the chances of detecting correlated outcrossing events are increased, even for small t.MATING SYSTEM PARAMETERS 939 ? 0 s s 9 9
eo
m m m w m w
191
3s
9 9
os
a ? ?
0 0
0 0 0
0 0
P - w f - - - w
0 0 0
Ah
0 0
9 9
ss
0 0 2 0 0 0
G A
9 9
ss
c ? ? ?
GG 0 r . W we4
0 0
C O W b
m m c o
0 0 0
0 0
2 s
-1
m * * m r . c o
0 0 0
990? ss 9 9 0 0 0 0 owom
0 0 0
0 0 0
Y Y
Y ? Y - w
0 0
9 9
os
? Q ? ?
* a W
v m m
0 0 0
h h
- 0 4
0 0
9 9
so
e e 4 m ?9?
G A
9 9
ss o m Q. CQ??
w w -
0 0 0
0 0
0 - v
0 0 0
6 s sc
9 9 9 9
ss
os
0 0 0 0o w m - w e ? w w w o w 0
0 0 0 0 0 0
191 I??
--
cow s s
9 9 9 9
ss zs
o o w r . w m Y p 1 9 ? ' 4 ?
0 0 0 0
w o w - m *
0 0 0 G O O
--
hh0 0 0 0
9 9 9 9
ss
os
0" O b *0 0 0 0 0 0
o o o o m 0
" F f " " 1 c v
S G A A
9 9 9 9
0s ss
0 0 0 0
0 r . W C O - -
m e 4 w - 0 -
mwco m w e 4
0 0 0 0 0 0
0 0 0 0 0 0
Ah
- w AG
9 9 9 9
co so
0 0 0 0o o r . o w w
0 0 0 0 0 0
o m 0 G W O
Y ? Y Y c ? Y
G G G G
9 9 9 9
ss
os
Y E ? " ? ?
G G GG
99 9 9
zo so
0 0 0 0
* * w * - Y e ?
" c o w m w
0 0 0 0 0 0
0 0 0 0
b f - w w m w
99? W " ' 4
G A AG
9 9 9 9
ss s s
w w m m - m
0 0 0 0 0 0
0 0 0 0
o m 0 o w -
0 - 0 0 G ~ O
e ? ?
0 0 0 0 0 0
=?
3
'4
-
MATING SYSTEM PARAMETERS 94 1
1 1
1
100
FIGURE 4.-Joint distribution of estimated paternal genotype frequencies (@I I and @ l 2 ) obtained
following application of the estimation procedure, based on the one-pollen parent model, to family arrays produced via the one-pollen parent simulation method (a-c) and the mixed mating model simulation method (d-f). True values of t and p are the same as in Figure 1 . True values of P l l
and PI2 are based on inbreeding equilibrium.
use several biological criteria to evaluate the potential utility of estimation procedures based on either the one-pollen parent or the mixed mating models. If information is available on the mode of pollen transfer (wind vs. insect- mediated), flowering phenology and the manner in which seed families were assembled (from one or many fruits per plant), then a choice of model may be easier to make. For instance, in a large plant population, where few flowers per plant are produced at any time, or where fruits are single-seeded, or where the pollen vector is wind, the seed families are unlikely to involve a single paternal parent genotype. T h e mixed mating model is likely to be most suitable in this instance. However, when seeds are collected from single multiseeded fruits, where insect pollinators are involved and are known to provide only minimal pollen carryover, families may involve one or few pollen parent gen- otypes. Here, the one-pollen parent model may be more appropriate. T h e results obtained with I. purpurea and P. glauca support these notions.
942 D. J. SCHOEN AND M. T. CLEGG TABLE 8
Bootstrap estimates of standard deviations of mixing mating model parameter estimates
Empirically deter- mined standard Bootstrap estiniates of the standard
Parameter deviation".b deviationb
Simulation based on t = 0.8, p = 0.5; mixed mating model
0.0915 (0.0760-0.11 17) 0.1049 0.0582 (0.0483-0.0766) 0.0558 0.0843 (0.0747-0.1045) 0.0742 0.0922 (0.0808-0.1078) 0.0950
Simulation based on t = 0.8, p = 0.6; mixed mating model
0.1044 (0.0861-0.1467) 0.1047 0.061 3 (0.0383-0.1044) 0.0577 0.0841 (0.0715-0.941) 0.0883 0.0920 (0.0769-0.1006) 0.0978
Simulation based on t = 0.8, p = 0.5; one-pollen parent model
0.1527 (0.1 150-0.2124) 0.1733 0.0890 (0.0785-0.1096) 0.0928 0.1044 (0.0927-0.1 157) 0.1301
Simulation based on t = 0.8, p = 0.6; one-pollen parent model
0.1357 (0.0701-0.1895) 0.1585 0.0919 (0.0663-0.1345) 0.1138 0.1049 (0.0876-0.1381) 0.1183
Mean based on N = 10 bootstrap estimates from separate simula-
n = 50 families, R = 5 progeny per family. tions. Range is given in parentheses.
assumption of the one-pollen parent model. Further work is needed to deter- mine the best criteria for choosing the most appropriate model.
1 E!
e
&
d
* E cf
t
a M E cs9
.Y I
E
3
.UE
3
10*
*”3
*3a
m 2 P L 05 4
a -S E
U9
.I a91
E .If
g
6 23
I
3
2
1
M E .U IY,
0
4
E!33
w
MATING SYSTEM PARAMETERS 943
c c
rr, m - ?-
- g g
g
.- % “ Q , I’-
tl
2 2
...
#
* ‘ < I . a
w:
C n C
c
v 3. v c -
- %
E , < g
F;; h.-
3
g g
g
c
2 8
i
g f s
90
E ’ ?
z
2 2
U
-
-
0 G - 8 a c -
- ( o o.(
( o m
h 9 . 2 . h
2
.s
q 3 z g
2 $ ‘ Q m $g . c 0
$E .e 5
2 0
3
2
E r.t.
.E %
3
8
5
v mQ mr. c1
“ 2
E
-$
G ? s
$ 2
*g
“4tl
% g
e
2 %
g-,&$-g
5
z.;2
3
M
*
a ‘ ; $ b z g;
k
2
8
v 0 D I l p -2
2
.g.jEy 0 %-
2 g &p
g3$3
g g a e c J
IIggIIII
2 . -
M V
‘S 8
Y Y c? e 2 IC h h
I n - e
M
- 0 v
.e 0 .“ 2 E
.-
h%)53
r . 5
2
5
2
8
3
g %
8$ ‘ Q G g
.- M‘ 4 . 5 E g
8
si 8 N v a m &
v
-
E
.r
E
-$1:
2
-
m.-
$:&o “ 8 * v o E 2 . 2
- 2 . 2
E -$ 3 0 c u s
C c J TJ 0 a“c?
.- o 2 D ~ n a v
a 0 1
h O Q . S ~ Q ~ m 2 p
944 D. J. SCHOEN AND M. T . CLEGG
Since we have demonstrated that reliable mating system estimation may require information on the degree of correlation among the pollen parent genotypes of a family, it is advisable to employ, whenever possible, procedures which are less dependent on these model assumptions, such as those which do not involve estimation of maternal genotype frequencies or which use multilo- cus data (BROWN, MATHESON and ELDRIDGE 1975; RITLAND and JAIN 1981;
S H A W , KAHLER and ALLARD 1981; ELLSTRAND 1984).
This research was supported by National Science Foundation grant BSR 841831 to M. T . C. ;ind by operating and strategic grants from the Natural Sciences and Engineering Research Council of Canada to D.J.S. We thank BRYAN EPPERSON, KERMIT RITLAND and STEVEN STEWART for their helpful comments on the manuscript. CREMILDA DIAS provided excellent technical assistance.
LITERATURE CITED
I\I.I.ARD, R. W., 1960
BROWN, A. H. D., 1979
Principles of plant breeding. John Wiley Be Sons, New York.
Enzyme polymorphism in plant populations. Theor. Pop. Biol. 15: 1-
Estimation of the mating system in open-pollinated
Estimation of the mating system
Genetic control of allozyme variants in mature tissues of 42.
BROWN, A. H. D. and R. W. ALLARD, 1970
maize populations using isozyme polymorphisms. Genetics 72: 489-503.
of Eucalyptus obliqua L. Herit using allozyme polymorphisms. Aust. J. Bot. 23: 931-949.
white spruce trees. J. Hered. 75: 34-40.
BROWN, A. H. D., A. C. MATHESON and K. G. ELDRIDGE, 1975
CHELIAK, W. M. and J. A. PITEL, 1984
CI.ECC, M. T., 1980
Cr.ec:c, M. T., 1983
Measuring plant mating systems. Bioscience 3 0 814-818.
Measurement and detection of selection. In: Isozymes in Plant Genetics and Breeding, Part A , Edited by S. D. TANKSLEY and T. J. ORTON. Elsevier/North-Holland, Am- sterda ni.
Estimation of life cycle components of
(:I.EGG, M. T., A. L. KAHLER and R. W. ALLARD, 1978
EFRON, B., 1979
EI.ISTRAND, N., 1984
selection in an experimental plant population. Genetics 8 9 765-792.
Bootstrap methods: another look at the jackknife. Ann. Statist. 7: 1-26.
Multiple paternity within fruits of the wild radish, Raphanus sativus. Am.
Quantitative studies of the mating system in two sympatric species of Ipomoea
(Convolvulaceae). Genetica 57: 93-98.
Plant breeding studies in leguminous forage crops. I. Natural crossbreeding in winter beans. J. Agric. Sci. 41: 371-378.
Relationship between life-history char- acteristics and electrophoretically detectable genetic variation in plants. Annu. Rev. Ecol. Syst. 10: 173-200.
HAYMAN, B. I., 1953 Mixed selfing and random outcrossing when homozygotes are at a disad-
I.KVIN, D. A., 1977 T h e organization of genetic variability in Phlox drummondii. Evolution 31:
LOVELFSS, M. D. and J. L. HAMRICK, 1984 Ecological determinants of genetic structure in plant
KITLAND, K. and S. JAIN, 1981 A model for the estimation of outcrossing rate and gene fre- Nat. 123: 819-828.
ENNOS, R. A., 1981
I;YFE, J. L. and N. T. J. BAILEY, 1951
HAMRICK, J . L, Y. B. LINHART and J. B. MITTON, 1979
vantage. Heredity 7: 185-192.
477-494.
populations. Annu. Rev. Ecol. Syst. 15: 65-95.
MATING SYSTEM PARAMETERS 945
SCHOEN, D. J., 1985
SCHOEN, D. J. and M. T. CLEGG, 1984
SCHOEN, D. J. and M. T. CLEGG, 1985
SHAW, D. V., A. K. KAHLER and R. W. ALLARD, 1981
Correlation between classes of mating events in two experimental plant
Estimation of mating system parameters when outcrossing
The influence of flower color on outcrossing rate and
A multilocus estimator of mating system
Communicating editor: B. S. WEIR populations. Heredity 5 5 38 1-385.
events are correlated. Proc. Natl. Acad. Sci. USA 81: 5258-5262.
male reproductive success in Ipomoea purpurea. Evolution 3 9 1242-1 249.