International Journal of Innovative Research in Science, Engineering and Technology
An ISO 3297: 2007 Certified Organization Volume 6, Special Issue 5, March 2017
National Conference on Advanced Computing, Communication and Electrical Systems - (NCACCES'17)
24th - 25th March 2017
Organized by
C. H. Mohammed Koya
KMEA Engineering College, Kerala- 683561, India
A Study on Different Types of FR IQA
Classification
Anju V Abraham1, Dr. Priya S2
.M Tech Student, Department of Computer Engineering, Model Engineering College, Ernakulam, India1
Professor, Department of Computer Engineering, Model Engineering College, Ernakulam, India2
ABSTRACT: Image quality assessment plays a vital role in various image processing applications such as medical imaging technology, forensic Science, fake biometric detection, image enhancement, etc. Image quality is defined as the integrated set of perceptions of the overall degree of excellence of the image. Image quality assessment methods are used to evaluate image quality, its measure the degradation in digital images in order to improve the quality of the image for various image processing applications. There are two types of IQA methods, the subjective methods are costly process and it needs experts for evaluating image quality. Nowadays many objective IQA methods image are available for finding the quality of images. These are mainly based on the properties of human visual system. In this paper give an idea about different image quality assessment and the three different types of full reference image quality assessment classifications.
KEYWORDS: Image quality assessment, FR IQA, Classification, Human visual system, Reduced-reference IQA,
No-reference IQA.
I
INTRODUCTION
Digital images are subject to a wide different types of distortions during acquisition, processing, compression, storage, transmission and reproduction, any of which may result in a degradation of image quality. So IQA methods are used to measure the degradation in digital images in order to improve the quality of the image for various image processing applications.[1]. Image quality assessment methods are two types Subjective method and Objective method [1], For applications in which images are ultimately to be viewed by human beings, the only correct method of quantifying visual image quality is through subjective evaluation. In subjective evaluation, human being to evaluate the quality of an image. But the main drawbacks of subjective methods are time consuming and expensive, because subjective results are obtained through experiments with many observers and also it cannot be incorporated into real time applications such as image compression, and transmission , etc. Their results depend heavily on the subjects physical conditions and emotional state and also depends on other factors such as display device and lighting conditions of subjective experiments. In order to overcomes the disadvantages of subjective methods, objective image quality assessment is to develop. It is a quantitative measures that can automatically predict perceived image quality.
Three main categories of the objective IQA are No-reference image quality assessment (NR-IQA)[5], Reduced-reference image quality assessment (RR-IQA)[4] and Full-Reduced-reference image quality assessment(FR-IQA). In NR-IQA[5]the reference image is not available and the quality evaluation is solely based on the test image. In RR-IQA [4], the reference image is not fully accessible. Instead, a number of features are extracted from the reference image. In FR-IQA metrics, the perfect quality reference image is fully available for quality prediction process. In this paper explain briefly about the three types of FR IQA classification .
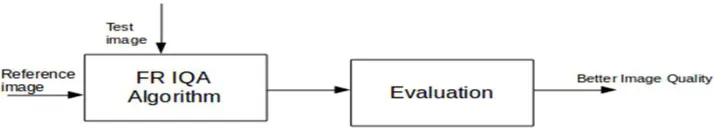
II FULL-REFERENCE IMAGE QUALITY ASSESSMENT (FR-IQA)
Fig 1: Full Reference Image Quality Assessment
Now a days there are lot of IQA metrics available for the image quality evaluation process. In order to evaluate the performance of existing IQA metrics , you need to conduct experiments on the available image databases. Normally, in such a database, there are a lot of reference images and for each image, there exit several distorted images. For each distorted image, there are several subjective evaluations by human beings. In order to evaluate an IQA metric, you need to compute objective scores for all the distorted images in the database using the selected IQA metric. Then, you can evaluate kinds of correlations between the obtained objective scores and the subjective scores provided by the database. By such a process, the performance of IQA metrics [2]can be used. The Pearson linear correlation coefficient (PLCC), Spearman rank order correlation coefficient (SROCC), Kendall rank correlation coefficient (KRCC), are performance IQA metrics used for the evaluation . The Pearson’s correlation coefficient is the linear interdependence between two variables or two sets of data. It is defined as the covariance of the two variables divided by the product of their standard deviations. It measures the linear dependence between two variables, the resulting value having range [-1, 1] where 1 is total positive correlation and -1 is total negative correlation and 0 indicates there is no correlation among the variables. The spearmans correlation coefficient is used when both the variables are in ranked order data type called ordinal data. The maximum value of correlation coefficient is 1 which gives the maximum positive association between the ranks and the minimum value is -1 which denotes a maximum negative association between the ranks. The value of zero shows no association between the ranks. Similar to Spearman rank correlation coefficient, Kendall rank correlation coefficient is to evaluate the association between two ordinal (two ranked variables ) variables.
III FR IQA CLASSIFICATION
In this section we are briefly describing about three types of FR IQA classification. This section we are divided into three parts and each part describe briefly about one type of FR IQA classification.
A. FR IQA CLASSIFICATION-1
Here Full reference image quality measures could be classified into six classes of objective image assessment measures.
a. Pixel difference-based measures.
Pixel difference-based measures are easy to evaluate. The mean square error (MSE)[6], Signal-to-noise ratio (SNR), Peak signal-to-noise ratio (PSNR)[2], etc, are pixel difference based IQA method. The MSE[6] denotes the power of the distortion, it is the mean squared difference between the original image and distorted image. MSE is often converted to peak-signal-to-noise ratio (PSNR). PSNR is the ratio of the maximum possible power of a signal and power of distortion. PSNR is calculated by.
PSNR = 10log(D^2/MSE) (1)
where D denotes the dynamic range of pixel intensities, e.g., for an 8 bits/pixel image we have D =255
b. Correlation-based measures.
Correlation is used to measure the relationship between two digital images. In image quality assessment, correlation of pixels is used as a measure of the image quality. The commonly used correlation function is Normalized Cross-Correlation(NXC), Mean Angle Similarity (MAS), Mean Angle Magnitude Similarity (MAMS), etc.
c. Edge-based measure.
The edge based measure is based on the measure of the displacement of edge positions or ther consistency are used to find the image quality for the entire image. The other measure used is edge stability measure , It is defined as the consistency, of edge across different scales in both the original and coded images. The third measure is the surface properties, i.e. mean and Gaussian curvatures .
d. Spectral distance-based measures.
e. Context-based measures.
In context based measures instead of comparing pixels in original and distorted images, pixel neighborhoods are compared against each other by finding the multidimensional context probability for measuring image quality.
f. Human Visual System-based measures (HVS).
Image quality here is measured by the human eye . Humans usually use contrast, color, and frequency changes in their measures. HVS features that commonly used in IQM are contrast sensitivity function (CSF) and contrast masking. The contrast sensitivity function is the human perception is more sensitive to lower spatial frequency than higher one.In some IQM models implement CSF as the low-pass filter, and some implement CSF as weighting factors for subbands after frequency decomposition. The Contrast masking is the reduction in the visibility degree of one image component by the presence. Examples of human visual system based metrics are Universal Image Quality Index (UIQI)[14] , structural Similarity Index (SSIM), etc.
B. FR IQA CLASSIFICATION- 2
Here Full reference image quality measures could be classified into four classes of objective image assessment measures.
a. Mathematically based metrics.
In this approach, the image is regarded as a 2D signal, and the similarity or dissimilarity between the reference and the distorted images is calculated as distortion (or quality) measure. The mathematically based metrics are Mean Square Error (MSE), PSNR, etc.
b.Low-level metrics
Metrics classified as low-level based metrics simulates the low level features of the HVS, such as CSFs or masking. However, most of these metrics to use a mathematically based metric. The Low-level based metrics, which take into account the visibility of the distortions using for example Contrast Sensitivity Functions (CSFs).
c.High-level metrics.
High-level based metrics are based on the idea that our HVS is adapted to extract information or structures from the image. The Structural Similarity (SSIM), which is based on structural content, or the Visual Image Fidelity(VIF) ,which is based on scene statistics, are examples of metrics in this group.
d.Other metrics.
Other metrics, which are either based on other strategies or combine two or more of the above groups. One example is the Visual Signal-to-Noise Ratio (VSNR) , which takes into account both low and mid-level visual properties, and the final stage incorporates a mathematically based metric.
C. FR IQA CLASSIFICATION-3
Here Full reference image quality measures could be classified into three classes of objective image assessment measures.
a. Visibility characteristic based methods.
some Visibility characteristic based method is listed below
Perceptual Image Distortion (PID)
A Perceptual distortion measure that predicts image integrity far better than mean-squared error. This perceptual distortion measure is based on a model of human visual processing that fitting empirical measurements of the psychophysics of spatial pattern detection.[15].
Noise Quality Index (NQM)
The NQM, which is based on Pelis contrast pyramid, by using the features like Variation in contrast sensitivity according to distance, spatial frequency, image dimensions, Variation in the local luminance , Contrast interaction between spatial frequencies and the Contrast masking effects.
Maximum Difference (MD)
MD is the maximum of the error signal that is difference between the reference signal and test image. Maximum Difference can calculate by,
MD = MAX |X(I,J )-Y(I,J ) | (2)
Average Difference (AD)
x(i,j) y(i,j) MN
1
AD (3)
Visual Signal-to-Noise Ratio (VSNR)
The visual signal-to-noise ratio(VSNR), is a two-stage approach. In the first stage, contrast thresholds for
detection of distortions in the presence of natural images are computed. If the distortions are below the threshold value, the distorted image is deemed to be of perfect visual fidelity and no further analysis is required. If the distortions are above the threshold, a second stage is applied which operates based on the low-level visual property of perceived contrast, and the mid-level visual characteristic of global precedence. These two properties are modeled as Euclidean distances in distortion-contrast space of a multiscale wavelet decomposition, and VSNR is computed based on a simple linear sum of these distances.
Most Apparent Distortion (MAD)
MAD operates by using both a detection-based model and an appearance-based model[13]. For detection, we employ a simple spatial-domain model of local visual masking, which takes into account the contrast sensitivity function, and luminance and contrast masking with distortion-type-specific adjustments. Detection-based quality is then estimated based on the mean-squared error between the original and distorted images .
b. Contrast/structure feature based methods
Following metrics are based on constrast and structural based metrics
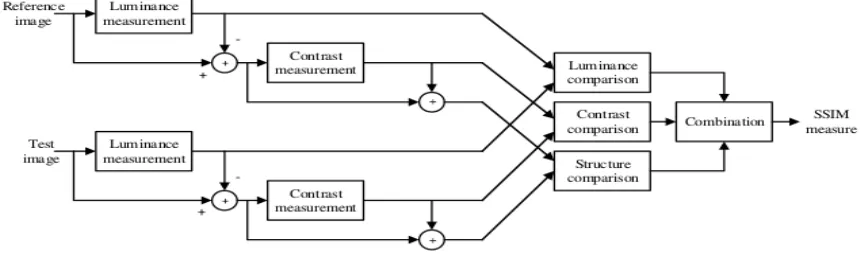
SSIM
The structural similarity index is a method for measuring the similarity between two images. It compares two images using information about luminous,contrast and structure. The SSIM metric is designed to improve on traditiona methods like PSNR and MSE and this is calculated on various windows of an image.
Fig 2: SSIM block diagram
Multiscale SSIM (M-SSIM)
In multiscale SSIM the image is decomposed in to different scales. The overall SSIM evaluation is obtained by combining the measurement at different scales [12].
Information content weighted SSIM (IW-SSIM)
Information content weighted structural similarity measure (IW-SSIM)[9] is an extension of the structural similarity (SSIM) index by taking the idea of information content weighted pooling. The same idea can also be applied to PSNR, leading to an information content weighted PSNR (IW-PSNR). By combining information content weighting with multiscale SSIM, information content weighted SSIM measure (IW-SSIM) is defined.
Gradient Similarity based method (GSM).
improved evaluation of quality assessment; called Gradient-based Structural Similarity(GSSIM) is proposed. It is based on the edge information as information of most significant image structure . The Gradient Similarity based FR-IQA method (GSM) which uses four directional high-pass filters to capture the change of contrast/structural information in images.
Riesz transform based Feature Similarity (RF-SIM)
The Riesz transform based Feature Similarity (RF-SIM) [8] index by adopting first and second-order Riesz transforms to characterize local structures in images. visual quality scores are calculated only for edge pixels obtained by the Canny edge operator. This is made based on an assumption that edge information is essential for evaluating visual quality scores. The RFSIM is computed by comparing Riesz transform features at pivotall locations between the reference image and a distorted image. The 1st order and 2nd order Riesz transforms are used because inorder to extract several types of low-level features of image effectively and efficiently in a unified theoretic framework.
Feature Similarity (FSIM)
Here a phase congruency and a gradient magnitude are used as core features to characterize perceived visual quality. The phase congruency and gradient magnitude are calculated by log-scaled values of Gabor filtered coefficients and the Scharr gradient operator , respectively. The FSIM index[7] is designed for grayscale images or the luminance components of color images.
Visual Saliency-induced Index (VSI)
The Visual saliency (VS) [3] has been widely studied by psychologists, neurobiologists, and computer scientists during the last decade to investigate, which areas of an image will attract the most attention of the human visual system. First, VS is used as a feature when computing the local quality map of the distorted image. Second, when pooling the quality score, VS is employed as a weighting function to reflect the importance of a local region
Perceptual-fidelity Aware Mean Square Error (PAMSE)
The Perceptual-fidelity Aware Mean Square Error (PAMSE) is a very simple perceptual distortion metric, The PAMSE is calculated by Gaussian smoothened residuals between two images
Gradient Magnitude Similarity Deviation (GMSD)
A very fast FR-IQA method, called GMSD (Gradient Magnitude Similarity Deviation). This is established based on an assumption that image gradients are more vulnerable to image distortions and different local structures in distorted images from different degrees of degradations.
c. Internal brain-mechanism based methods
Internal brain-mechanism based metrics are listed below
Visual Information Fidelity (VIF)
Ratio between the total information ideally extracted by the brain from the whole distorted image and the total information conveyed within the complete reference image
Information fidelity criterion index (IFC)
Given a statistical model for the source and the distortion (channel), the obvious information fidelity criterion[11] is the mutual information between the source and the distorted images.
IV.CONCLUSION
REFERENCES
[1] Sejal Patil , Shubha Sheelvant , “Survey on Image Quality Assessment Techniques”, International Journal of Science and Research (IJSR),Volume 4 Issue 7, July 2015.
[2] Raman Gupta, Dipti Bansal, Charanjit Singh,”A Survey on various objective Image Quality Assessment Techniques”, International Journal of Engineering and Technical Research (IJETR) ISSN: 2321-0869, Volume-2, Issue-7, July 2014.
[3] Y. Niu, M. Kyan, L. Ma, A. Beghdadi, and S. Krishnan, "A visual saliency modulated just noticeable distortion profile for image watermarking," in European Signal Processing Conf., 2011.
[4] Z. Wang and A. C. Bovik, "Reduced-and no-reference image quality assessment: the natural scene statistic model approach," in IEEE Signal Processing Magazine, vol. 28, Nov. 2011, pp. 29-40.
[5] R. Ferzli and L. J. Karam, "A no-reference objective image sharpness metric based on the notion of just noticeable blur (JNB)," IEEE Trans. Image Processing, vol. 18, pp. 717- 728, April 2009.
[6] Wang. Z, Bovik. A. C., Mean squared error: love it or leave it? A new look at signal fidelity measures, IEEE Signal Process. Mag. 26 (1) (2009) 98-117.
[7] L. Zhang, L. Zhang, X. Mou, and D. Zhang, “FSIM: a feature similarity index for image quality assessment,” IEEE Trans. IP, vol. 20, pp. 2378-2386, 2011.
[8] L. Zhang, L. Zhang, and X. Mou, “RFSIM: a feature based image quality assessment metric using Riesz transforms,”ICIP’10, pp. 321-324, 2010.
[9] Z. Wang and Q. Li, “Information content weighting for perceptual image quality assessment,” IEEE Trans. IP, vol. 20, pp. 1185-1198, 2011. [10] D.M. Chandler and S.S. Hemami, “VSNR: a wavelet-based visual signal-to-noise ratio for natural images,” IEEE Trans. IP, vol. 16, pp.
2284-2298, 2007.
[11] H.R. Sheikh, A.C. Bovik, and G. de Veciana, “An information fidelity criterion for image quality assessment using natural scene statistics,” IEEE Trans. IP, vol. 14, pp. 2117-2128, 2005.
[12] Z. Wang, E.P. Simoncelli, and A.C. Bovik, “Multi-scale structural similarity for image quality assessment,” ACSSC’03, pp. 1398-1402, 2003. [13] E.C. Larson and D.M. Chandler, “Most apparent distortion: full-reference image quality assessment and the role of strategy,” J. Electr.
Imaging, vol. 19, pp. 001006:1-21, 2010.
[14] Wang Z. &Bovik A. C., “A universal image quality index”, IEEE Signal Processing Letters, Vol. 9, No. 3, 2002.