www.pharmascholars.com
113
Original Article
CODEN: IJPNL6
A STABILITY INDICATING METHOD FOR ESTIMATION OF TAPENTADOL IN
BULK AND IN FORMULATIONS
Renu Chadha
a,*, Alka Bali
a, Gulshan Bansal
ba
University Institute of Pharmaceutical Sciences, UGC Center of Advanced Study, Panjab
University, Chandigarh,160014, India.
b
Department of Pharmaceutical Sciences and Drug Research, Punjabi University, Patiala
147002, Punjab, India.
*Corresponding author e-mail:
[email protected]
Received on: 27-02-2016; Revised on: 16-03-2016; Accepted on: 28-03-2016
ABSTRACT
An isocratic stability-indicating reversed phase liquid chromatography (RP-HPLC-UV) method for quantitative determination of tapentadol HCl has been developed and validated as per the ICH guidelines. Tapentadol HCl and the tablet formulation were subjected to forced decomposition conditions of hydrolysis, oxidation, photolysis and thermal stress, as per ICH guidelines. Thermal, photostability, accelerated and real time stability testing was carried out with the marketed tablet formulation of the drug. An Inertsil ® C-18 (250 mm x 4.6 mm, 5µ) column was used to
carry out the chromatographic analysis. The mobile phase composed of methanol-water (pH 2.5 with formic acid of the aqueous part) (35:65 %v/v) (flow rate 1.0 mL/min; Detection wavelength 254 nm). The drug was found to be extremely stable and there was no degradation under various stressor conditions. Excellent linearity was observed in the range of 0.05–5.0 μg/mL (r 2= 0.9998). The limits of detection (LOD) and quantification (LOQ) were 0.0008
and 0.0024 µg/mL respectively. The proposed method gave good recovery of the drug in the tablet formulation as well (100.8 % in control and 98.53 - 99.73 % in the various stability samples).
Keywords: Tapentadol, stress degradation, chromatographic, stability indicating, validation
INTRODUCTION
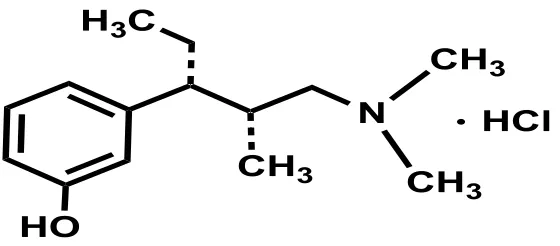
Tapentadol HCl (TPL) ((-)3-[(1R,2R)-3-(dimethylamino-1-ethyl-2-methylpropyl]-phenol hydrochloride) (trade names: Nucynta® by Janssen
Pharmaceuticals; Palexia® ; Grünenthal Ltd. and
Tapal® by MSN Labs) (Figure 1) is an oral centrally
acting analgesic approved by the US FDA available as immediate release as well as controlled release formulations (tablets) for the treatment of moderate to severe pain in adults which is responsive only to opioid analgesics like oxycodone and morphine [1]. The drug is a unique opioid agonist which acts on µ opioid receptors and is also a noradrenaline reuptake inhibitor (NRI) [2-4]. The drug stability test guideline Q1A (R2) issued by the International Conference on
Harmonization [5] and WHO [6] suggest that inherent stability characteristics of a drug need to be studied under prescribed stress conditions. Tapentadol is not official in any pharmacopoeia and very few chromatographic methods are reported in literature for its analytical determination. The first reports included the determination of tapentadol and its metabolite N-desmethyltapentadol in oral and urine specimens by LC-MSn [7] and UPLC- MSn [8].
Subsequently, quantification of tapentadol was reported in canine plasma by Giorgim et al [9]. RP-HPLC methods for determination of tapentadol in bulk and pharmaceutical formulations have also been reported [10-11]. Spectrophotometric [12-13] and stability indicating spectrofluorometric methods [14] have been reported for determination of tapentadol in
International Journal of Pharmacy
www.pharmascholars.com
114
bulk and pharmaceutical formulations. Two methods based on derivative spectrophotometry were recently reported for tapentadol [13,15]. Hence, the present study was designed to develop a stability indicating RP-HPLC method for the estimation of tapentadol HCl. The proposed method was validated with respect to various parameters outlined in the ICH guideline Q2(R1) (ICH, 2005) [16], i.e., specificity, linearity, accuracy, precision, limits of detection and quantification, system suitability parameters, ruggedness and robustness.
MATERIALS AND METHODS
Chemicals and Reagents
Tapentadol HCl was graciously provided as gift sample by Ind-Swift Laboratories Ltd. N.A.C. Manimajra, Chandigarh. All chemicals and materials were of analytical grade and were purchased from Qualigens fine chemicals, Mumbai, India. Tapal®
tablets (label amount 75 mg tapentadol HCl per tablet, MSN Laboratories Private Limited, Batch no. BT1410103A) were purchased from the market. Sodium hydroxide, hydrochloric acid and hydrogen peroxide (30%) were purchased from Loba chemical Pvt. Ltd (Mumbai, India). Methanol (MeOH), formic acid and acetonitrile (ACN) of HPLC grade were purchased from Merck Specialist Pvt Ltd, Mumbai (India). HPLC grade water obtained from Bio-Age Direct Ultra water purification system (Bio-Age Equipment & Services, Mohali, India) was used for preparation of all reagents and solutions.
Instrumentation
LC–UV Analysis
The HPLC system consisted of binary pumps (515), UV detector and Rheodyne manual injector (Waters, Milfored, MA, USA) and the data was acquired and processed in Empower 3 software. An Inertsil® C-18
(250 mm x 4.6 mm, 5µ) column was employed for the chromatographic separation of the drug and degradation products. The mobile phase was filtered through nylon membrane (0.45μm) using Millipore filter assembly and was degassed using transonic sonicator bath (570/H ELMA, Germany). The chemicals were weighed on Afcoset electronic balance (ER-18 2A, Bombay Burmah trading Corp, Ltd., India). The pH of the buffer solution was adjusted using Digital pH meter (Sarthak, Panchkula, India). Laboratory centrifuge model CM 12 Plus (REMI) was employed for serum preparation and for processing of spiked serum samples.
Forced Degradation Studies
The samples for hydrolytic and thermal stress testing were generated using high precision water bath and
hot air oven equipped with digital temperature control capable of controlling temperature within range of ±1 ˚C and ±2 ˚C, respectively (Narang Scientific Works, New Delhi, India). Photo-degradation of the drug was carried out in a photo stability chamber (Rolex Scientific Instruments, Ambala, India) capable of controlling temperature and humidity within range of ±2˚ C and ±5 % RH, respectively. The chamber was equipped with an illumination bank consisting of UV and fluorescent lamps as described in Option 2 made of light source as described in option 2 in the ICH guideline Q1B [17]. The chamber was set at a temperature of 40˚C and 75% RH.
Procedure for Forced Degradation Studies
The drug was subjected to forced degradation under ICH prescribed stress conditions, viz., hydrolysis (acid, base and neutral), oxidation, photolysis and dry heat. Hydrolytic degradation was carried out under acidic, basic and neutral conditions by refluxing the drug in 0.1N HCl, 0.1N NaOH and water respectively (1 mg/mL ) at 85 ◦C for 8 h. Photodegradation studies were carried out at 40 ◦C in a photostability chamber by exposing the solid drug in the form of a thin layer in a petri-dish and also drug solutions prepared in 0.1 N HCl, 0.1 N NaOH and H2O (0.1 mg/mL) to a total
dose of 1.2 million lux h of fluorescent and 200 Wh/m2 of UV-A illumination by placing them at
about 9" from the light sources for 14 days. A parallel set of the drug solutions was stored in dark at the same temperature to serve as control. Oxidative degradation was carried out at room temperature in 30% hydrogen peroxide (H2O2) solution for 24 h
using drug concentration of 1 mg/mL. Thermal degradation studies were carried out by exposing the drug (5 mg) sealed in amber coloured glass vials (5 mL), to a temperature of 50 ◦C for 31 days after which the vials were removed, cooled to room temperature and their contents dissolved in methanol.
HPLC-UV method
The UV absorption spectrum of the drug showed its absorption maximum (λmax) at 273 nm and hence, it
was selected as detection wavelength for the HPLC method. The drug was chromatographed on C18 (250 mm x 4.0 mm; 5μ, Inertsil®) column by a mobile
phase composed of methanol and water (pH 2.5 with formic acid of aqueous part) (35:65 % v/v) at a flow rate of 1.0 mL/min. A Nucleosil® C8 (8mm×4.6mm
i.d., 5 μm) guard column was placed before the analytical column. The injection volume was 20 μL, column temperature was the ambient temperature (30 ± 2 oC).
www.pharmascholars.com
115
standard solution (10 µg/mL). For preparation of degradation samples for HPLC analysis, each degraded drug solution was diluted up to 100 times with methanol. The acid and alkali hydrolyzed solutions were mixed with equal volume of 0.1 N NaOH and 0.1 N HCl, respectively before diluting. For analysis of solid drug exposed to thermal and photolytic degradations, a 1 mg/mL solution of each sample was prepared and diluted up to 100 times with methanol. Each diluted sample was filtered through nylon membrane filter (0.45 μ, 13 mm) before injecting on HPLC.
Validation of the method
The optimized method was validated with respect to various parameters outlined in the ICH guideline Q2(R1) [16]. Linearity was assessed from serial dilutions (n=3) of the standard solution of the drug (10.0 µg/mL) in concentration range of 0.05-5.0 µg/mL (0.05, 0.1, 0.2, 0.5, 1.0, 2.0 and 5.0 µg/mL). Six injections, of three different concentrations (0.05, 0.2 and 2.0 µg/mL), were given on the same day (to determine intra-day precision) and on three consecutive days (to determine inter-day precision). The precision was expressed as % RSD of each calculated concentration of the analyte. Method accuracy was evaluated as percent recovery (n=3) of three different concentrations of TPL (0.05, 0.5, and 2.0 µg/mL) from mixed degraded sample solutions (0.2 µg/mL) and was expressed as the percent recovery of the fortified drug concentration vis-à-vis the unfortified one. Robustness was assessed by carrying out deliberate changes in the method variables including change in detection wavelength, composition of mobile phase, pH of mobile phase, flow rate and column (Kromasil® and Inertsil®) one at
a time and studying their impact on retention time (RT) and recovery of the drug in the test solution
(n=3). Photodiode array detection method was used as an evidence for the specificity of method and to evaluate the homogeneity of the drug peak.
Stability Study of TPL Tablets
The blister pack of TPL tablets (Tapal®, MSN Labs;
label claim of 75 mg TPL per tablet) was exposed to accelerated conditions of 40 °C/75% RH in the photostability chamber for 6 months. Another blister pack was kept in the dark under similar conditions for 6 months. For thermal stability, the tablets were placed in the hot air oven maintained at 50 °C for 31 days. The real time stability samples were generated by keeping the tablets at room temperature (30 ± 5 °C) for 12 months. A control sample was kept in refrigerator at 4 °C. Each stability sample was analyzed by the validated HPLC method to quantify TPL concentration. The packed tablets from each
stability condition were processed as follows: Ten tablets were weighed, crushed, powdered and a quantity of the powder equivalent to 10 mg of the drug was suspended in 8 mL of methanol in a 10 mL measuring flask. The contents were sonicated for 10 min, allowed to cool to room temperature and the volume was adjusted with methanol. The resultant stock solution was diluted with methanol to a drug concentration of 10 µg/mL. The sample solutions were filtered through a 0.45 µm membrane and analyzed (n=6) for the drug content using the validated HPLC method.
RESULTS AND DISCUSSION
The LC-UV chromatograms of the standard solution of the drug and the various stress degraded solutions are shown in Figure 2. The drug was eluted as a symmetrical sharp peak at 7.80 min. under the employed chromatographic conditions.
Degradation behaviour
Tapentadol HCl was found to be extremely stable under all the employed stressor conditions of acid/alkaline/neutral hydrolysis, oxidative, thermal and photolytic stress and no degradation products were found to be generated in any case.
Method Validation
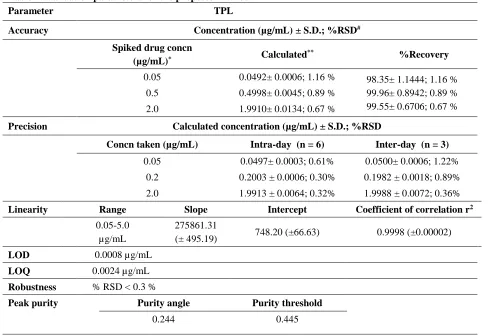
The method was validated for parameters such as linearity, precision, accuracy, specificity and robustness and the results are listed in Table 1. A strictly linear relation was observed between the peak area and the concentration of TPL in the concentration range of 0.05-5.0 µg/mL. The calibration plot (Figure 3) was described by the equation y = 275861.31 x + 748.20 (n = 3; r2 =
0.9998).
www.pharmascholars.com
116
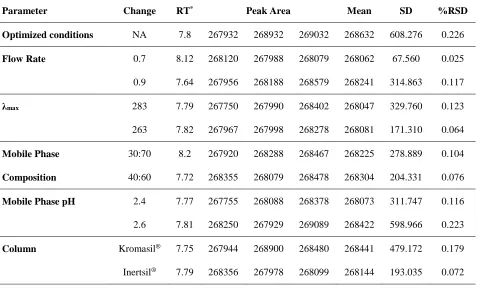
The method was found tobe sufficiently robust as no significant changes in resolution, retention time, area and asymmetry of peak were observed after deliberate changes in the method variables including the detection wavelength, composition of mobile
phase, pH of mobile phase, flow rate and column (Table 3). The % RSD for mean area corresponding to all variable conditions was found to be less than 0.3 %. The drug peak homogeneity (method specificity) was assessed by photodiode array detection and the purity angle for the drug peak was found to be less than the purity threshold, indicating the absence of any co-eluting peak.
Stability testing and assay on marketed formulation (Tapentadol HCl tablets)
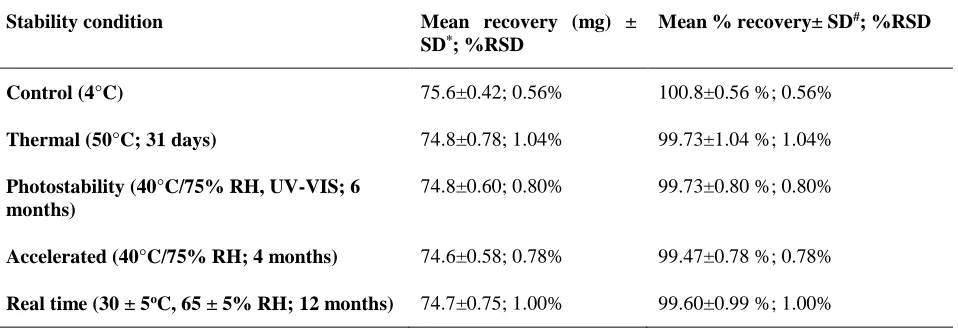
The recovery results of the stability testing for TPL in the marketed formulation (tablet sample) under thermal, photostability, accelerated and real time stability conditions by the proposed method are shown in Table 4. Figure 4 shows the HPLC-UV chromatogram of the stability testing sample of tapentadol HCl (TPL) tablets. The percentage recovery in the control group was found to be 100.8 % (amount per tablet 75.6 mg) which was very close to the label claim (75 mg TPL per tablet). The percentage recovery in the various stability samples was found to be 98.53– 99.73 % (amount per tablet
found to be 73.9 – 74.8 mg) displaying a close agreement between the results obtained by the proposed methods and the label claim. This showed the suitability of the proposed method for assay of tapentadol in the marketed tablet formulation without any interference from the tablet excipients or routine degradation products.
CONCLUSION
In the present study, a simple, sensitive and reproducible stability-indicating HPLC-UV method was developed for determination of tapentadol hydrochloride. The method was validated for various parameters as per the ICH guidelines. Forced degradation study on tapentadol HCl indicated its stability to degradation under hydrolytic, thermal, oxidative and photolytic conditions. The proposed method was applicable to the determination of the drug in tablet formulation as well and the percentage recoveries were found to be 100.8 % in control and 98.53 - 99.73 % in the various stability samples.
Acknowledgements
We sincerely thank Ind-Swift Laboratories Ltd. N.A.C. Manimajra, Chandigarh for graciously providing us pure samples of tapentadol HCl.
www.pharmascholars.com
117
Figure 2: LC-UV chromatograms of standard solution of tapentadol (A) and the drug subjected to various degradation conditions, viz., Hydrolysis in 0.1 M HCl (B); hydrolysis in 0.1N NaOH (C); hydrolysis in water (D); photolysis in 0.1N HCl (E); photolysis in 0.1N NaOH (F); photolysis in water (G); hydrolysis in 0.1N HCl in dark (H); hydrolysis in 0.1N NaOH in dark (I); hydrolysis in water in dark (J); Oxidation in H2O2 (K);
www.pharmascholars.com
118
Figure 3: Calibration plot for tapentadol HCl with the proposed method.
Figure 4:HPLC-UV chromatogram of stability testing sample of tapentadol (TPL) tablets.
Table 1: Validation parameters for the proposed method.
Parameter TPL
Accuracy Concentration (µg/mL)± S.D.; %RSD#
Spiked drug concn
(µg/mL)* Calculated
** %Recovery
0.05 0.0492± 0.0006; 1.16 % 98.35± 1.1444; 1.16 % 99.96± 0.8942; 0.89 % 99.55± 0.6706; 0.67 % 0.5 0.4998± 0.0045; 0.89 %
2.0 1.9910± 0.0134; 0.67 %
Precision Calculated concentration (µg/mL) ± S.D.; %RSD
Concn taken (µg/mL) Intra-day (n = 6) Inter-day (n = 3)
0.05 0.0497± 0.0003; 0.61% 0.0500± 0.0006; 1.22% 0.2 0.2003 ± 0.0006; 0.30% 0.1982 ± 0.0018; 0.89% 2.0 1.9913 ± 0.0064; 0.32% 1.9988 ± 0.0072; 0.36%
Linearity Range Slope Intercept Coefficient of correlation r2
0.05-5.0 µg/mL
275861.31
(± 495.19) 748.20 (±66.63) 0.9998 (±0.00002)
LOD 0.0008 µg/mL
LOQ 0.0024 µg/mL
Robustness % RSD < 0.3 %
Peak purity Purity angle Purity threshold
www.pharmascholars.com
119
Table 2. Recovery in LOD and LOQ studies.
Injection No.
Peak areas for drug concentration
0.0008 µg/mL* 0.0024 µg/mL**
1 270 6543
2 262 6402
3 256 6478
4 264 6432
5 267 6489
6 265 6512
Mean 264 6476
S.D. 4.7749 51.7107
% RSD 1.81 0.80
*LOD value **LOQ value
Table 3.Robustness of the proposed method.
Parameter Change RT* Peak Area Mean SD %RSD
Optimized conditions NA 7.8 267932 268932 269032 268632 608.276 0.226
Flow Rate 0.7 8.12 268120 267988 268079 268062 67.560 0.025
0.9 7.64 267956 268188 268579 268241 314.863 0.117
λmax 283 7.79 267750 267990 268402 268047 329.760 0.123
263 7.82 267967 267998 268278 268081 171.310 0.064
Mobile Phase 30:70 8.2 267920 268288 268467 268225 278.889 0.104
Composition 40:60 7.72 268355 268079 268478 268304 204.331 0.076
Mobile Phase pH 2.4 7.77 267755 268088 268378 268073 311.747 0.116
2.6 7.81 268250 267929 269089 268422 598.966 0.223
Column Kromasil® 7.75 267944 268900 268480 268441 479.172 0.179
Inertsil® 7.79 268356 267978 268099 268144 193.035 0.072
www.pharmascholars.com
120
Table 4:Stability testing data of tapentadol tablets.
Stability condition Mean recovery (mg) ±
SD*; %RSD
Mean % recovery± SD#; %RSD
Control (4°C) 75.6±0.42; 0.56% 100.8±0.56 %; 0.56%
Thermal (50°C; 31 days) 74.8±0.78; 1.04% 99.73±1.04 %; 1.04%
Photostability (40°C/75% RH, UV-VIS; 6 months)
74.8±0.60; 0.80% 99.73±0.80 %; 0.80%
Accelerated (40°C/75% RH; 4 months) 74.6±0.58; 0.78% 99.47±0.78 %; 0.78%
Real time (30 ± 5oC, 65 ± 5% RH; 12 months) 74.7±0.75; 1.00% 99.60±0.99 %; 1.00%
*Calculated as mean of six measurements (n=6).
# Calculated as100xSD/mean. REFERENCES
1. Tayal G, Grewal A, Mittal R, Bhatia N. J Anaes Clin Pharmacol, 2009; 25(4): 463-6.
2. Tzschentke TM, Jahnel U, Kogel B, Englberger W, De Vry J, Schiene K, Okamoto A, Upmalis D, Weber H, Lange C, Stegmann JU, Kleinert R. Drugs Today (Barc), 2009; 45: 483–96.
3. Wade WE, Spruill WJ. Clin Ther, 2009; 31(12): 2804-18.
4. Sadeghi M, Tzschentke TM, Christie MJ. Br J Pharmacol, 2015; 172(2): 460-8.
5. ICH, Q1A (R2) Stability Testing of New Drug Substances and Products, International Conference on Harmonization, IFPMA, Geneva, 2003.
6. WHO, Draft stability testing of active pharmaceutical ingredients and pharmaceutical products, World Health Organization, Geneva, 2007.
7. Coulter C, Taruc M, Tuyay J, Moore C. J Anal Toxicol, 2010; 34(4): 458–63.
8. Bourland JA, Collins AA, Chester SA, Ramachandran S, Backer RC. J Anal Toxicol, 2010; 34: 450–7. 9. Giorgim M, Meizler A, Mills PC. J Pharm Biomed Anal, 2012; 67-68: 148-53.
10. Ramanaiah G, Ramachandran D, Srinivas G, Jayapal G, Rao P, Srilakshmi V. Int J Chem Anal Sci, 2012; 4(7): 391-6.
11. Gandhi J, Shah NJ, Lumbhani AN. Pharma Sci Monitor, 2012; 3(4): 2440-53. 12. Pavan AB, Mahesh J, Vijayalakshmi M. J Chem Pharm Sci, 2012; 5(2): 52-5.
13. Mobrouk MM, El-Fatatry HM, Hammad SF, Mohamed AA. J Appl Pharm Sci, 2013; 3(3): 122-5.
14. Panikumar DA, Haripriya A, Sirisha N, Raju YV, Sunitha G, Rao AV. J Appl Pharm, 2013; 5(3): 794-804. 15. Babu BS, Pavan KK, Nataraj K, Ramakrishna N. Der Pharm Lett, 2013; 5(2): 377-82.
16. ICH, Q2(R1), Validation of analytical procedures: Text and methodology, in: International Conference on Harmonisation, IFPMA, Geneva, 2005.