Copyright © 2018 (Yilang Peng and John B. Jemmott III). Licensed under the Creative Commons Attribution Non-commercial No Derivatives (by-nc-nd). Available at http://ijoc.org.
Feast for the Eyes:
Effects of Food Perceptions and Computer Vision Features
on Food Photo Popularity
YILANG PENG
1JOHN B. JEMMOTT III
University of Pennsylvania, USA
The widely circulated food photos online have become an important part of our visual culture. Combining human ratings of food characteristics and computational analysis of visual aesthetics, we examined what contributed to the aesthetic appeal of a diversity of food photographs (N = 300) and likes and comments they received in an artificial newsfeed from participants (N = 399). The results revealed that people tended to like and share images containing tasty foods. Both healthy and unhealthy foods were able to gain likes. Aesthetic appeal and specific visual features, such as the use of arousing colors and different components of visual complexity, also influenced the popularity of food images. This work demonstrates the potential of applying computer vision methods in visual analysis, offers insights into image virality, and provides practical guidelines for communicating healthy eating.
Keywords: food, virality, computer vision, visual aesthetics, health communication
With the rise of camera phones and photo-sharing networks, people are constantly sharing food images online (Hu, Manikonda, & Kambhampati, 2014). The hashtag #foodporn, which emphasizes the glamorized visual presentation of food, has spread across the globe (Mejova, Abbar, & Haddadi, 2016). What people say about food on social media has also been linked to health outcomes such as obesity and access to healthy food (Culotta, 2014).
Understanding what impacts food images’ popularity should provide significant implications for health communication about dietary choices in today’s digital media environment. Our diets are heavily affected by mediated representations of food, ranging from real-world television commercials to food pictures in functional MRI studies (Spence, Okajima, Cheok, Petit, & Michel, 2015). Studies frequently show that even exposure to appealing food imagery can evoke hunger and desire and can influence
Yilang Peng: [email protected]
John B. Jemmott III: [email protected] Date submitted: 2016‒12‒01
consumption choices (Jansen, Mulkens, & Jansen, 2010; Simmons, Martin, & Barsalou, 2005). Moreover, the impacts of messages in online social networks can be amplified by social contagion (Bond et al., 2012). The prevalence of food images on social media, accompanied by popularity indicators such as the number of likes, might further shape our perceptions of social norms about food choices.
In addition, visual content plays an increasingly important role in today’s communication landscape. Camera phones and image-based social media, such as Instagram and Snapchat, have gained widespread popularity, particularly among the younger generation (Lenhart, 2015). Widely used in health communication (King, Jensen, Davis, & Carcioppolo, 2014; Lazard, Dudo, Dennis, Ewald, & Love, 2016; McWhirter & Hoffman-Goetz, 2014), visual content can provide concrete evidence; enhance attention, comprehension, and memory; and influence health behaviors (Houts, Doak, Doak, & Loscalzo, 2006). Scholars have also made successful attempts to use visually appealing pictures to encourage consumption of healthy food (Jansen et al., 2010). Despite the prevalence and effects of visual content, previous research on content virality has focused on textual materials (Berger & Milkman, 2012; Martin-Biggers, Beluska, Quick, Tursi, & Byrd-Bredbenner, 2015). Although studies have shown that the use of visuals, compared with plain text, can increase the diffusion of messages (Guerini, Staiano, & Albanese, 2013), the effects of specific visual features are relatively understudied. To design effective messages in today’s networked, visually oriented media environment, we need a better understanding of what specific features make a piece of visual content popular.
At last, traditional methods of image analysis often require a significant amount of human labor and rely on coders’ subjective interpretation (Hu et al., 2014; Lazard et al., 2016). Although communication research has benefited substantially from computational content analysis, it has mostly been limited to linguistic data (Kim, 2015). To advance our analysis of visual materials, we draw inspiration from an emerging field: computer vision. Computer vision aims to imitate the human vision’s ability to perceive and understand visuals, and is being applied in a variety of contexts, such as medical imaging, facial recognition, and automated driving (Szeliski, 2010). Particularly, one line of computer vision research has used computationally coded visual features to predict a variety of outcomes, ranging from images’ visual appeal (Ke, Tang, & Jing, 2006; Schifanella, Redi, & Aiello, 2015; Totti et al., 2014) to users’ personality (Liu, Preotiuc-Pietro, Samani, Moghaddam, & Ungar, 2016). However, these studies often include dozens of predictors and focus on the accuracy of their prediction models, paying less attention to the theoretical links between visual features and outcomes. Therefore, although computer vision may provide researchers with efficient, convenient, and standardized tools for analyzing visual data, it is also important for us to contextualize this method in the field of communication research.
Conceptualizing and Defining Concepts Relevant to Virality
Despite the extensive research on virality, scholars divide on its definition (Alhabash & McAlister, 2015). In a straightforward form, virality can be defined as “the number of people who accessed a given content in a given time interval” (Guerini, Strapparava, & Özbal, 2011, p. 507). Yet, other scholars have proposed more expanded views on virality. For example, Alhabash and McAlister (2015) defined virality in terms of not only reach (e.g., views, shares), but also users’ affective (e.g., likes, dislikes) and cognitive responses (e.g., comments) to messages. Guerini et al. (2011) also argued that virality is a complex phenomenon that incorporates different facets of audience reaction, such as spreading, appreciation, and positive and negative comments. In contrast, others have argued for a narrower definition that incorporates the spreading mechanisms of virality; resembling a biological virus, viral content should spread by a sequence of interpersonal contagions instead of a large broadcast from a single source (Goel, Anderson, Hofman, & Watts, 2015).
In this study, we designed a newsfeed with food pictures embedded and instructed respondents to interact with it. We looked at two prevailing metrics, likes and comments, which are two predominant ways of content engagement on popular photo-sharing platforms such as Instagram. In addition, participants’ sharing intentions were also measured later. In response to the conflicting views and terminology on virality in previous research, we use popularity to broadly refer to the extent to which a piece of content can attract audience reactions such as views, likes, comments, and shares while limiting the use of virality only for sharing.
Food Characteristics and Popularity
Previous research has examined a variety of message features that contribute to content popularity, to name a few, information utility, emotional valence and evocativeness, novelty, exemplification, and controversiality (Berger & Milkman, 2012; Cappella et al., 2015; Kim, 2015). Scholars have also identified several mechanisms underlying people’s viral behaviors. For example, Berger (2014) summarized five psychological functions for sharing information—impression management, emotion regulation, information acquisition, social bonding, and persuasion—and linked each function to content features such as being entertaining, useful, or arousing.
Tastiness and Fillingness
Previous research has frequently demonstrated that arousal, either physiological or psychological, can lead people to share content with others (Berger, 2014). For example, Berger and Milkman (2012) found that online news articles that evoked high-arousal emotions (e.g., awe and anger) were more likely to be e-mailed by viewers than articles that conveyed deactivating emotions (e.g., sadness). Studies on visual content also showed that images that elicited sexual arousal or arousing emotions such as amazement and ecstasy were more likely to go viral on photo-sharing platforms than images that evoked deactivating feelings such as serenity or fatigue (Deza & Parikh, 2015; Gelli, Uricchio, Bertini, Del Bimbo, & Chang, 2015).
Both tastiness and fillingness—the expected capability to satisfy hunger—are important dimensions of food perceptions (Oakes, 2006). As seeking food is an important function of our brain, energy-rich foods that are high in sugar or fat are usually linked to pleasure and reward (Spence et al., 2015). Hypothetically, this association may have served as an evolutionary advantage that drove our ancestors to maximize their caloric intake in the prehistoric world that lacked stable food resources (Spence et al., 2015). Empirical research has shown that tasty and high-calorie food evokes high arousal; even mere exposure to appetitive food images can increase the brain’s metabolism and activate the reward system (Simmons et al., 2005; Wang et al., 2004). Therefore, we predicted the following:
H1: Photos of foods that are perceived as more tasty are more popular.
H2: Photos of foods that are perceived as more filling are more popular.
Healthiness
Public health practitioners are particularly concerned with the healthiness of food that people consume. On one hand, unhealthy food pictures should easily go viral, as healthiness and tastiness are usually negatively associated: Portraying a food item as healthier could lead people to expect it to be less tasty and less enjoyable (Raghunathan et al., 2006). On the other hand, people share things to show personal beliefs and values and to maintain a positive self-image (Berger, 2014). As health is widely viewed positively (Smith & Wallston, 1992), people might engage with healthy food photographs to affirm their values or enhance their self-image.
RQ1: How does perceived healthiness impact the popularity of food photos?
At last, novelty and expensiveness of foods could also increase popularity as novelty can attract attention and people tend to share novel and expensive things for positive self-presentation (Berger, 2014; Kim, 2015; Martin-Biggers et al., 2015). Given that the impacts of these two features have been frequently documented and are not directly linked to health communication, we included them as control variables.
Visual Features and Popularity
Our perceptions of food are impacted by not only food itself but also its visual presentation (Spence, Levitan, Shankar, & Zampini, 2010; Spence et al., 2015; Wadhera & Capaldi-Phillips, 2014). Therefore, visual features should additionally impact the popularity of food images.
Aesthetic Appeal
People often rate food with a visual display of higher aesthetic appeal—in other words, more beautiful and more visually pleasing—more favorably. For example, participants were willing to pay more for a dish and evaluated it more positively if its elements were artistically arranged like a Kandinsky abstract painting (Michel et al., 2014). In addition, restaurants across the globe are also making more “Instagrammable” dishes with enhanced composition and colors, so customers can take more eye-pleasing food pictures for social media (Whittle, 2017). Regarding general visual content, Schifanella et al. (2015) showed that subjective ratings of an image’s aesthetic appeal from crowd workers could well predict the number of favorites an image received on Flickr. Therefore, we expected the following:
H3: Food photos with higher subjective aesthetic appeal are more likely to be popular.
In addition, visual features related to aesthetic appeal should also influence image popularity.
Colorfulness
As evolutionary biologists have hypothesized, primates developed the trichromatic color vision as an adaption to efficiently detect food in the environment, such as red fruits against green foliage (Spence et al., 2015). Colored images or highly saturated images also evoke stronger emotions, are perceived more favorably, and are shared more on social media than monochrome images or photos of low saturation (Bakhshi & Gilbert, 2015; Detenber, Simons, & Reiss, 2000; Guerini et al., 2013; Peng, 2017). Therefore, we made the following hypothesis:
Arousing and Relaxing Colors
Colors differ in their salience, emotion, and meanings (Elliot & Maier, 2014). According to the color-in-context theory, the effects and meanings of colors depend on the context in which colors are perceived (Elliot & Maier, 2014). For instance, the same color of red might provoke either positive mental associations (e.g., a flush that signals sexual interest) that lead to approach behaviors or negative associations (e.g., grading in red ink) that lead to avoidance (Elliot & Maier, 2014; Richards & Fink, 2017). In the context of food, as many fruits ripen and sweeten with their colors transitioning from green to red, some evolutionary psychologists have argued that we might still connect red to sweetness and green to sourness (Spence et al., 2010). Empirical studies have shown that red-colored solutions were perceived as sweeter than green or uncolored ones (Wadhera & Capaldi-Phillips, 2014), popcorn was rated as sweeter when served in red bowls than in white bowls (Harrar, Piqueras-Fiszman, & Spence, 2011), food products in red packages were judged sweeter than those in green and blue packages (Huang & Lu, 2015). As hypothesized before, perceived tastiness can increase popularity. Therefore, images with more red should outperform images with more green or blue.
In addition, research has shown that red and orange are often linked to arousal, warmth, and salience, whereas green and blue are associated with relaxation and coolness (Elliot & Maier, 2014). As psychological arousal drives attention and sharing (Berger, 2014), we should expect that the use of arousing colors (e.g., red, orange) instead of relaxing colors (e.g., blue, green) would increase popularity. Analysis of social media data found that on Pinterest, images that contained more red, pink, and purple were shared more than photos that featured predominantly black, green, blue, or yellow (Bakhshi & Gilbert, 2015), and on Flickr, warmer photo filters attracted more views and comments for photographs than cooler filters (Bakhshi, Shamma, Kennedy, & Gilbert, 2015). Combining these two lines of research, we proposed the following hypothesis:
H5: The use of arousing colors (e.g., red, orange), instead of relaxing colors (e.g., green, blue), increases (a) aesthetic appeal and (b) popularity of food images.
Rule of Thirds
In addition to color, composition also affects images’ aesthetic appeal (Amirshahi, Hayn-Leichsenring, Denzler, & Redies, 2014). One common guideline in photography is the rule of thirds: With a picture divided into nine equal parts by two horizontal lines and two vertical lines, subjects of interest are best placed along these lines or in their intersections (Amirshahi et al., 2014; Ke et al., 2006). In one empirical study, participants’ judgment of whether an image followed the rule of thirds could predict their aesthetic ratings of the image (Amirshahi et al., 2014). We thus hypothesized the following:
Visual Complexity
Visual complexity, which deals with the amount of visual variations, also influences our perception of images, but its impacts are often mixed (Lazard & Mackert, 2014). First, in photography, a good picture should focus on a central theme and clearly convey the message, eliminating other elements that may distract or overwhelm viewers (Langford & Bilissi, 2011). In an experiment, using white space in advertisements led viewers to evaluate a brand more positively (Pracejus, Olsen, & O’Guinn, 2006). However, too-simple stimuli may lack the sufficient information to stimulate and attract people, decreasing attention and engagement (Geissler, Zinkhan, & Watson, 2006). Therefore, a curvilinear relationship has often—although not consistently—surfaced in previous studies, as participants tend to respond more favorably to visual content of moderate complexity than too-simple and too-complicated stimuli (Berlyne, 1970; Geissler et al., 2006).
Visual complexity may also contain multiple dimensions. Some scholars have distinguished the quantity and the variety of elements from the complexity in elements’ spatial organization and order (Deng & Poole, 2010). Others have differentiated between feature complexity—the density of perceptual features—and design complexity, which incorporates design principles such as the irregularity and dissimilarity of objects (Lazard et al., 2016; Lazard & Mackert, 2014; Pieters, Wedel, & Batra, 2010). Other factors have also been proposed, for example, the complexity in objects’ surfaces and textures (Ramanarayanan, Bala, Ferwerda, & Walter, 2008) and the variety in images’ color (Purchase, Freeman, & Hamer, 2012). In this study, food images differ in the amount of details and objects in the frame, the spatial arrange of these elements, and the variety in their color (Deng & Poole, 2010; Ke et al., 2006). We proposed the following research question:
RQ2: How do different types of visual complexity impact food photos’ aesthetic appeal and popularity?
Method
Stimuli
Participants
We recruited 401 participants from the crowdsourcing platform Amazon Mechanical Turk. Research has shown that this platform can provide scholars with comparably good-quality data from participants who are more demographically diverse than traditional convenience samples (Buhrmester, Kwang, & Gosling, 2011). Furthermore, to enhance the quality of our data, we included only participants who (1) were located in the United States, (2) had at least 50 tasks approved, and (3) had a historical approval rate above 95%. Forced responses were used on key variables to ensure complete responses. Each participant received $0.52 for completing the study.
Two duplicate responses were removed. The sample (N = 399) included 60.7% female, with an average age of 38.9 years (SD = 12.9, range = 19–77 years). Participants also reported their educational level (10.5% some high school or high school graduate, 28.6% some college, 45.6% college degree, 15.3% postgraduate), race (9.8%, 6.8%, and 79.2% identified as African American, Asian/Pacific Islander, and White, respectively)2, weight, height, and social media use. Body mass index (M = 27.04, SD = 7.22) was calculated based on participants’ self-reported weight and height (3.5% underweight, 40.6% normal, 32.8% overweight, 23.1% obese; World Health Organization, n.d.). Regarding social media use, participants reported how frequently they used Facebook, Twitter, Instagram, and Flickr (α = .631, M = 2.84, SD = 1.03) on four 6-point scales (1 = never, 6 = almost all the time).
Procedure
A newsfeed was designed to simulate the experience of browsing on social media, which mixed 15 food photos with 20 nonfood photos. The 15 food photos were randomly selected from the stimuli image set (N = 300). The nonfood photos served as distractions and remained the same for all the participants, including images of architecture, people, landscape, and so forth. In the newsfeed, each photo was accompanied by a like button, a comment button, and a blank bar for participants to write comments (see Figure 1). The images were displayed in a randomized order.
After answering questions about individual characteristics, participants were presented with the newsfeed and instructed to like and comment on the photos as if they were scrolling down a newsfeed on social media. After exiting the newsfeed, each participant rated another batch of 15 food photographs that were randomly selected from the stimuli set. Therefore, each food photo appeared in the newsfeed 19.95 times (SD = 5.56, range = 8–31) and was also rated 19.95 times (SD = 4.38, range = 9–34) on average.
Figure 1. Illustration of the newsfeed posts and participants’ potential interactions with the newsfeed: (a) like and (b) comment. Images by Serge Ouachée/Wikipedia (left); Carol/Flickr (right).
Measures
Participant ratings
Based on previous literature on food perceptions, we listed a series of 5-point semantic differential scales3 for participants to rate the food or drink item in each photo, including tastiness (untasty–tasty, not delicious–delicious; α = .957, M = 3.73, SD = 0.62;4 Werle, Trendel, & Ardito, 2013), fillingness (unlikely to fill me up–likely to fill me up, unlikely to satisfy hunger–likely to satisfy hunger; α = .987, M = 3.28, SD = 0.84; Carels et al., 2007; Oakes, 2006), and healthiness (unhealthy–healthy; M = 2.99, SD = 0.93; Carels et al., 2007; Schuldt, 2013). Participants rated the photograph’s aesthetic appeal on bad quality–good quality and ugly–beautiful (α = .897, M = 3.25, SD = 0.49). Regarding control variables, participants also rated the food’s novelty (conventional–novel and ordinary–unique; α = .958, M = 2.98, SD = 0.75; White, Shen, & Smith, 2002) and estimated its price (“How much do you expect to pay for this food/drink in U.S. dollars?”; M = $7.37, SD = $3.57). We averaged respondents’ ratings for each photo (Milkman & Berger, 2014).5 A confirmatory factor analysis (CFA) showed that these measures were indeed loaded on separate factors.6
3 Participants were shown a list of paired words/phrases, with 1 representing the term on the left and 5 representing the term on the right.
4 Summary statistics of image features (e.g., α, M, SD) were based on image-level analysis (N = 300). 5 Median was used for price estimation, as participants were free to write any amount and might give extreme values.
Popularity
We used whether participant liked and commented on the photo in the newsfeed as two behavioral indicators of popularity. On average, each food image had a 43.3% (SD = 16.5) chance of getting likes and a 9.76% (SD = 6.94) chance of getting comments, which were calculated as the number of likes and comments it received from the participants, divided by the number of times it appeared in the newsfeed. In addition, participants also indicated their intention to share a food photo on a 5-point scale (1 = very unlikely, 5 = very likely): “If I have the same food/drink in the photo, I will take a photo and share it on my social media accounts” (M = 2.35, SD = 0.44). Previous research measuring sharing intention often has asked about people’s willingness to retransmit a message to their acquaintances or share it on social media accounts (Alhabash & McAlister, 2015; Berger, 2014). However, given that photo-taking is a popular way of sharing food images (Hu et al., 2014; Mejova et al., 2016), we instead specifically measured participants’ intention to take and share photos.
Computer vision features
Colorfulness was measured using the formula in Hasler and Süsstrunk (2003). This method calculated an image’s colorfulness based on each pixel’s values in the RGB color model—a system that uses combinations of red, green, and blue to represent different colors—and achieved a correlation of .953 with human ratings of colorfulness in their study.
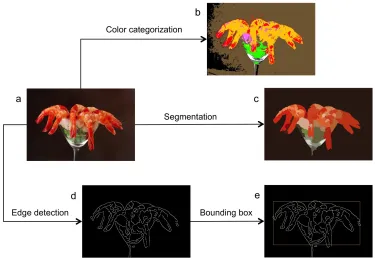
To measure the percentages of arousing and relaxing colors in each image, we categorized each pixel’s value into different basic colors (see Figure 2b) following the work of van de Weijer, Schmid, and Verbeek (2007). This work provided a data set that associated each RGB value with one of the 11 basic colors in the English language (e.g., red, green) based on color-related online images. We created an arousing–relaxing color index by subtracting the percentages of two relaxing colors (green and blue) from two arousing colors (red and orange).
Figure 2. Illustration of (a) original photo, (b) color categorization, (c) segmentation, (d) edge detection, and (e) bounding box.
Six measures were used in total for visual complexity. First, we included a conventionally used measure of visual complexity: the JPEG file size of the image (Pieters et al., 2010). We also segmented the image by grouping pixels of similar color (van der Walt et al., 2014; see Figure 2c).7 A complicated photo with more objects and elements should have more edges and segments, and its edges should be more evenly distributed in the image, compared with a simple image that has only a few elements located in a clean background (Ke et al., 2006). Therefore, we also included the number of segments (Totti et al., 2014); edge density, measured as the area occupied by edges (Purchase et al., 2012); edge distribution, measured as the mean of Euclidean distances among edge points; and the minimum size of a bounding box that contained 95% of the edges (see Figure 2e). At last, we measured color variety by sorting each pixel’s hue value (H in the HSV color space) into different color bins and summing the number of unique hues in an image (Ke et al., 2006).
As visual complexity may be multidimensional (Deng & Poole, 2010; Pieters et al., 2010), we conducted a factor analysis on the six measures. Results suggested that the JPEG size, edge density, and the number of segments were loaded on the same factor (α = .918), which seemed to correspond to the
quantity of different elements and details in images; edge distribution and bounding box size loaded on another factor (α = .937) that seemed to reflect the spatial arrangement of elements—whether they were filling the whole frame or situated within a clean background. These two dimensions were named feature complexity (Pieters et al., 2010) and compositional complexity, respectively.8 Color variety did not load on these two dimensions well (r = .352, p < .001; r = .108, p = .061) and was treated separately in future analysis. A CFA confirmed this three-dimensional structure of visual complexity.9
Two commonly used computer vision features were also included as control variables (Liu et al., 2016): Brightness was measured as the average perceived luminance value (Y in the XYZ color space) of all pixels; contrast was measured as the standard deviation of all pixels’ luminance values.
Results
Similar to prior research that had participants rate a variety of messages and used a combination of message and participant characteristics to predict certain outcomes (Milkman & Berger, 2014), we conducted multiple multilevel regressions (see Table 1). In the regression models, one like, comment, rating of sharing intention, or aesthetic appeal per participant served as one observation. Quadratic terms of healthiness and visual complexity were included as predictors as they might curvilinearly correlate with images’ popularity (Geissler et al., 2006; Sharma & De Choudhury, 2015). Aesthetic appeal as the outcome in Model 1 refers to each participant’s rating of a specific photo, and aesthetic appeal as a predictor in Models 3, 5, and 7 refers to averaged ratings of each photo. Participants’ age, gender, race, education level, social media use, and body mass index were also included as covariates. All models controlled for participant characteristics as fixed effects, with images (N = 300) and participants (N = 399) entered as random effects. Analyses were weighted on how many times a photo was rated (Models 1–3) or appeared in the newsfeed (Models 4–7; Milkman & Berger, 2014).
Food Characteristics and Popularity
In accord with H1, people intended to share (β = .067, p < .001) and liked more (β = .122, p < .001) tasty foods in the newsfeed. However, people did not comment more on tasty foods, contradicting H1. In terms of H2, fillingness increased people’s sharing intention (β = .037, p = .013), but not likes and comments in the newsfeed, offering partial support for H2.
8 As composition is frequently used to describe the spatial arrangement of elements in photography (Langford & Bilissi, 2011), we labeled the second dimension compositional complexity. We did not choose another commonly used term, design complexity, as this concept did not entirely overlap with our measurement (Pieters et al., 2010).
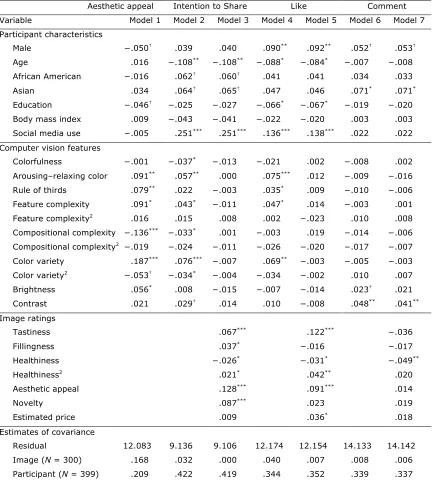
Table 1. Multilevel Regression Results.
Aesthetic appeal Intention to Share Like Comment Variable Model 1 Model 2 Model 3 Model 4 Model 5 Model 6 Model 7 Participant characteristics
Male −.050† .039 .040 .090** .092** .052† .053†
Age .016 −.108** −.108** −.088* −.084* −.007 −.008
African American −.016 .062† .060† .041 .041 .034 .033
Asian .034 .064† .065† .047 .046 .071* .071*
Education −.046† −.025 −.027 −.066* −.067* −.019 −.020
Body mass index .009 −.043 −.041 −.022 −.020 .003 .003
Social media use −.005 .251*** .251*** .136*** .138*** .022 .022 Computer vision features
Colorfulness −.001 −.037* −.013 −.021 .002 −.008 .002
Arousing–relaxing color .091** .057** .000 .075*** .012 −.009 −.016
Rule of thirds .079** .022 −.003 .035* .009 −.010 −.006
Feature complexity .091* .043* −.011 .047* .014 −.003 .001
Feature complexity2 .016 .015 .008 .002 −.023 .010 .008
Compositional complexity −.136*** −.033* .001 −.003 .019 −.014 −.006 Compositional complexity2 −.019 −.024 −.011 −.026 −.020 −.017 −.007 Color variety .187*** .076*** −.007 .069** −.003 −.005 −.003 Color variety2 −.053† −.034* −.004 −.034 −.002 .010 .007
Brightness .056* .008 −.015 −.007 −.014 .023† .021
Contrast .021 .029† .014 .010 −.008 .048** .041**
Image ratings
Tastiness .067*** .122*** −.036
Fillingness .037* −.016 −.017
Healthiness −.026* −.031* −.049**
Healthiness2 .021* .042** .020
Aesthetic appeal .128*** .091*** .014
Novelty .087*** .023 .019
Estimated price .009 .036* .018
Estimates of covariance
Residual 12.083 9.136 9.106 12.174 12.154 14.133 14.142
Image (N = 300) .168 .032 .000 .040 .007 .008 .006
Participant (N = 399) .209 .422 .419 .344 .352 .339 .337
Note. Nobservation
= 5,985. Regression coefficients were standardized. Quadratic terms were labeled with a
superscript 2.
In terms of RQ1, participants intended to share (β = −.026, p = .031), liked (β = −.031, p = .040), and commented on (β = −.049, p = .002) unhealthy foods more. Furthermore, the positive quadratic term of healthiness in predicting likability (β = .042, p = .001) and people’s sharing intention (β = .021, p = .044) suggested that both healthy and unhealthy foods got more likes or were perceived as more sharable than foods in the middle.
Figure 3 illustrates the curvilinear relationship between perceived healthiness and each image’s likelihood of getting likes. Unhealthy foods such as ice cream, milkshakes, and various kinds of cake indeed got more likes. However, some healthy foods also attracted more likes, such as chicken salad and mixed fruit.
Figure 3. Curvilinear relationship between perceived healthiness and likelihood of getting likes (photos of the same food/drink item were aggregated into 1 point).
Visual Features and Popularity
[image:14.612.96.517.269.534.2]We then looked at Models 1, 2, 4, and 6 to examine the effects of computer vision features. It is worth noting that once participants’ ratings were controlled, computer vision features generally had negligible effects on the three popularity indicators (Models 3, 5, and 7). This pattern suggests that participant ratings might have mediated the effects of computer vision features.
Contradicting H4a and H4b, colorfulness did not increase an image’s aesthetic appeal and likelihood of getting likes or comments; it even decreased people’s sharing intention (β = −.037, p = .043), which was in the opposite direction of our hypothesis.10
Consistent with H5a and H5b, people found photos using more arousing colors more aesthetically attractive (β = .091, p = .007), reported higher sharing intention for them (β = .057, p = .002), and liked them more in the newsfeed (β = .075, p < .001), although this feature did not affect comments, partially rejecting H5b.
Consistent with H6a and H6b, adherence to the rule of thirds increased a photo’s aesthetic appeal (β = .079, p = .006) and likability (β = .035, p = .046). However, it did not impact the other two popularity measures, partially rejecting H6b.
Regarding RQ2, the three dimensions of visual complexity showed different patterns. Participants were more likely to rate a photo with high feature complexity as aesthetically appealing (β = .091, p = .013), intended to share it (β = .043, p = .030), and liked it in the newsfeed (β = .047, p = .042), although this feature showed no effects on comments. In contrast, compositional complexity negatively impacted aesthetic appeal (β = −.136, p < .001) and sharing intention (β = −.033, p = .047), without influencing a photo’s likelihood of garnering likes and comments in the newsfeed. Color variety increased aesthetic appeal (β = .187, p < .001), sharing intention (β = .076, p < .001), and likability (β = .069, p = .003), but showed no impacts on images’ likelihood of getting comments. The negative squared term of color variety in predicting aesthetic appeal (β = −.053, p = .091) and sharing intention (β = −.034, p = .042) suggested that photos with extremely varied color did not outperform fairly varied ones.
Discussion
Our study reveals that the popularity of food images is driven by a combination of food characteristics and visual aesthetics. First, based on the results, tasty and unhealthy foods were more likely to go viral, in congruence with today’s prevalence of #foodporn pictures on social media (Mejova et al., 2016). This poses a serious challenge to promoting healthy eating online: Unhealthy foods, mainly
desserts, are shared and liked more, which may subsequently shape our perceptions of norms and in turn strengthen the popularity of unhealthy foods. Nevertheless, certain healthy foods were also able to gain popularity, reversing the association between unhealthiness and likability of foods (see Figure 3).
In addition, visual aesthetics are critical in determining the popularity of food images. First, compared with the intensity of color (colorfulness), the choices and variety of color mattered more. Containing more arousing colors (e.g., red and orange) and using a variety of colors enhanced a food image’s aesthetic appeal and likeability as well as viewers’ sharing intention for it. These results echo previous findings that arousing colors such as red can lead to more favorable perceptions of food (Spence et al., 2010) and increase an image’s chance to become popular online (Bakhshi & Gilbert, 2015). Yet, the impacts of color may depend on specific contexts (Elliot & Maier, 2014). For example, red color in food images might provoke attention and favorable reactions among the audience, but it may also signal danger and alarm (e.g., blood, angry face) that have negative connotations in other contexts.
Similar to prior work (Deng & Poole, 2010; Pieters et al., 2010), this study shows that it is necessary to distinguish among different types of visual complexity. In our results, compositional complexity decreased a photo’s aesthetic appeal. Indeed, consistent with the conventional wisdom in photography (Ke et al., 2006; Langford & Bilissi, 2011), photos following compositional simplicity or the rule of thirds were indeed rated as more aesthetically appealing than those with messy backgrounds or having a dish of food filling the whole frame (see Figure 4). Furthermore, feature complexity and color variety increased a photo’s aesthetic appeal and likability. Participants favored photos with a diversity of elements, textures, and colors, for example, a bowl of mixed fruits of various colors or a plate of chicken salad of varied indigents (see Figure 4, panels 1c and 1d). These findings are in line with some previous studies showing that visual complexity is linked to arousal (Geissler et al., 2006)—which in turn could lead to virality (Berger, 2011)—and people have a variety-seeking tendency for food (Lähteenmäki & Van Trijp, 1995). In contrast, some minimalist photos featuring a prominent object placed in a simple background (usually black and white) were rated as aesthetically appealing, but might seem less evoking or impressive, lacking the visual impacts to stand out in a newsfeed (see Figure 4, panel 2). This seems to echo some previous research suggesting that beautiful images can be less viral if they evoke deactivating emotions such as serenity and calmness (Deza & Parikh, 2015), indicating a divide between “eye-pleasing” and “eye-catching” aesthetics. Future research could further investigate how different aspects of visual complexity and other visual features contribute to images’ pleasantness, arousing potential, and, consequently, virality.
Figure 4. Examples of photos scoring high (top 30%) and low (bottom 30%) on aesthetic appeal and likelihood of getting likes in the newsfeed. Image credits (panel): Carol (1d); Melinda Bardon (3a); Neven Mrgan (3b); Jonas Lönborg (3c); KyleWiTh (3d); Raj Taneja (4b); Mark H. Anbinder (4c); Joel Abroad (4d).
[image:17.612.101.518.146.459.2]Like some previous studies (Alhabash & McAlister, 2015; Berger, 2011), this study also used people’s intention of performing viral behaviors as indicators of their actual behaviors. One recent study showed medium-to-large correlations (r = .337 and r = .372) between participants’ self-reported viral behavioral intention and actual online virality metrics (Scholz et al., 2017). However, more studies are needed to confirm the link between viral behavioral intention measures and online virality metrics.
This study also offers some insight into the potential bias in using social media data to infer people’s dietary patterns (Culotta, 2014; Holmberg et al., 2016; Sharma & De Choudhury, 2015). According to our results, individuals constantly make decisions about what kinds of foods to upload to social media, and this mental process has already been shaped by the same factors that influence online popularity. Sampling on social media, therefore, might be heavily biased toward certain kinds of foods and does not offer a full spectrum of people’s dietary consumption.
Last, this study also demonstrates the promise of using computational methods in analyzing visual content. In this study, the use of computer vision was able to objectively and efficiently retrieve a diversity of message features that might otherwise require a substantial amount of human labor to measure. In addition, this method also allowed us to examine features that were not easy to code, but still meaningfully influenced the outcome, such as the percentages of different colors. Communication researchers might add computer vision to their toolkits and further explore its possibilities in visual analysis.
References
Alhabash, S., & McAlister, A. R. (2015). Redefining virality in less broad strokes: Predicting viral
behavioral intentions from motivations and uses of Facebook and Twitter. New Media & Society, 17(8), 1317–1339.
Amirshahi, S. A., Hayn-Leichsenring, G. U., Denzler, J., & Redies, C. (2014). Evaluating the rule of thirds in photographs and paintings. Art & Perception, 2(1/2), 163–182.
Bakhshi, S., & Gilbert, E. (2015). Red, purple and pink: The colors of diffusion on Pinterest. PLoS One, 10(2), e0117148.
Bakhshi, S., Shamma, D. A., Kennedy, L., & Gilbert, E. (2015). Why we filter our photos and how it impacts engagement. In Proceedings of the International AAAI Conference on Web and Social Media (pp. 12–21). Oxford, UK: Association for the Advancement of Artificial Intelligence.
Berger, J. (2011). Arousal increases social transmission of information. Psychological Science, 22(7), 891– 893.
Berger, J., & Milkman, K. L. (2012). What makes online content viral? Journal of Marketing Research, 49(2), 192–205.
Berlyne, D. E. (1970). Novelty, complexity, and hedonic value. Attention, Perception, & Psychophysics, 8(5), 279–286.
Bond, R. M., Fariss, C. J., Jones, J. J., Kramer, A. D., Marlow, C., Settle, J. E., . . . Fowler, J. H. (2012). A 61-million-person experiment in social influence and political mobilization. Nature, 489(7415), 295–298.
Buhrmester, M., Kwang, T., & Gosling, S. D. (2011). Amazon’s Mechanical Turk: A new source of inexpensive, yet high-quality, data? Perspectives on Psychological Science, 6(1), 3–5.
Cappella, J. N., Kim, H. S., & Albarracín, D. (2015). Selection and transmission processes for information in the emerging media environment: Psychological motives and message characteristics. Media Psychology, 18(3), 396–424.
Carels, R. A., Konrad, K., & Harper, J. (2007). Individual differences in food perceptions and calorie estimation: An examination of dieting status, weight, and gender. Appetite, 49(2), 450–458.
Culotta, A. (2014). Estimating county health statistics with Twitter. In Proceedings of the ACM Conference on Human Factors in Computing Systems (pp. 1335–1344). New York, NY: Association for Computing Machinery.
Deng, L., & Poole, M. S. (2010). Affect in Web interfaces: A study of the impacts of web page visual complexity and order. MIS Quarterly, 34(4), 711–730.
Detenber, B. H., Simons, R. F., & Reiss, J. E. (2000). The emotional significance of color in television presentations. Media Psychology, 2(4), 331–355.
Deza, A., & Parikh, D. (2015). Understanding image virality. In Proceedings of the IEEE Conference on Computer Vision and Pattern Recognition (pp. 1818–1826). Boston, MA: Institute of Electrical and Electronics Engineers.
Elliot, A. J., & Maier, M. A. (2014). Color psychology: Effects of perceiving color on psychological functioning in humans. Annual Review of Psychology, 65, 95–120.
Geissler, G. L., Zinkhan, G. M., & Watson, R. T. (2006). The influence of home page complexity on consumer attention, attitudes, and purchase intent. Journal of Advertising, 35(2), 69–80.
Goel, S., Anderson, A., Hofman, J., & Watts, D. J. (2015). The structural virality of online diffusion. Management Science, 62(1), 180–196.
Guerini, M., Staiano J., & Albanese, D. (2013). Exploring image virality in Google Plus. In Proceedings of the International Conference on Social Computing (pp. 671–678). Washington, DC: Institute of Electrical and Electronics Engineers.
Guerini, M., Strapparava, C., & Özbal, G. (2011). Exploring text virality in social networks. In Proceedings of the International Conference on Weblogs and Social Media (pp. 506–509). Barcelona, Spain: Association for the Advancement of Artificial Intelligence.
Harrar, V., Piqueras-Fiszman, B., & Spence, C. (2011). There’s more to taste in a coloured bowl. Perception, 40(7), 880–882.
Hasler, D., & Süsstrunk, S. E. (2003). Measuring colorfulness in natural images. In Proceedings of SPIE– Human Vision and Electronic Imaging VIII (pp. 87–95). Santa Clara, CA: International Society for Optics and Photonics.
Holmberg, C., Chaplin, J., Hillman, T., & Berg, C. (2016). Adolescents’ presentation of food in social media: An explorative study. Appetite, 99(1), 121–129.
Houts, P. S., Doak, C. C., Doak, L. G., & Loscalzo, M. J. (2006). The role of pictures in improving health communication: A review of research on attention, comprehension, recall, and adherence. Patient Education and Counseling, 61(2), 173–190.
Hu, Y., Manikonda, L., & Kambhampati, S. (2014). What we Instagram: A first analysis of Instagram photo content and user types. In Proceedings of the International Conference on Weblogs and Social Media (pp. 595–598). Ann Arbor, MI: Association for the Advancement of Artificial Intelligence.
Huang, L., & Lu, J. (2015). Eat with your eyes: Package color influences the expectation of food taste and healthiness moderated by external eating. Marketing Management, 25(2), 71–87.
Jansen, E., Mulkens, S., & Jansen, A. (2010). How to promote fruit consumption in children: Visual appeal versus restriction. Appetite, 54(3), 599–602.
Ke, Y., Tang, X., & Jing, F. (2006). The design of high-level features for photo quality assessment. In Proceedings of the IEEE Conference on Computer Vision and Pattern Recognition (pp. 419–426). Washington, DC: Institute of Electrical and Electronics Engineers.
King, A. J., Jensen, J. D., Davis, L. A., & Carcioppolo, N. (2014). Perceived visual informativeness (PVI): Construct and scale development to assess visual information in printed materials. Journal of Health Communication, 19(10), 1099–1115.
Lähteenmäki, L., & Van Trijp, H. C. (1995). Hedonic responses, variety-seeking tendency and expressed variety in sandwich choices. Appetite, 24(2), 139–151.
Langford, M., & Bilissi, E. (2011). Langford’s advanced photography: The guide for aspiring photographers. Oxfordshire, UK: Taylor & Francis.
Lazard, A. J., Dudo, A., Dennis, T., Ewald, M. G., & Love, B. (2016). Making a visual impression (or not): Current design practices of nutritional websites. Health Communication, 32(4), 470–482.
Lazard, A., & Mackert, M. (2014). User evaluations of design complexity: The impact of visual perceptions for effective online health communication. International Journal of Medical Informatics, 83(10), 726–735.
Lenhart, A. (2015, April 9). Teens, social media and technology overview 2015. Retrieved from http://www.pewinternet.org/2015/04/09/teens-social-media-technology-2015/
Liu, L., Preotiuc-Pietro, D., Samani, Z. R., Moghaddam, M. E., & Ungar, L. (2016). Analyzing personality through social media profile picture choice. In Proceedings of the International Conference on Web and Social Media (pp. 211–220). Cologne, Germany: Association for the Advancement of Artificial Intelligence.
Martin-Biggers, J., Beluska, K., Quick, V., Tursi, M., & Byrd-Bredbenner, C. (2015). Cover lines using positive, urgent, unique language entice moms to read health communications. Journal of Health Communication, 20(7), 766–772.
McWhirter, J. E., & Hoffman-Goetz, L. (2014). A systematic review of visual image theory, assessment, and use in skin cancer and tanning research. Journal of Health Communication, 19(6), 738–757.
Mejova, Y., Abbar, S., & Haddadi, H. (2016). Fetishizing food in digital age: #foodporn around the world. In Proceedings of the International Conference on Web and Social Media (pp. 250–258). Cologne, Germany: Association for the Advancement of Artificial Intelligence.
Michel, C., Velasco, C., Gatti, E., & Spence, C. (2014). A taste of Kandinsky: Assessing the influence of the artistic visual presentation of food on the dining experience. Flavour, 3(1), 1–11.
Oakes, M. E. (2006). Filling yet fattening: Stereotypical beliefs about the weight gain potential and satiation of foods. Appetite, 46(2), 224–233.
Peng, Y. (2017). Time travel with one click: Effects of digital filters on perceptions of photographs. In Proceedings of the ACM Conference on Human Factors in Computing Systems (pp. 6000–6011). New York, NY: Association for Computing Machinery.
Pieters, R., Wedel, M., & Batra, R. (2010). The stopping power of advertising: Measures and effects of visual complexity. Journal of Marketing, 74(5), 48–60.
Pracejus, J. W., Olsen, G. D., & O’Guinn, T. C. (2006). How nothing became something: White space, rhetoric, history, and meaning. Journal of Consumer Research, 33(1), 82–90.
Purchase, H., Freeman, E., & Hamer, J. (2012). An exploration of visual complexity. In Proceedings of the International Conference on Diagrammatic Representation and Inference (pp. 200–213). Berlin, Germany: Springer.
Raghunathan, R., Naylor, R. W., & Hoyer, W. D. (2006). The unhealthy = tasty intuition and its effects on taste inferences, enjoyment, and choice of food products. Journal of Marketing, 70(4), 170–184.
Ramanarayanan, G., Bala, K., Ferwerda, J. A., & Walter, B. (2008). Dimensionality of visual complexity in computer graphics scenes. In Proceedings of SPIE, the International Society for Optical
Engineering (pp. 68060E.1–68060E.10). San Jose, CA: Society of Photo-Optical Instrumentation Engineers.
Richards, A. S., & Fink, E. L. (2017). Attributional chromatics: How does the color of written
communication affect interpersonal perceptions? International Journal of Communication, 11, 1683–1704.
Schifanella, R., Redi, M., & Aiello, L. M. (2015). An image is worth more than a thousand favorites: Surfacing the hidden beauty of Flickr pictures. In Proceedings of the International Conference on Web and Social Media (pp. 397–406). Oxford, UK: Association for the Advancement of Artificial Intelligence.
Scholz, C., Baek, E. C., O’Donnell, M. B., Kim, H. S., Cappella, J. N., & Falk, E. B. (2017). A neural model of valuation and information virality. Proceedings of the National Academy of Sciences, 114(11), 2881–2886
Sharma, S. S., & De Choudhury, M. (2015). Measuring and characterizing nutritional information of food and ingestion content in Instagram. In Proceedings of the International Conference on World Wide Web Companion (pp. 115–116). New York, NY: Association for Computing Machinery.
Simmons, W. K., Martin, A., & Barsalou, L. W. (2005). Pictures of appetizing foods activate gustatory cortices for taste and reward. Cerebral Cortex, 15(10), 1602–1608.
Smith, M. S., & Wallston, K. A. (1992). How to measure the value of health. Health Education Research, 7(1), 129–135.
Spence, C., Levitan, C. A., Shankar, M. U., & Zampini, M. (2010). Does food color influence taste and flavor perception in humans? Chemosensory Perception, 3(1), 68–84.
Spence, C., Okajima, K., Cheok, A. D., Petit, O., & Michel, C. (2015). Eating with our eyes: From visual hunger to digital satiation. Brain and Cognition, 110, 53–63.
Szeliski, R. (2010). Computer vision: Algorithms and applications. Berlin, Germany: Springer Science & Business Media.
Totti, L. C., Costa, F. A., Avila, S., Valle, E., Meira, W., Jr., & Almeida, V. (2014). The impact of visual attributes on online image diffusion. In Proceedings of the ACM Conference on Web Science (pp. 42–51). New York, NY: Association for Computing Machinery.
van der Walt, S., Schönberger, J. L., Nunez-Iglesias, J., Boulogne, F., Warner, J. D., Yager, N., . . . Yu, T. (2014). Scikit-image: Image processing in Python. PeerJ, 2, e453.
van de Weijer, J., Schmid, C., & Verbeek, J. (2007). Learning color names for real-world images. In Proceedings of the IEEE Conference on Computer Vision and Pattern Recognition (pp. 1–8). Minneapolis, MN: Institute of Electrical and Electronics Engineers.
Wadhera, D., & Capaldi-Phillips, E. D. (2014). A review of visual cues associated with food on food acceptance and consumption. Eating Behaviors, 15(1), 132–143.
Wang, G. J., Volkow, N. D., Telang, F., Jayne, M., Ma, J., Rao, M., . . . Fowler, J. S. (2004). Exposure to appetitive food stimuli markedly activates the human brain. NeuroImage, 21(4), 1790–1797.
Werle, C. O., Trendel, O., & Ardito, G. (2013). Unhealthy food is not tastier for everybody: The “healthy = tasty” French intuition. Food Quality and Preference, 28(1), 116–121.
Whittle, N. (2017, April 7). A square meal: How restaurants are courting the Instagram crowd. Financial Times. Retrieved from
https://www.ft.com/content/16d6e63c-1984-11e7-9c35-0dd2cb31823a?mhq5j=e3