ISSN: 1992-8645 www.jatit.org E-ISSN: 1817-3195
ENERGY CONSUMPTION IN FAILURE OF BUSINESS
PROCESS SERVICES
WARTIKA1, HUSNI SASTRAMIHARDJA2, KRIDANTO SURENDRO3, IPING SUPRIANA S.4
1234
School of Electrical Engineering and Informatics, Bandung Institute of Technology
E- Mail : [email protected], [email protected], [email protected],4
E-mail: iping@informatika@org
ABSTRACT
Business process is integral part of modern organization. Linkages and interaction between resources and business process can have significant effect on use of energy. Because policies of environmental regulations, then organization needs to know and evaluate the performance of services business process so that can minimize energy consumption. This service can cause failure. This failure can increase intensity of resources utilization. This paper is used design study case result, method of research are experiment and interview. By knowing the growth of energy consumption in failure business process service, organization can minimize impact on environment by doing recovery process on the failure
Keywords:- Service, Business Process, Failure, Energy, Consumption
1. INTRODUCTION
Concerns environmental impact as a result of increasing human activities and some efforts have
been initiated globally to reduce energy
consumption and increase energy efficiency.
Recently, [11] have proposed some general
approach to energy management. [3]emphasize the
importance of reducing energy consumption. In order to increase potential of information systems for organization of “green”. Not only technology, but process need to be calculated. Implementation of process will consume energy and energy related to process. But, difficult to know what the real environmental impact of implementation process. [4][8] in this research reveale that linkage and interaction between process and business can have significant impact to energy utilization.
Organization need to know and evaluate performance of business process services, in order that can reduce energy consumption. In practice, this business process service can fail. The failure in service is condition that did not meet the desired goal. A true service is delivered when the services implements the fuction of process. This failure will increase intensity the use of resources. In order that, organization need to know how the growth of energy consumption in the failure of business process services, so that can reduce impact to environment and optimize the use of resources.
2. RESEARCH DESIGN CASE STUDY
Given the goal handle how the case study design was chosen for this study [2]. Case study is a methodology that is recognized and used widely in information systems research [8]. It is suitable for the exploration of new topic areas that do not have
empirical validation Case study can explain the
phenomenon, testing teoriatau develop new theories and hypotheses [2][6].
Given the goal which is handle how the case study is choosed to this research [1][2]. Research of study case is a methodology that is recognized and used widely in the system information [5]. It is suitable to explore new topic area which have not empiric validation [6]. Research of study case can explain phenomena, teory testing or new teory development and hypothesis [2][6].
[5] Analize 1.691 article from leading journal of information system and found that research of study case implement in 25% from all article. Study Case research have advantages that data from other sources can be combined
ISSN: 1992-8645 www.jatit.org E-ISSN: 1817-3195
interaction from management of information system [2][6].
This applies to a particular situation and appropriate with recently condition and appropriate with research which is done is to explain the pattern of energy consumption growth in the business process service failure.
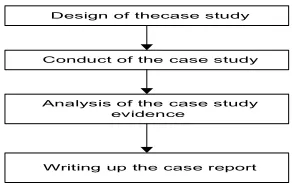
Special study design based on several case studies between January 2013 to December 2014, experiments and interviews conducted on 25 companies which have the characteristics of service business processes that are relatively the same. Approach of explorative study case which is use in this research refer to the frame of research.
Design of thecase study
Conduct of the case study
Analysis of the case study evidence
[image:2.612.121.267.287.384.2]Writing up the case report
Figure 1 : Research Design Case Study
Table 1 : Organization Characteristics Which Is Analyze
Total of business process 6 – 10 process
Total of business process service
12-25 services
Volume of service 20-85 /day
Total employee 54– 2038 employee
3. THE FAILURE OF BUSINESS PROCESS BUSSINESS
The failure of service is condition which not fulfill the fulfill the desired goal. A true service delivered when the service implement process function. And the failure of service which is often shortened failure is a occurrence which is happened when the service delivered diverge from true service. In the nut shell, failure is process which is not fulfill the desired goal. Failure usually seen as the opposite of truth.
Failure is chatter state from true condition. In the domain of business management, there is exclusion other terms that also be defined as the chatter state of desired secuence event. Failure concept and the exclusion are treated differently in
the research [10]. Basically, the exception is a deviation from the sequence of activities in the process, and failure refers to the deviation of the state of activity. Exceptions always been problems which are associated with the structural model of the business process, but failure is run-time behavior of a process.
Base on literature [9] , about metric green in service context (service), one of the performance that can be measured is the process time (process time) from the service. Service processing time is the average time that is taken from service of time of the request until the time of completion, include delay.
In the process, failure may happened in every condition because the reason which is related with this event, problem which is related to resource or human error.
Regardless of the source of failure, [11] found that failures can be included in one of the following categories Potential failure:
a) Incomplete, the activity is not fully perform of
this fuction.
b) Invalid, the service does not run at the right
time or do not produce the desired results
c) Inconsistent, the perform of activity is not
consistent.
d) Inaccurate, the action does not run according to
proper destination
Chatter state from the true service can assumpted as a different form which is modus the failure of service and ussualy called failure service depend on
failure severity [11] . defined the failure severity
as as the magnitude of the losses suffered due to the failure:
1 = Failure is not considered or do not affect
the process
2 = Failure of little consequence so it is not
apparent
3 = The failure resulted in a minor annoyance
but does not result in performance
4 = Failure to result in a slight loss in
performance
5 = Failure affect the process in order that
giving rise to the complaint
6 = Failure cause partial damage to the process
7 = Failure to generate significant user
ISSN: 1992-8645 www.jatit.org E-ISSN: 1817-3195
4. DISCUSSION
First step to know energy consumption in the failure of business process failure is identify the service, as follow:
a) Establish business domain
b) From this business domain, then to be detailed
business process, tool which is use an example
BPMN (Businesss Process Model and
Notification)
c) Then, identify the service from sub process
This is can do with adoption the research of [8]
about the abstract functionality layer SOA (Service
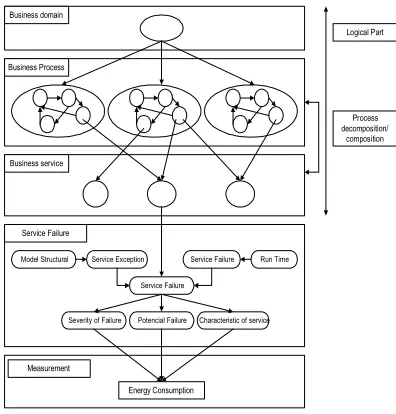
Oriented Architecture). Second step is identify failure. In the definition of failure need to know characteristic of service, potencial failure, dan severity of failure. Third step is measure consumption of energy in tha failure service.
This steps can describe as follow:
Business domain
Business Process
Business service
Logical Part
Process decomposition/
composition
Service Failure
Service Failure Service Failure Service Exception
Model Structural Run Time
Severity of Failure Potencial Failure Characteristic of service
Energy Consumption Measurement
Figure 2 : Model Identification Of Services Failures
To see the increase in energy consumption in the failure of the business process services necessary to measure, in this study using experimental measurements. Experiment is a regular procedure, which is carried out with the purpose of verification, deny, or prove the validity of the hypothesis. Experiments provide insight into causation by showing what happens when the result of certain factors manipulated. Experiment vary widely in purpose and scale,
but always rely on repetitive procedures and logical analysis of the results.
The following flowchart described measurement process
Start
check the type of service
set processing time
Failure
yes
additional processing time and energy consumption
No
form of failure
the average increase processing time and energy
consumption for the same failure and severity
the percentage of energy consumption rating the severity of
[image:3.612.313.497.172.391.2]service failure
Figure 3 : Flowchart Of Process Measurement Energy Consumption
Experiment which is conduct as follow:
Type of experiment = Controlled experimet
Method to determine the impact
= Dose response analysis
Characteristics of
service
= Seamless aggregation
Type of computer = Desktop
[image:3.612.102.300.347.554.2]1 hour ofcomput = 75 Watt
Table 2 : Potential Of Failure
No Potential of failure
Incomplete Invalid Inconsistent Inaccurate
1 √
2 √
3 √
4 √
5 √ √
6 √ √
7 √ √
8 √ √
9 √ √
10 √ √
[image:3.612.310.528.485.729.2]ISSN: 1992-8645 www.jatit.org E-ISSN: 1817-3195
No Potential of failure
Incomplete Invalid Inconsistent Inaccurate
12 √ √ √
13 √ √ √
14 √ √ √ √
This is graphic of energy consumption (%) base on
potential failure:
Information :
[image:4.612.88.540.48.512.2]SF = Severity of failure
Figure 4 : Grafic Of Energy Consumption Base On
Potential Failure (%)
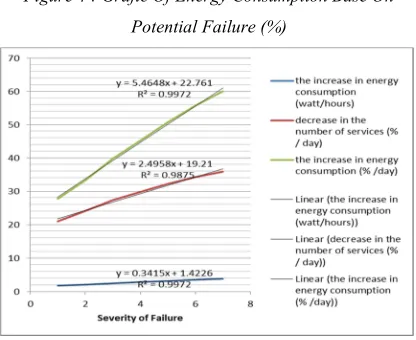
Figure 5 : Grafic Of Energy Consumption Base On Severity Of Failure
Figure 6 : Energy Consumption Function Base On
Potential Failure
5. CONCLUSION
From this experiment and interview which is
conducted in this research abaout energy
consumption in failure of business process services , in order that can be concluded as follow : increasing energy consumption average 2,78 watt per hours, decrease in the number of services average 29,19 % per day, and the increase in energy consumption average 44,62 % per day
6. FUTURE RESEARCH
From this research of energy consumption in the failure of business process service, furthermore need to be done research of how recovery process which is done, in order that this growth can be minimize.
ACKNOWLEDMENT
[image:4.612.90.298.510.680.2]ISSN: 1992-8645 www.jatit.org E-ISSN: 1817-3195 REFERENCES:
[1] Bansal, P. (2005) Evolving Sustainability: A
Longitudinal Study Of Corporate Sustainability
Development, Strategic Management Journal,
26, 3, 197–218.
[2] Benbasat, I., Goldstein, D. K. And Mead, M.
1987. "The Case Research Strategy In Studies
Of Information Systems," MIS Quarterly
(11:3), Pp. 369–386
[3] B Pernici, D Ardagna, C Cappiello , Business
process design: Towards service-based green information systems, - E-Government Ict Professionalism, 2008 - Springer
[4] Broadbent, M. and Weill, P. (1997)
Management by Maxim: How Business and IT
Managers Can Create IT Infrastructures, Sloan
Management Review, 38, 3, 77–92.
[5] Dubé, L. And Paré, G. 2003. "Rigor In
Information Systems Positivist Case Research:
Current Practices, Trends, And
Recommendations," MIS Quarterly (27:4), Pp.
597–635.
[6] Eisenhardt, K. M. 1989. "Building Theories
From Case Study Research," Academy Of
Management Review (14:4), Pp. 532-550.
[7] Konstantin Hoesch-Klohe, Aditya Ghose,
Lam-Son Lˆe, Towards Green Business
Process Management, University Of
Wollongong, Wollongong NSW 2522,
Australia School Of Computer Science And Software Engineering Decision Systems Lab
[8] Michael Papazoglou, Web Services and SOA:
Principles and Technology (2nd Edition), Jan 13, 2012
[9] Paolo Bozzelli, Qing Gu, Patricia Lago, A
Systematic Literature Review On Green Software Metrics, 2012
[10]Xiaocheng Ge, Richard F. Paige, And John A.
Mcdermid, Failures Of A Business Process In Enterprise Systems, M.M. Cruz-Cunha Et Al. (Eds.): CENTERIS 2011, Part I, CCIS 219, Pp. 139–146, 2011. © Springer-Verlag Berlin Heidelberg 2011
[11]Watson, R. T., Boudreau, M. C., & Chen, A. J.
(2010). Information Systems And