ANALYSIS ON FINANCING EFFICIENCY OF LISTED
SMALL AND MEDIUM BUSINESS
QIAN LIU
School of Finance, Harbin University of Commerce, Harbin, 150028
ABSTRACT
All the listed companies are always concentrating on the financing efficiency. Especially after the financial crisis, a great many small and medium companies have suffered from this terrific financial disaster in China because of the close trade relation with America and other developed countries. In order to know about the factor that influences the financing efficiency, principal component analysis is adopted here to do research on this topic. This paper is based on the regional analysis, which aims to provide suggestion for the small and medium business in the northeast of China.
Keywords: Small and Medium Business, Financing Efficiency, Principal Component Analysis
1.
INTRODUCTIONThe financing efficiency of small and medium business has always been the hot topic for the academic research, especially after the financial crisis, the small and medium business in China have been strongly struck, even some have been run into bankruptcy. The situation of small and medium business has enhanced the focus on financing efficiency. Therefore, we try to adopt the quantitative analysis to do research on financing efficiency; especially, we are doing analysis of financing procedure and financing efficiency of listed small and medium business in the northeast of China. Moreover, we focus on the financing efficiency of listed small and medium business existing after the financial crisis. Also, we are trying to give suggestion on how to improve financing efficiency.
From the perspective of relationship between liabilities and total output, Chen Shengquan, Xie Zhongqiu [1] have constructed multiple linear regression model to get the conclusion that the current financing efficiency of small and medium business in China has been low, and the distribution of financing efficiency is imbalanced. At the same time, Menghua Tong, Yingchun Liu [2] has analyzed the financing method and financing efficiency of small and medium business in China based on accounting analysis, then he got the similar conclusion that financing efficiency of small and medium business is low. As far as the small and medium business is concerned, financing by equity could not enhance the profitability or the operation capability of business. Hence, financing by equity is not the appropriate way for the small and medium business. Zhigang Li,XianLiang
Chi,ChunZhou Mu [3] has applied Data Envelopment Analysis (DEA) approach for the empirical analysis of financing efficiency of listed small and medium manufacturing business, then he identified that the financing efficiency has stated low, and the financing efficiency has varied from region to region. But the correlation between financing efficiency and number of regional listed companies is not significant. Besides, the financing efficiency of small and medium manufacturing business is related to the time of being listed, and the financing efficiency could be improved by the adjustment of financing scale. [4]
In general, the approach that most researcher adopted in China focuses on Analytic Hierarchy Process (AHP), DEA and entropy, as far as this paper is concerned, principal components analysis is adopted here, additionally, comparative analysis among the small and medium business is used as well. Then we hope that new ideas could be provided as a result of this research for the future research.
2.
RELATED WORK2.1 Selection of Sample
has been chosen for analysis. Additionally, all the data used in this paper has been cited from original financial report and financial statement of these listed companies, and all the indicators and quotations of these listed companies have been attained from “www.fiance.sina.com”.
2.2 Variable Definition
[image:2.612.77.287.350.712.2]The assessment of financing efficiency of a company is considered to be integrated, and one indicator is definitely not enough. [5] Hence, we are going to do the assessment from four perspectives, which cover profitability, developing capability, operating capability, and financing structure. With the help of principal components analysis, an integrated financing efficiency indicator will be concluded. Then the assessment of financing efficiency could be taken into process. And the illustration of financing efficiency indicator is shown on Table 1.
TABLE 1: Indicators Table Of Financing Efficiency Components
Type Indicator Name
Indicator
Definition Letter
Profitability Total Asset Profit Rate Major Business Profit Rate Total Profit/Total Asset Major Business Profit/Major Business Income 1 x 2 x Developing Capability Growth Rate of Major Business Income Growth Rate of Net Asset
( Current Major Business Income-Previous Major Business Income)/Previous Major Business Income (Current Net Asset Amount-Previous Net Asset Amount)/ Previous Net Asset Amount 3 x 4 x Operating capacity Account Receivable Turnover Total Asset Turnover Major Business Income/Average Balance of Account Receivable Major Business Income/Average Balance of Total Asset 5 x 6 x Financing Structure Time Interest Earned Ratio Equity Ratio Assets-Liabilities Ratio
Profit before Tax and Interest/Interest Cost Liabilities/Owner’ s Equity Liabilities/Total Asset 7 x 8 x 9 x
3. EMPIRICAL ANALYSIS 3.1 Data Processing
The principal components analysis is adopted here to calculate the integrated financing efficiency of listed companies. And there are 3 steps for data processing procedure:
Step1: Variables standardization. Because of the different dimension and meaning of the selected data, standardization of variables is necessary.
Step2: Positive tendency of variables. [6] It means the larger is the data with specific range, the higher is the financing efficiency. On the observation of data selected in this paper, all the data is positive, then the positive tendency is could be ignored. [7]
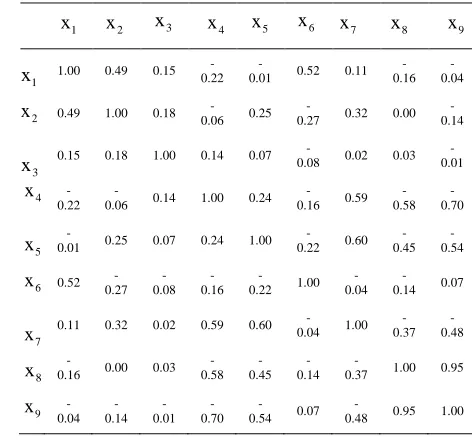
Step3: Definition of variables being appropriate for the principal component analysis. The precondition for the principal component analysis is observation of relationship between variables. If there is no obvious correlation between the original variables, it is impossible to get the minor common factor variables that could reflect the common character of some variables. Therefore, analysis of correlation before the principal component analysis is necessary. Table 2 is the correlation matrix between the variables by means of EVIEWS6.0. From the figures of Table 2 shown on the top of this page, we can see the obvious correlation between these variables, and then the precondition of principal component analysis is fulfilled.
Table 2: Correlation Cpefficient Matrix Of Financial Indicators
1.00 0.49 0.15
-0.22
-0.01 0.52 0.11
-0.16
-0.04
0.49 1.00 0.18
-0.06 0.25
-0.27 0.32 0.00
-0.14
0.15 0.18 1.00 0.14 0.07
-0.08 0.02 0.03
-0.01
-0.22
-0.06 0.14 1.00 0.24
-0.16 0.59
-0.58
-0.70
-0.01 0.25 0.07 0.24 1.00
-0.22 0.60
-0.45
-0.54
0.52
-0.27 -0.08 -0.16
-0.22 1.00
-0.04
-0.14 0.07
0.11 0.32 0.02 0.59 0.60
-0.04 1.00
-0.37
-0.48
-0.16 0.00 0.03
-0.58 -0.45 -0.14
-0.37 1.00 0.95
-0.04 -0.14 -0.01 -0.70
-0.54 0.07
-0.48 0.95 1.00
1
x x2 x3 x4 x5 x6 x7 x8 x9
[image:2.612.297.533.482.702.2]3.2 Collecting Characteristic Vectors
[image:3.612.307.522.75.174.2]After the calculation by EVIEWS 6.0, we can get Table 3: The characteristic value and contribution rate. And from Table 3, it is easy to see the four Characteristic roots of correlation matrix for variables: 3.892, 2.471, 1.432 and 1.291. These Characteristic roots could be the illustration of variance 90.86% of commercial bank performance assessment.[8] Besides, the first to the fourth characteristic vectors have shown the most information of original data. Thus these four characteristic values could be selected instead of the original 9 variables.
TABLE 3: Characteristic Value And Contribution Rate Initial Factor x -1 x 9 Selected Common Factor x -1 x 4
Factor Chara cterist ic Value
Contrib ution Rate
Accumu lated contribu tion rate
Charact eristic Value
Contribu tion Rate
Accumu lated contribu tion rate
1 3.24 36.03% 36.03% 3.24 36.03% 36.03%
2 1.79 19.86% 55.89% 1.79 19.86% 55.89%
3 1.70 18.83% 74.71% 1.70 18.83% 74.71%
4 1.00 10.99% 85.71% 1.00 10.99% 85.71%
5 0.75 8.32% 94.03%
6 0.31 3.43% 97.46%
7 0.14 1.6% 99.05%
8 0.08 0.88% 99.93%
9 0.01 0.07% 100%
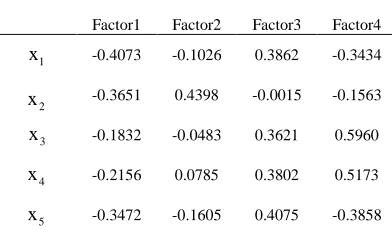
But it is not direct to get the expression of these new variables. Then the principal component and its correlation coefficient could be shown after process, which is shown on Table 4.
Table 4: Corellation Coefficient Of Principal Component And Variables
Factor1 Factor2 Factor3 Factor4
x1 -0.4073 -0.1026 0.3862 -0.3434
2
x -0.3651 0.4398 -0.0015 -0.1563
3
x -0.1832 -0.0483 0.3621 0.5960
4
x -0.2156 0.0785 0.3802 0.5173
5
x -0.3472 -0.1605 0.4075 -0.3858
6
x -0.1050 -0.6943 -0.0632 -0.1031
7
x -0.2762 -0.4845 -0.3374 0.2640
8
x 0.4472 -0.1628 0.3785 -0.0593
9
x 0.4613 -0.1363 0.3848 -0.0467
3.3 Constructing Function
According to Table 4, all the expression of principal components could be written as follows:
1 1 2 3
4 5 6
7 8 9
0.4073 0.3651 0.1832
0.2156 0.3472 0.1050
0.2762 0.4472 0.4613
F X X X
X X X
X X X
= − − −
− − −
− + + (1)
2 1 2 3
4 5 6
7 8 9
= 0.1026 0.4398 0.0483 0.0785 0.1605 0.6943 0.4845 0.1628 0.1363
F X X X
X X X
X X X
− + −
+ − −
− − − (2)
3 1 2 3
4 5 6
7 8 9
0.3862 0.0015 0.3621 0.3802 0.4075 0.0632 0.3374 0.3785 0.3848
F X X X
X X X
X X X
= − +
+ + −
− + + (3)
4 1 2 3
4 5 6
7 8 9
0.3434 0.1563 0.5690
0.5173 0.3858 0.1031
0.2640 0.0593 0.0467
F X X X
X X X
X X X
= − − +
+ − −
+ − − (4)
Finally, construct the integrated financing efficiency function. After taking the information contribution rate of principal component as the weight, integrated financing efficiency (ife for short) function of listed companies could be expressed as this equation: [9]
Ife 36.03%F1 19.86F2 / 85.71%
18.83%F3 10.99%F4
+ +
= +
(5)
3.4 Analysis of Result
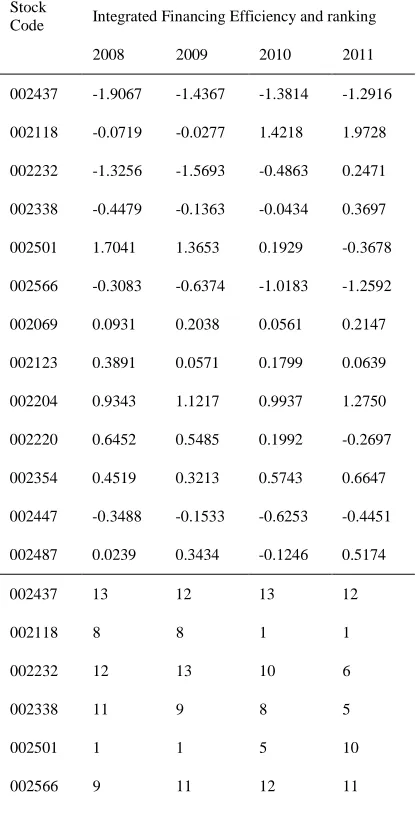
After substituting the data of listed companies for 2008, 2009, 2010 and 2011 for integrated financing efficiency function, then we can get the integrated financing efficiency of all the listed companies and efficiency ranking. See Table 5.
[image:3.612.89.298.258.504.2] [image:3.612.96.292.605.722.2]lengthened period of account receivable should be the reason for that. Besides this, 002204,002220 and 002354 have the high financing efficiency as well, and the ranking of these companies is stable. When it comes to 002069 and 002123, the financing efficiency is in the middle of the ranking. In terms of 002437, 002232, 002338, 002566 and 002447, the ranking is not positive; it means the financing efficiency of these companies is relatively low. But 002118 is special, its financing efficiency in 2008 and 2009 was low, and 2010, 2011 have seen its obvious improvement of financing efficiency. Decrease on financing capital and liabilities should be responsible for the change. The financing efficiency of small and medium business in the northeast of China is low on the whole, but the situation could be improved by means of management optimization.[10]
Table 5: Integrated Financing Efficiency And Its Ranking
Stock
Code Integrated Financing Efficiency and ranking
2008 2009 2010 2011
002437 -1.9067 -1.4367 -1.3814 -1.2916
002118 -0.0719 -0.0277 1.4218 1.9728
002232 -1.3256 -1.5693 -0.4863 0.2471
002338 -0.4479 -0.1363 -0.0434 0.3697
002501 1.7041 1.3653 0.1929 -0.3678
002566 -0.3083 -0.6374 -1.0183 -1.2592
002069 0.0931 0.2038 0.0561 0.2147
002123 0.3891 0.0571 0.1799 0.0639
002204 0.9343 1.1217 0.9937 1.2750
002220 0.6452 0.5485 0.1992 -0.2697
002354 0.4519 0.3213 0.5743 0.6647
002447 -0.3488 -0.1533 -0.6253 -0.4451
002487 0.0239 0.3434 -0.1246 0.5174
002437 13 12 13 12
002118 8 8 1 1
002232 12 13 10 6
002338 11 9 8 5
002501 1 1 5 10
002566 9 11 12 11
002069 6 6 7 7
002123 5 7 6 8
002204 2 2 2 2
002220 3 3 4 9
002354 4 5 3 3
002447 10 10 11 11
002487 7 4 9 4
4. CONCLUSION
Based on the data of 13 listed small and medium businesses in the northeast of China for 2008, 2009, 2010 and 2011 we have tried to construct the assessment system of financing efficiency for the small and medium business in this region by using principal components analysis. And the analysis of financing change and reason for that has been carried out as well in this research. To conclude, the financing efficiency of small and medium business in the northeast of China is low. And the financing way of some businesses is limited, which results in the change of financing efficiency. In addition, profitability and developing capability are important indicators to evaluate the financing efficiency of a company. [11] From the perspective of profitability, developing capability and operating capability, financing efficiency of a business could be improved beyond comparison of financing capital. According to the similar research report, [12] it is thought, the less the debt financing capital is, the more is the equity financing capital. But according to our analysis, financing efficiency could be improved by the decrease on debt financing. And it also depends on the capital environment. This opinion is similar to that of some other researchers.
ACKNOWLEDGEMENTS
This work was supported by the Social Science Foundation of Heilongjiang Province(No.11B055
)
REFERENCES:
[1] Shengquan Chen and Zhongqiu Xie, "Emprical Ayalysis of Financing Efficiency of Small and Medium Business", Journal of JiangSu Technology Normal College , vol.10, n.4, pp. 84–89, 2004.
[2] Menghua Tong and Yingchun Liu,"Analysis of Financing Methods and Efficiency of Small and Business in Liaoniang Province", Journal of
Dongbei University of Finance and Economics,
vol.80, n.2, pp. 36–39, 2012.
[3] Zhigang Li,XianLiang Chi,ChunZhou Mu, "Empirical Analysis of Financing Efficiency of Small and Medium Business", Industrial Technology & Economy, vol.27, n.9, pp. 64–66, 2008.
[4] Mendoza, Enrique G , Sudden Stops, "Financial Crises, and Leverage", American Economic Review, Vol. 100, n. 5, pp1941-1966, 2010. [5] Almeida, Heitor, Campello, Murillo, "Financing
Frictions and the Substitution between Internal and External Fund", Journal of Financial & Quantitative Analysis, Vol. 45, n. 3, pp589-622, 2010.
[6] Minola, Tommaso, Giorgino, Marco, "External capital for NTBFs: the role of bank and venture capital", International Journal of Entrepreneurship & Innovation Management,
Vol.14, n. 2, pp. 222-247, 2011.
[7] Yazdanfar, Darush, "The Impact of Financing Pattern on Firm Growth: Evidence from Swedish Micro Firms", International Business Research, Vol. 5,n.9, pp16-25,2012.
[8] Diaconu, Mihaela, "Features of Financing Innovative Enterprices", International Journal of Academic Research, Vol. 4, n. 2, pp70-74, 2012.
[9] D. Serwa, M. Bohl, "Costs of Banking System Instability: Some Empirical Evidence".
Journal of Banking and Finance, vol.126, n.6, pp.825-55. 2006.
[10] Chemmanur, Thomas J, Krishnan, Karthik, Nandy, Debarshi K. "How Does Venture Capital Financing Improve Efficiency in Private Firms? A Look Beneath the Surface",
Review of Financial Studies, Vol. 24, n.12, pp4037-4090, 2011.
[11] Moreno, Ramon, "Macroeconomic Behavior During Periods of Speculative Pressure or Realignment: Evidence of Pacific Basin Countries", Economic Review, vol.225,n. 3: pp.36-47, 2005.
[12] Sisli-Ciamarra, Elif, "Monitoring by Affiliated Bankers on Board of Directors: Evidence from Corporate Financing Outcomes", Financial Management (Blackwell Publishing Limited),