ISSN: 1992-8645 www.jatit.org E-ISSN: 1817-3195
723
CASCADE-CORRELATION NEURAL NETWORK FOR
VIBRATION FITTING OF HYDRAULIC TURBINE UNITS
1
CHUNLIU LI, 2LIYING WANG
1
College of Urban Construction, Hebei Normal University of Science&Technology, Qinhuangdao 066004,
Hebei, China
2
Hebei University of Engineering, Handan 056038, Hebei, China
ABSTRACT
Cascade-Correlation (CC) network is a new architecture and supervised learning algorithm for artificial neural networks. The learning algorithm of CC network and its network structure are described in this paper, the CC network with an excellent fitting ability is applied to fitting vibration characteristics of hydraulic turbine units according to different parts under three water heads. Compared with the BP network, the simulation experiments demonstrates that the CC network has a faster convergence speed and a higher accuracy, it is much closer to true to describe the vibration characteristics of hydraulic turbine units under different working conditions for their parts than its counterpart.
Keywords: Cascade-Correlation Neural Network, Vibration Fitting, Turbine Units
1. INTRODUCTION
It is well known that vibration characteristics in draft tube caused by vortex rope have a great influence on the stability of turbine. Because of the complex geometry and the wide range of load change, the study of vibration characteristics is basically stuck in a static stress analysis of the strength, the analysis of vibration characteristics is still poorly understood [1, 2]. In the absence of the study of vibration characteristics, sometimes the runner is damaged and may lead to failure accident in many power stations. We can be sure that the turbine input and output characteristics is nonlinear, if we can accurately and comprehensively grasp the laws of vibration characteristics, undoubtedly it will have an important practical significance to contribute to the secure and stable running of hydro-generator units under different operating conditions [3]. The strong nonlinear characteristics of pressure fluctuation makes its expression and analysis difficult, in recent years, domestic and foreign experts and scholars put forward some theories and methods about fitting and prediction for vibration, including numerical analysis method, artificial neural network (ANN) method [4], support vector machine (SVM) method [5], and so on. However, with these methods, the generality of method and the complexity of parameter selection are challenges for their generalization capability and precision. For example, the ANN method has
excellent characteristics of nonlinear approximation and has been widely used in many fields, but it has the disadvantages of inherent slowly searching rate and partially leading to minimum. So, how to find a more effective method to express the characteristics is becoming a burning question now.
Instead of just adjusting the weights in a network of fixed topology, Cascade-Correlation [6] is a new architecture and supervised learning algorithm for artificial neural networks., it begins with a minimal network, then trains and generates automatically new hidden units once a time, creating a multilayer network structure. Once a new hidden unit has been joined into the network structure, its input weights are frozen. The method can learn quickly, the network may determine its own magnitude and topology. In this paper, in view of the complexity and particularity of hydraulic turbine units, one uses a novel CC neural network to establish the fitting model which can accurately express the nonlinear relationship among vibration characteristics, water head and unit output in upper bracket, thrust bearing and head cover respectively. Finally the comparative experiments demonstrate its superiority.
2. CASCADE-CORRELATION NEURAL NETWORK
724 artificial neural networks. It mainly consists of two key ideas: firstly, the cascade architecture, in which hidden units are joined to the architecture every time and is not altered after they have been joined in. Secondly, the learning method would generate and then install the new hidden units. We would try to magnify the magnitude of the cascade correlation between the output and the remainder of the error we are trying to evaluate.
We start on the first cycle, a single new hidden unit is generated and a weight connection from each input unit is given [7, 8]. Then the weights of he input are trained by altering them to maximize the equation C for the new hidden unit:
C yp y eop eo
p o
=∑∑( − )( − )
(1)
where
y
is the mean values of the outputs ande
o is output error, they are based on sample patterns.The second cycle gives the output of the new hidden unit a weight connection for each output unit. The entire set of connections to those from all input and hidden units would be trained through minimizing the sum squared error equation
∑
−=
p o
op op t
y Error
,
2
)
(
(2)
where yop and top are the network output for
pattern p and the expected output for this pattern respectively.
3. EXPERIMENTAL SETUP
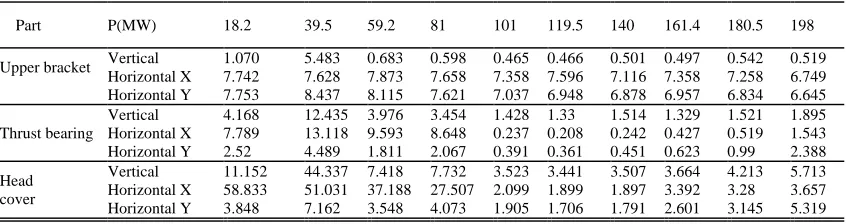
All vibration data used in the experiments model are from No. 5 unit of a certain hydropower [9, 10]. The measurement points of vibration are located in upper bracket, thrust bearing and head cover respectively, which are all measured in three directions including vertical direction, ,+X and +Y axes, the type 891-2 vibration sensors are employed in the experiments which consist of three vertical vibration sensors and horizontal vibration sensors. The sensors arrangement in the axis section is shown in Figure 1. The vibration experiments with variable load are accomplished when water head is 59.2m, 68m and 75.5m, the guide vane opening is manual adjusted, 10 experiments are carried out under different working conditions from the smallest up to the biggest output, the stable time of every operation condition lists 5 to 10 minutes, after the working condition stabilizes, three continuous measurements are conducted on the vibration data, and each of measurements is 30 seconds, the experiment results are recorded in 95% confidence degree double-amplitude (steady random process). The part results of vibration experiments with variable load when water head is 68m are shown in Table 1.
Flow direction
+X
[image:2.612.95.518.552.664.2]+Y
Figure 1: The Sensors Arrangement In The Axis Section
Table I: The Results Of Vibration Experiments With Variable Load When Water Head Is 68m.
Part P(MW) 18.2 39.5 59.2 81 101 119.5 140 161.4 180.5 198
Upper bracket Vertical 1.070 5.483 0.683 0.598 0.465 0.466 0.501 0.497 0.542 0.519 Horizontal X 7.742 7.628 7.873 7.658 7.358 7.596 7.116 7.358 7.258 6.749 Horizontal Y 7.753 8.437 8.115 7.621 7.037 6.948 6.878 6.957 6.834 6.645
Thrust bearing
Vertical 4.168 12.435 3.976 3.454 1.428 1.33 1.514 1.329 1.521 1.895 Horizontal X 7.789 13.118 9.593 8.648 0.237 0.208 0.242 0.427 0.519 1.543 Horizontal Y 2.52 4.489 1.811 2.067 0.391 0.361 0.451 0.623 0.99 2.388
Head cover
Vertical 11.152 44.337 7.418 7.732 3.523 3.441 3.507 3.664 4.213 5.713 Horizontal X 58.833 51.031 37.188 27.507 2.099 1.899 1.897 3.392 3.28 3.657 Horizontal Y 3.848 7.162 3.548 4.073 1.905 1.706 1.791 2.601 3.145 5.319
In this paper, the operating data measured with variable load are analyzed when water head is 59.2m, 68m and 75.5m. The model of vibration characteristics f = (H, N) is established based on the CC, where H is running head (m), N is the hydraulic
ISSN: 1992-8645 www.jatit.org E-ISSN: 1817-3195
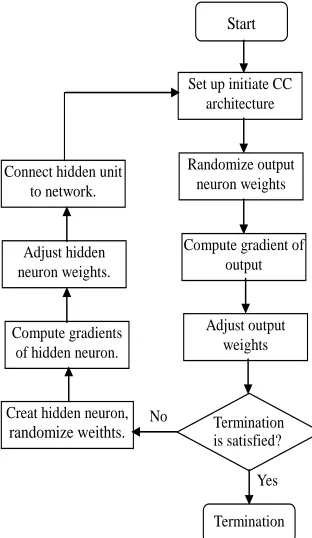
725 CC network is constructed and the weights are trained automatically. The training results in 5 hidden neurons being added to the actual network, Figure 3 demonstrates the training error curve obtained. In order to verify this method, the performance of BP neural network is compared to the CC neural network model in the vibration experiments of turbine units. The BP network is trained using fast back-propagation method, with training parameters being set as follows: a learning rate is 0.02, and Momentum constant is 0.9. The weights and biases are initialized randomly[11]. The training results based on BP and CC neural network are shown in Table 2.
Set up initiate CC architecture
Randomize output neuron weights
Compute gradient of output
Adjust output weights
Termination is satisfied?
Termination
Start
Connect hidden unit to network.
Adjust hidden neuron weights.
Compute gradients of hidden neuron.
Creat hidden neuron,
randomize weithts.
[image:3.612.306.530.259.305.2]Yes No
Figure 2: Construction Of CC Neural Network
0 1 2 3 4 5 6
Number of hidden neurons
SSE
0.001 0.01 0.1 1
Figure 3: The Training Process Of CC Network
[image:3.612.113.269.266.535.2]From Table 2, the CC network is only adjusted five times, it has a fast convergence speed and the network structure acquired has a high fitting precision, the result shows that the CC network is prior to the BP network. The fitting curves are plotted between the actual vibration values of the upper bracket under three water heads and the fitting values based on the CC network and BP network, which are shown in Figure 4, they may be used to test the fitting effect.
Table 2: The Comparison Of Training Results Between Bp And Cc
Method Epoch SSE Network structure
BP 5000 0.7725% [2,4,1] CC 5 0.3056% [2, 1, 1, 1, 1, 1]
From Table 2, the CC network is only adjusted five times, it has a fast convergence speed and the network structure acquired has a high fitting precision, the result shows that the CC network is prior to the BP network. The fitting curves are plotted between the actual vibration values of the upper bracket under three water heads and the fitting values based on the CC network and BP network, which are shown in Figure 4, they may be used to test the fitting effect.
[image:3.612.102.286.581.688.2]726 H=59.2m 0 1 2 3 4 5 6 33
39.5 44 60 79 92 104 116 127 145 156 160 P (KW) V ibr at ion va lue /0. 01m
m Act ual value
BP net work
H=59.2m 0 1 2 3 4 5 6 33
39.5 44 60 79 92 104 116 127 145 156 160 P (KW) V ibr at ion va lue /0. 01m
m Act ual value
CC net work
H=68m 0 1 2 3 4 5 6
18.2 81 119 140 161.4 180.5 198 P (KW) V ib ra tio n v alu e/0 .0 1 m
m Act ual value
BP net work
H=68m 0 1 2 3 4 5 6
18.2 81 119 140 161.4 180.5 198 P (KW) V ib ra ti o n v al u e/ 0 .0 1 m m
Act ual value
CC net work H=75.5m 0 1 2 3 4 5
0 50 100 150 200 250
P (MW) V ib ra tio n v alu e/0 .0 1 m
m Actual value
CC network H=75.5m 0 1 2 3 4 5
0 50 100 150 200 250
P (MW) V ibr at ion va lue /0. 01m
m Actual value
[image:4.612.89.523.80.424.2]BP network
Figure 4: The Test The Fitting Effect Using CC And BP Network Respectively
0 0.02 0.04 0.06 0.08 0.1 0.12 Upper bracket T hrust bearing Head cover Upper bracket T hrust bearing Head cover Upper bracket T hrust bearing Head cover
H=59.2m H=68m H=75.5m
[image:4.612.145.480.506.717.2]M e an r e la ti v e e rr o r BP CC
Figure 5: Mean Relative Errors With The Three Parts Under Three Different Water Heads For Both The CC And The BP Network
ISSN: 1992-8645 www.jatit.org E-ISSN: 1817-3195
727
4. CONCLUSIONS
CC network is a new architecture and supervised learning algorithm for artificial neural networks. The definition of CC algorithm and structure of the network are described, based on the operating data of a certain hydropower the fitting model of vibration characteristics is established using the CC network, than the application of BP and CC networks are compared. The results show that CC network can avoid the limitations of slow convergence due to step changes in target problems and issues caused by the BP neural network, and avoid the difficulty of hidden layer nodes are to be determined, the speed of convergence based on the CC network is quick and can achieve the higher accuracy. It is conclusion that the CC network is prior to the BP network, the method can provide useful and essential references in this field. One of the future works is to study the classification problem of pressure fluctuation in draft tube based on the CC network.
ACKNOWLEDGEMENTS
This work is supported by the Science and Technology Research Project of University of Hebei Province No. Y2012016, the Science Research Foundation of Hebei Education Department of China No. 2009422, and the Natural Science Foundation of Hebei Province of China No. E2010001026.
REFRENCES:
[1] ZHAO Linming, WEI Dehua, HE Chenglian, “Neural network model for pressure fluctuation in draft tube of water turbine”. Journal of Hydraulic Engineering, Vol.36, No.11, 2006, pp.1375-1378.
[2] J. Yi,J. Labadie,S. Stitt, “Dynamic optimal unit commitment and loading in hydropower systems”, Journal of Water Resources planning and Management-ASCE,Vol.129, No.5, 2003, pp.388-398.
[3] WANG Fujun, ZHANG Ling, ZHANG Zhimin, “Analysis on pressure fluctuation of unsteady flow in axial-flow pump”, Journal of Hydraulic Engineering, Vol.38, No.8, 2007, pp.1003-1009.
[4] B. SAMANTA, K. R. AL-BALUSHI, “Fault diagnosis of rolling element bearing using time-domain features and neural networks”,
Mechanical Systems and Signal Processing, Vol.17, No.2, 2003, pp. 317-328.
[5] G. Valentini, T. G. Dietterich, “Bias-variance analysis of support vector machines for the development of SVM-based ensemble methods”, Journal of Machine Learning Research, Vol.5, 2004, pp.725-775.
[6] S. C. Fahlman, C. Lebiere, “The Cascade Correlation Learning Architecture”, Advance in Neural Information Processing systems, Vol.2, 1990, pp.524-530.
[7] A. M. Potter, A Genetic Cascade-Correlation Learning Algorithm, “Proceedings of
Combinations of Genetic Algorithms and Neural Networks”, Jun, 6, 2001, pp. 123-133. [8] I. Magdisyuk, “Using the Cascade-Correlation
Algorithm to Evaluate Investment Projects”, Informatica, Vol.12, No.2, 2001, pp.101-108. [9] M. T. L. Barros,F. T. C. Tsai,S. L. Yang,
“Optimization of large-scale hydropower system operations”, Journal of Water Resources Planning and Management-ASCE, Vol.129, No.3, 2003, pp.178-188. .
[10]C. E. Imrie, S. Durucan, A. Korre, “River flow prediction using artificial neural networks: generalization beyond the calibration range”, Journal of Hydrology, Vol.233, No.1-4, 2000, pp.138-153.