IJPSR (2016), Vol. 7, Issue 4 (Research Article)
Received on 05 November, 2015; received in revised form, 22 December, 2015; accepted, 05 February, 2016; published 01 April, 2016
QUALITY BY DESIGN APPROACH FOR THE DEVELOPMENT AND VALIDATION OF SAXAGLIPTIN BY RP-HPLC WITH APPLICATION TO FORMULATED FORMS
Shubhangi C. Daswadkar *1, Madhumita A. Roy 1, Sanjay G. Walode 2 and Mahendra Kumar CB 3
Department of Pharmaceutical Chemistry 1, Padm. Dr. D. Y. Patil College of Pharmacy, Akurdi, Pune-411044, Maharashtra, India
Department of Pharmaceutical Chemistry 2, Sinhgad Institute of Pharmaceutical Sciences, Kusgaon (Bk), Lonavala, Pune- 410 401, Maharashtra, India
Department of Pharmaceutical Chemistry 3, St. Mary’s College of Pharmacy, H.No.9-1-248, St. Francis Street, Secunderabad-500025, Andhra Pradesh, India
ABSTRACT: Quality by Design (QbD) is a philosophy that refines the level of knowledge associated with a product that uses process understanding to deliver a product with the desired critical quality attributes. The objective of this present study was to develop and demonstrate an integrated multivariate approach to develop and quantify the constituent concentrations of saxagliptin drug in its pure and formulated forms. The method was developed using a mobile phase acetonitrile: water (pH3), (20:80 v/v) on an Agilent, TC C18 (250 × 4.6 mm) 5μm column and flow rate 1.0 ml/min which was optimized with help of design expert software and validated according to ICH Q2 guideline and application of this method to different stress condition of saxagliptin. The detector linearity was established in concentrations ranging from 10-90μgmL-1, the regression coefficient was 0.9993. The method fulfilled validation criteria and was shown to be sensitive, with limits of detection (LOD) and quantitation (LOQ) of 0.003
and 0.010𝜇gmL-1, respectively. The percentage relative standard deviations for
robustness and ruggedness were observed within the range of 0.28 and 0.57. The drug was subjected to acidic, alkali, neutral, oxidative, heat and photo degradation stress. Drug shows significantly degraded in acidic and alkali condition while remain stable in other conditions. The high recovery and low relative standard deviation confirm the suitability of these methods can be
employed for the routine analysis of tablet containing saxagliptin.
INTRODUCTION: Quality by design is a systematic approach to development that begins with predefined objectives and emphasizes product and process understanding and process control, based on sound science and quality risk management 1.
QUICK RESPONSE CODE
DOI:
10.13040/IJPSR.0975-8232.7(4).1670-77
Article can be accessed online on: www.ijpsr.com DOI link: http://dx.doi.org/10.13040/IJPSR.0975-8232.7 (4).1670-77
The objective of the QbD initiative is to demonstrate both understanding and control of pharmaceutical processes to deliver high quality pharmaceutical products while affording opportunities for continuous improvement. QbD delivers a better understanding of method capabilities and limitations and ensures a superior chance of successful downstream method validation and transfer. It has become an important paradigm in the pharmaceutical industry since its introduction by the US Food and Drug Administration 2–4. The QbD concept can be extended to analytical methods 5–8. The analytical Key words:
QbD, Saxagliptin, antidiabetic, Stability-indicating
method, ICH guidelines Correspondence to Author: Shubhangi C. Daswadkar
Assistant Professor,
Department of Pharmaceutical Chemistry, Dr. D. Y. Patil
Educational Complex, Padmashree Dr. D. Y. Patil College of Pharmacy, Akurdi, Pune-411044, Maharashtra, India.
methods used for the analysis of active pharmaceutical ingredients (API) and drug products are an integral part of the QbD.
Saxagliptin (Fig.1) is chemically (1S, 3S, 5S) ‐2‐ [(2S) ‐2‐amino‐2‐ (3‐hydroxy ‐1‐adamantyl)acetyl] ‐2‐azabicyclo [3.1.0]hexane‐3‐carbonitrile is oral hypoglycemic (anti‐diabetic drug) of the new dipeptidyl peptidase‐4 (DPP‐4) inhibitor class of drugs. DPP-4 inhibitors represent a new therapeutic approach to the treatment of type 2 diabetes mellitus. They inhibit the inactivation of incretins, resulting in the stimulation of glucose-dependent insulin release and the reduction of glucagon levels
9
.
N O
NH2
H H
C
[image:2.612.61.289.274.384.2]N HO
FIG. 1: CHEMICAL STRUCTURE OF SAXAGLIPTIN
Several analytical methods have been developed for quantitative analysis of Saxagliptin in bulk and
pharmaceutical formulations like
UV‐spectrophotometric method10-13, Reverse Phase-High Performance Liquid Chromatography (RP-HPLC) method 14-18, RP-HPLC with fluorescence detection method in human plasma 19, High Performance Thin Layer Chromatographic Method 20. Ultra performance liquid chromatography/tandem mass spectrometry (UPLC-MS/MS) method has been developed for quantification of Saxagliptin in rat plasma 21. Liquid chromatography and tandem mass spectrometry (LC-MS/MS) method has been developed and validated for simultaneous analysis of Saxagliptin and its major metabolite 22.
LC-ESI-MS/MS method has been developed for estimation of saxagliptin and its forced degradation products 23. Method development approach with RP-HPLC specifically focused on pharmaceutical development in a QbD environment for saxagliptin has not been reported anywhere. Therefore, there is an unmet need to investigate a systematic HPLC method development approach for pharmaceutical
development using QbD principles to ensure the quality of the method throughout the product lifecycle. The primary objective of this study was to implement QbD approach to develop and validate an RP-HPLC method that could separate drug in the bulk and formulated forms from its potential related substances and to establish an in depth understanding of the method and build in the quality during the method development to ensure optimum method performance over the lifetime of the product with a suitable degradation data.
MATERIALS AND METHODS:
Chemical and reagents: A sample of saxagliptin was obtained as a gift from Neul and laboratories ltd., Hyderabad, Telangana, India. Saxagliptin containing tablets; Onglyza (5 mg) (AstraZeneca UK Limited), were procured from the local market. All HPLC-grade acetonitrile was obtained from Merck, Mumbai, India. Hydrochloric acid, sodium hydroxide and hydrogen peroxide (30%) were obtained from Merck, India. Doubly distilled water was used throughout the investigation.
Instrumentation and chromatographic conditions:
The HPLC system, Agilent 1120 compact with manual Rheodyne injector facility operates at 20μL capacity per injection was used. The instrumentation was controlled by use of EZChrom Elite Compact software. The column used was Agilent TC C18 (250 X 4.6 mm) 5μm and the detector consisted of UV/VIS. Optimization of chromatographic conditions was carried out using water (pH3 with ortho phosphoric acid): acetonitrile (80:20 v/v) as mobile phase. The analysis was carried out under gradient conditions using flow rate 1.0 mLmin-1 at 180C and chromatograms were recorded at 211 nm.
Preparation of standard stock solution:
Weighed accurately 10 mg of saxagliptin and transferred to 100 ml volumetric flask, add 25 mL of mobile phase and sonicate for 15 min and volume was made up to mark with mobile phase (100μgmL−1).
Procedure for preparation of calibration curve
aliquots of the stock solution. Aliquots of 20 μL were injected (six injections) and eluted with the mobile phase under the reported chromatographic conditions. The average peak area versus the concentration of saxagliptin in μg/ml was plotted. Alternatively, the corresponding regression equation was derived using mean peak area concentration data and the concentration of the unknown was computed from the regression equation.
Preparation of Sample Solutions:
Twenty tablets of ONGLYZA were weighed and finely powdered. An accurately weighed powder equivalent to 10mg was taken to 100 mL volumetric flask and dissolved in 50 ml diluent and finally volume was made up to the mark with the diluent to obtain a concentration of 100 μgmL−1. This solution was sonicated for 10 min and filtered. Filtration is done to remove the excipients and to avoid clogging of sample applicator syringe. The amount of drug present in the sample solutions were determined using calibrated curves of standard saxagliptin in Table 3.
Method validation: 24 Accuracy and Precision:
To determine the accuracy and intra-day precision, pure saxagliptin solutions at three different concentrations were analyzed in six replicates during the same day. The same procedure was followed in different days for the inter day precision. Mobile phase was injected as blank solution before sample injection and the RSD (%) values of peak area and retention time were calculated.
Limits of Detection (LOD) and Quantification (LOQ):
The LOD and LOQ were obtained by signal to noise (S/N) ratio method. LOQ and LOD were obtained by a series of dilutions of the saxagliptin stock solution. Precision study was performed at LOQ level also. LOQ solution was injected six times and calculated the % RSD values for the obtained peak area and retention time.
Linearity:
Linearity of test solutions for the assay method was prepared from saxagliptin stock solution at nine
concentration levels from 10 to 90% of assay analyte concentration (10, 20, 30, 40, 50, 60, 70, 80 and 90μgmL−1). The peak area versus concentration data was treated by least-squares linear regression analysis. Linearity test solutions for the method were prepared by diluting stock solution to the required concentrations.
Robustness and Ruggedness:
To determine the robustness of the method the experimental conditions were deliberately changed. The flow rate of the mobile phase (1.0 ± 0.2mLmin-1), column oven temperature (25 ±2∘C),
mobile phase composition (actual ±10%), and detection wavelength (211 ± 1nm) were the varied parameters. In each case the %RSD values were calculated for the obtained peak area and retention time. The number of theoretical plates and tailing factors were compared with those obtained under the optimized conditions. Three different columns of same dimensions were used for the analyses. The studies were performed on the same day and on three different days by three different analysts for three different concentrations of saxagliptin (triplicate injections). The area obtained from each concentration was compared with that of the optimized one. The relative standard deviation values were evaluated for each concentration.
Force Degradation Studies:
All stress decomposition studies were performed at drug concentration of 10μgmL−1 in mobile phase. Acid hydrolysis was performed in 0.1M HCl at 80oC for 2 h. The study in alkaline condition was carried out in 0.1M NaOH at 80◦C for 3 h. The study in neutral condition was carried out in water at 80◦C for 3h. Oxidative studies were carried out at 80◦C and 3% hydrogen peroxide for 2 h. For photolytic degradation studies, pure drug in solid state was exposed to 1.2 million lux hours in a photo stability chamber [33]. Additionally, the drug powder was exposed to dry heat at 105◦C for 2h. Samples were withdrawn at appropriate time and subjected to HPLC analysis after suitable neutralisation and dilution.
RESULTS:
Screening: Solubility of the drug is the main criteria for any method to develop and then the UV response of the product at varying wavelengths. Saxagliptin was found soluble in an acetonitrile. A 50𝜇gmL−1 solution showed excellent response at 211nm when it was scanned from 400 to 200 nm in
[image:4.612.69.547.156.290.2]a UV spectrophotometer. In HPLC, variables such as mobile phase, buffer, temperature, sample concentration, and pH were varied by keeping one parameter (stationary phase) constant. Summarized observations are made as per the Table 1.
TABLE 1: SCREENING: SUMMARY OF METHOD SELECTION
S. no. Column Observations Remarks 1. 1. ZORBAX C18 Asymmetrical peak Not satisfactory
(250 × 4.6 mm),5𝜇m
2. ZORBAX C8 Asymmetrical peak Not satisfactory (150 × 4.6 mm),5𝜇m with tailing
3. ZORBAX Cyano Split peak Not satisfactory (150 × 4.6 mm),5𝜇m
4. Eclipse XDB-C18 Asymmetrical peak Not satisfactory (150 × 4.6 mm),5𝜇m
5. Agilent TC-C18 Symmetrical peak satisfactory (250 × 4.6 mm),5𝜇m
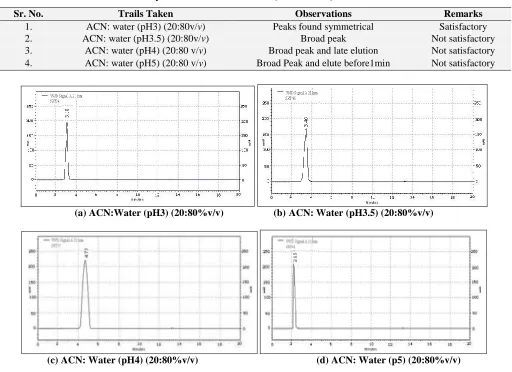
Optimisation:
Agilent TC C18 (250 X 4.6 mm) 5μm column, was found suitable and the fine tuning of the method
was performed with suitable adjustment of pH. All the trials are as shown in Table 2 and chromatograms are as shown in Fig.2.
TABLE 2: FINAL OPTIMIZATION OF pH WITH AGILENT TC C18 (250 × 4.6 MM) 5ΜM COLUMN
(a) ACN:Water (pH3) (20:80%v/v) (b) ACN: Water (pH3.5) (20:80%v/v)
(c) ACN: Water (pH4) (20:80%v/v) (d) ACN: Water (p5) (20:80%v/v)
FIG.2: METHOD OPTIMIZATION AT DIFFERENT pH CONDITIONS.
Sr. No. Trails Taken Observations Remarks
1. ACN: water (pH3) (20:80v/v) Peaks found symmetrical Satisfactory
2. ACN: water (pH3.5) (20:80v/v) Broad peak Not satisfactory
[image:4.612.52.564.368.740.2]Final Method Conditions:
Column: Agilent TC C18 (250 X 4.6 mm) 5μm, Oven temp.: 25ºC, Mobile phase: ACN: Water
[image:5.612.58.551.251.362.2](pH3 with ortho phosphoric acid) (20:80%v/v), Runtime: 10min, Flow rate: 1mL/min, Wavelength: 211nm.
TABLE 3: ASSAY DATA OF MARKETED FORMULATION
Component Formulation
Amount present
(mg)
Amount found
(mg)
% Estimated %RSD
Saxagliptin Onglyza 5 4.98 99.60 0.57
5 5.02 100.40 1.98
5 5.01 100.20 1.83
Validation of the Method:
The described method for the assay of saxagliptin was validated as per the current ICH Q2 (R1) guidelines.
TABLE 4: LINEARITY AND REGRESSION PARAMETERS WITH PRECISION DATA
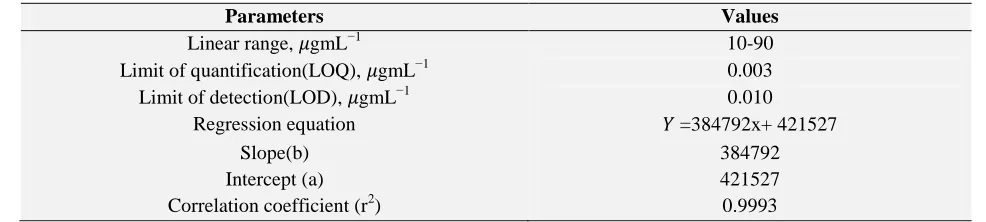
Linearity:
A calibration curve was obtained for saxagliptin stock solution. There sponse of the drug was found to be linear in the investigation concentration range from 10 to 90𝜇g mL−1 and the linear regression equation was 𝑌=384792x+ 421527 with correlation coefficient of 0.9993, where Y is the mean peak area. The LOD and LOQ values and their standard deviations were evaluated and presented in Table 4. These results confirm the linear relation between
the mean peak area and concentration as well as the sensitivity of the method.
Accuracy and Precision:
[image:5.612.46.566.663.734.2]The percentage relative error which is an index of accuracy is ≤0.259andisindicativeofhigh accuracy. The calculated percentage relative standard deviation (%RSD) can be considered to be satisfactory. The results obtained for the evaluation of precision and accuracy of the method is compiled in Tables 5 and 6.
TABLE 5: RESULTS OF ACCURACY STUDY (𝑛 = 6). Concentration
Injected (μg mL−1)
Concentration found
(μg mL−1) ± SD Recovery (%) RSD (%) SEM
10 10.01 ± 0.026 100.10 0.259 0.0086
18 18.04 ± 0.020 100.22 0.110 0.0066
20 19.99 ± 0.036 99.95 0.180 0.0120
22 22.03 ± 0.050 100.14 0.228 0.0167
TABLE 6: RESULTS OF PRECISION STUDY
Parameters Values
Linear range, 𝜇gmL−1 10-90
Limit of quantification(LOQ), 𝜇gmL−1 0.003
Limit of detection(LOD), 𝜇gmL−1 0.010
Regression equation 𝑌 =384792x+ 421527
Slope(b) 384792
Intercept (a) 421527
Correlation coefficient (r2) 0.9993
Concn
(μg mL−1) Mean area ± Repeatability (intra-day precision) SD Intermediate precision (inter-day)
(n = 3)
SEM RSD
(%)
Mean area ± SD (n = 3)
SEM RSD (%)
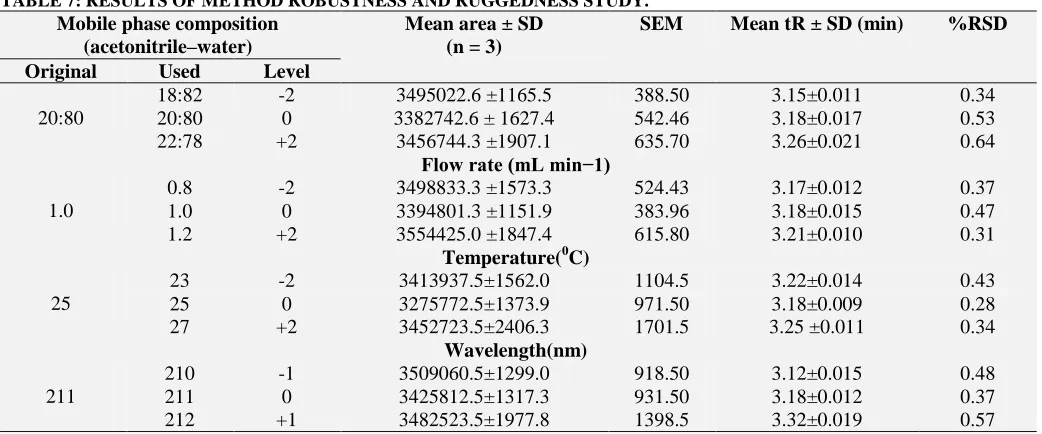
Robustness and Ruggedness:
Analytical methods need to be robust so that they can be used routinely without problems and can be easily transferred for use in another laboratory, if necessary. The intrinsic robustness of the HPLC method depends on a range of variables related to the method parameters, such as mobile phase composition (actual ±10%), flow rate (1.0 ± 0.2mL), temperature (25 ±2ºC), wavelength (211 ± 1nm), and so forth. No significant effect was observed on system suitability parameters such as
theoretical plates, tailing factor, capacity factor, and % RSD of, when small but deliberate changes were made to chromatographic conditions. The RSD values ranged from0.28 to 0.57% resume the robustness of the proposed method.
[image:6.612.48.569.223.440.2]In method ruggedness, different columns (different lots with the same manufacturer), days, and analysts (𝑛=3) were performed. There results were summarized in Table 7.
TABLE 7: RESULTS OF METHOD ROBUSTNESS AND RUGGEDNESS STUDY. Mobile phase composition
(acetonitrile–water)
Mean area ± SD (n = 3)
SEM Mean tR ± SD (min) %RSD
Original Used Level
20:80
18:82 -2 3495022.6 ±1165.5 388.50 3.15±0.011 0.34
20:80 0 3382742.6 ± 1627.4 542.46 3.18±0.017 0.53
22:78 +2 3456744.3 ±1907.1 635.70 3.26±0.021 0.64
Flow rate (mL min−1)
1.0
0.8 -2 3498833.3 ±1573.3 524.43 3.17±0.012 0.37
1.0 0 3394801.3 ±1151.9 383.96 3.18±0.015 0.47
1.2 +2 3554425.0 ±1847.4 615.80 3.21±0.010 0.31
Temperature(0C)
25
23 -2 3413937.5±1562.0 1104.5 3.22±0.014 0.43
25 0 3275772.5±1373.9 971.50 3.18±0.009 0.28
27 +2 3452723.5±2406.3 1701.5 3.25 ±0.011 0.34
Wavelength(nm)
211
210 -1 3509060.5±1299.0 918.50 3.12±0.015 0.48
211 0 3425812.5±1317.3 931.50 3.18±0.012 0.37
212 +1 3482523.5±1977.8 1398.5 3.32±0.019 0.57
Selectivity:
Selectivity of the method was evaluated by injecting the mobile phase, placebo blank, pure drug solution and tablet extract. No peaks were
observed for mobile phase and placebo blank and no extra peaks were observed for tablet extracts (Fig.3 (a) and 3 (b)).
[image:6.612.76.543.518.667.2](a) Placebo blank (b) Tablet extract
FIG. 3: CHROMATOGRAMS OBTAINED FOR PLACEBO BLANK AND TABLET EXTRACT
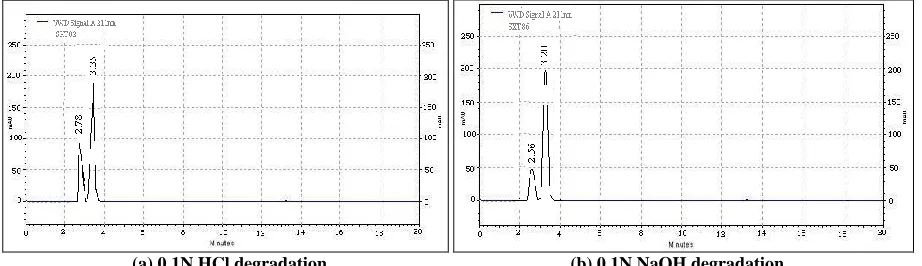
Stress Study:
The degradation was performed as per the current practice of ICH guidelines 33. Saxagliptin was found to be sensitive towards acid and alkali
degradation (water), and photolytic (1200K lux hours) conditions rather than under alkali stress conditions. No significant changes (<1%) were observed for the chromatographic responses for the solutions analyzed with other stress conditions. Following are the % degradation pattern of
saxagliptin in oxidation, thermal, neutral, and photolytic conditions: 0.12, 0.05, 0.01, and 0.32.
Fig.4 shows the degradation chromatograms of saxagliptin with the corresponding solvent as blank.
[image:7.612.77.538.148.281.2](a) 0.1N HCl degradation (b) 0.1N NaOH degradation
FIG. 4: CHROMATOGRAMS OBTAINED FOR FORCED DEGRADATION
CONCLUSION: A gradient RP-HPLC method was successfully developed for the estimation of saxagliptin in pharmaceutical dosage form. The QbD project aims to encourage debate about quality in the complete development of the drug in a systematic manner. From a solid-state point of view, QbD implementation involves the design of manufacturing processes based on a thorough scientific understanding of the properties and stability of the components of the drug at critical points throughout the development. The experimental design describes the scouting of the key HPLC method components including column, temperature, pH, and mobile phase. The inter-relationships are studied and the preliminary optimized conditions are obtained for each combination. Moreover, this approach ensures better design of products with fewer problems in development, reduces the number of trials required for post market changes, relies more on process and understanding and mitigation of risk, allows implementation of new technology to improve manufacturing without regulatory scrutiny, and enables possible reduction in overall costs of manufacturing resulting in less waste.
The validated method is specific, linear, precise, accurate, robust, rugged, and stable for 24 hours and can be applied for the determination in formulated form. The drug is stable in oxidative, thermal, photolytic and hydrolytic conditions and
degrades in acidic, basic conditions. The potential of this QbD approach lies for the simultaneous determination of multiple forms of saxagliptin like pure drug, dosage forms and thus it should be implemented.
REFERENCES:
1. International conference on Harmonisation of technical requirements for registration of pharmaceuticals for human use; Step 4ICH Q8 (R) step-2, 2009.
2. International Conference on Harmonization of technical requirements for registration of pharmaceuticals for human use, ICH harmonized tripartite guideline, Pharmaceutical Development Q8 (R1), Draft Step 4, 2008.
3. Yu LX: Pharmaceutical quality by design: product and process development, understanding, and control. Pharmaceutical Research 2008; 25(4):781–791.
4. Vogt FG and Kord AS: Development of quality-by-design analytical methods. Journal of Pharmaceutical Sciences 2011; 100(3):797–812.
5. Li Y, Terfloth GJ and Kord AS: A systematic approach to RP-HPLC method development in a pharmaceutical QbD environment. American Pharmaceutical Review 2009; 12(4): 571–583.
6. Schweitzer M, Pohl M., Hanna-Brown M: Implications and opportunities of applying QbD principles to analytical measurements. Pharmaceutical Technology 2010; 34(2):52–59.
7. Krull I, Swartz M, Turpin J, Lukulay PH, and Verseput R: A quality-by-design methodology for rapid LC method development. Part I, LC-GC North America 2008; 26(12):1190–1197.
8. Krull I, Swartz M, Turpin J, Lukulay PH and Verseput R: A quality-by-design methodology for rapid LC method development. Part II, LC-GC North America 2009; 27(1): 48– 61.
10. Kalaichelvi R and Jayachandran E: Validated Spectroscopic Method for estimation of Saxagliptin in Pure and from Tablet Formulation. International Journal of Pharmacy and Pharmaceutical Sciences2011; 3:179-180. 11. Ramalingam K and Jayachandran E: Extractive
Spectrophotometric Estimation of Saxagliptin in Pure and in Pharmaceutical Dosage Form. American Journal of Pharma Tech Research 2012; 2:429-433.
12. Ramzia I. El-Bagary, Ehab F. Elkady and Bassam M. Ayoub: Spectrophotometric Methods Based on Charge Transfer Complexation Reactions for the Determination of Saxagliptin in Bulk and Pharmaceutical Preparation. International journal of Biomedical science 2012; 8(3):204-208.
13. Jeyabalan G and Nyola N: Analytical Method Development and Validation of Saxagliptine A Novel Dipeptidyl Peptidase Iv Inhibitors In Pure And Tablet Dosage Form by UV-Vis Spectroscopy. International Journal of Institutional Pharmacy and Life Sciences 2013; 3(5):152-158.
14. Vaishali V and Anand KD: Development and Validation of a Liquid Chromatographic Method for Estimation of Saxagliptin in Tablet Dosage Form. Asian Journal of Research in Chemistry 2013; 6:552-554.
15. Inturi S, Inturi R and Kumar IT: Validated novel LC determination of Saxagliptin in pure bulk and pharmaceutical dosage forms. International Journal of Pharmaceutical Research & Development 2011; 3:845 – 52.
16. Chhabda PJ, Balaji M, Srinivasarao V, Ramakrishna K: Development and validation of simple stability indicating RP-HPLC method for analysis of saxagliptin and its forced degradation impurities in bulk drug and pharmaceutical dosage form. International Journal of Research and Development in Pharmacy and Life Sciences 2014; 3(3):993-1003.
17. Rao SP, Rama chandran D, Murali K and Srinivasu S: Stability indicating Isocratic Reverse phase HPLC Method
with PDA detector for the Estimation of Saxagliptin in bulk drugs and in its Formulation. International Journal of Pharma Sciences2013; 3(5):333-342.
18. Dayyih WA, Tamimi L, Mallah E, Mansour K, Tawfiq A, Bustami M:Saxagliptin levels and its pharmacokinetic application in presence of sucralose in animals serum by HPLC method. International Journal of Pharmacy and Pharmaceutical Sciences 2015; 7(9):243-250.
19. Serife EKT, Mustafa VK and Demet D: An HPLC Method for the Determination of Saxagliptin in Human Plasma with Fluorescence Detection. Journal of Advances in Chemistry2013; 3:810-818.
20. Salvala S, Ettireddy S, Ciddi Veeresham: Development and Validation of a High Performance Thin Layer Chromatographic Method for Quantitative Analysis of Saxagliptin. American Journal of Analytical Chemistry 2015; 6:797-806.
21. Gao J, Yuan Y, Lu Y and Yao M: Development of A rapid UPLC-MS/MS Method for Quantification of Saxagliptin in Rat Plasma and Application to Pharmacokinetic Study. Biomed Chromatography2012; 26: 1482-1487.
22. Xiaohui X, Roger D, Huidong G, Lisa J, Christophera HS and Laura C: Liquid Chromatography and Tandem Mass Spectrometry Method for the Quantitative Determination of Saxagliptin and Its Major Pharmacologically Active 5-Monohydroxy Metabolite in Human Plasma: Method Validation and Overcoming Specific and Non-Specific Binding at Low Concentrations. Journal of Chromatography B2012; 889-890:77-86.
23. Sridhar L, Goutami P, Vijay Darshan D, Ramakrishna K, Nageswara Raob Rand Prabhakar S: LC-ESI-MS/MS studies on saxagliptin and its forced degradation products. Anal. Methods2014; 6: 8212–8221.
24. International Conference on Harmonization Guideline on Validation of Analytical Procedures: Text and Methodology, Q2 (R1), 2005.
All © 2013 are reserved by International Journal of Pharmaceutical Sciences and Research. This Journal licensed under a Creative Commons Attribution-NonCommercial-ShareAlike 3.0 Unported License.
This article can be downloaded to ANDROID OS based mobile. Scan QR Code using Code/Bar Scanner from your mobile. (Scanners are available on Google Playstore)
How to cite this article: