www.wjpr.net Vol 5, Issue 6, 2016.
1402
SPECTROPHOTOMETRIC METHOD DEVELOPMENT AND
VALIDATION FOR ESTIMATION OF ENROFLOXACIN IN PURE
AND DOSAGE FORMS
R. Rajapandi1*, Aswathy S. R.2 and B. Sreedharran1 1
Nehru College of Pharmacy, Thiruvilwamala, Kerala - 680 588, India. 2
Devaki Amma Memorial College of Pharmacy, Chelembra, Kerala - 673 634, India.
ABSTRACT
Objective: A new, simple, sensitive, precise and linear two spectrophotometric methods was developed and validated for the
estimation of enrofloxacin in bulk and dosage forms. Method: The developed spectrophotometric methods based on the determination of
enrofloxacin by using bromothymol blue (Method-A) and Gibb’s
reagent (Method-B). By using bromothymol blue, the drug forms
ion-pair complex with bromothymol blue (BTB) in acidic medium. These
colored complexes were extracted with chloroform and maximum
absorbance at 418 nm. By using Gibb’s reagent, the drug forms a colored product with Gibb’s reagent in alkaline medium (pH 9.4) at 473 nm. Results: Linearity calibration curve were obtained in a concentration range of 1.0-10 µg/mL in
method A and 1.0 - 7.0 mg/mL in method-B. The results of analysis shows that the amount of
drugs present in the formulation has a very good correlation with the label claim of the
formulation and % RSD will be less than 2 for all the validation parameters. Recoveries
studies revealed that results within the specified limits. Conclusion: The simplicity of the method was found to be satisfactory and could be used for the routine analysis of
enrofloxacin in their marketed formulation.
KEYWORDS: Bromothymol blue, Enrofloxacin, Gibb’s reagent and Method development. INTRODUCTION
Enrofloxacin is a synthetic chemotherapeutic agent from the class of the fluoroquinolone
carboxylic acid derivative which was developed exclusively for use in animals.[1] Chemically
it is a 1-cyclopropyl-7-(4-ethyl-1-piperazinyl)-6-fluoro-1,4-dihydro-4-oxo-3-quinoline
Volume 5, Issue 6, 1402-1410. Research Article ISSN 2277– 7105
*Corresponding Author
Dr. R. Rajapandi
Nehru College of Pharmacy,
Thiruvilwamala, Kerala - 680
588, India.
Article Received on 29 March 2016,
Revised on 20 April 2016, Accepted on 11 May 2016
www.wjpr.net Vol 5, Issue 6, 2016.
1403 carboxylic acid. It acts by inhibiting bacterial DNA gyrase (a type-II topoisomerase), thereby
preventing DNA super coiling and DNA synthesis.[2,3] It exhibits a wide spectrum of
antimicrobial activity against Gram-negative bacteria and Gram-positive bacteria.[4,5,6]
N O
OH
N
HN
F
[image:2.595.180.413.147.267.2]O
Fig 1: Chemical Structure of Enrofloxacin
International trade in aquaculture has been growing continuously in the recent years, and is
expected to persist in the future. The variety of farmed aquatic species is now diversifying
and fish farming is intensifying. At the same time, increased incidence of disease also due to
intensive aquaculture requires a more intense use of veterinary drugs and chemicals. During
the last few years enrofloxacin has received growing attention because of its potential
efficiency for the treatment of diseases in fish.[7,8]
The extensive literature survey’s revealed that few methods have been reported for the
estimation of enrofloxacin in pure and dosage forms. There is a wide scope for the
development of new analytical methods for estimation of enrofloxacin. This research work
presents simple, sensitive, accurate and reproducible two spectrophotometric methods were
developed for the estimation of enrofloxacin in bulk and dosage forms.
EXPERIMENTAL
MATERIALS AND METHODS Instruments
An Elico model SL 164 UV-Visible double beam spectrophotometer connected to computer
loaded with spectra treats software with spectral bandwidth of 1nm with a pair of 10 mm
matched quartz cells. All weights were taken on electronic balance (Denver, Germany). All
www.wjpr.net Vol 5, Issue 6, 2016.
1404 Reagents
All chemicals and reagents were used as analytical grad. Enrofloxacin standard was obtained
as a gift sample from shasun Pharmaceuticals (puducherry, India). Enrofloxacin is available
commercially with brand names of BAYTRIL and GYROFLOX (50 mg) and were procured
from the local market.
a) Preparation of Standard Solution:
Method A: Standard stock solutions of enrofloxacin were prepared in 0.1N HCL at the concentration of 1mg/mL. (Stock - A solution)
Method B: Standard stock solutions of enrofloxacin were prepared in 0.1N NaOH at the concentration of 1mg/mL. (Stock - B solution)
b) Determination of Maximum absorbance (ʎ max) and Calibration curve Method-A
From the standard stock-A solution, Prepare 10 µg/mL with 0.1N HCL. The solution was
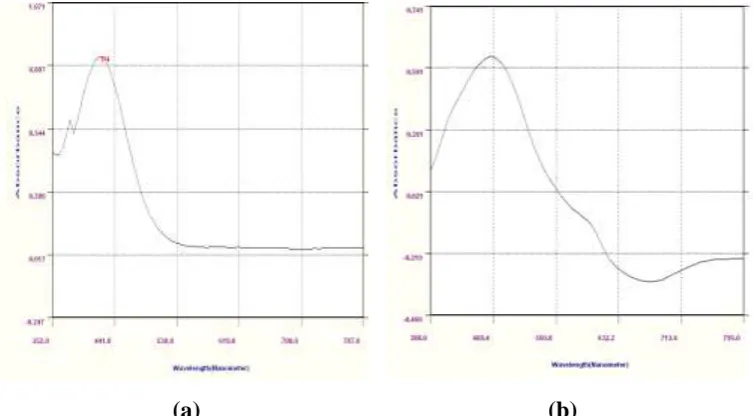
scanned in the visible range 400-800 nm. Absorbance was recorded at 418 nm [Figure 2(a)].
Prepare a series of solutions having the concentration ranging from 1, 2, 3, 4, 5, 6, 7, 8, 9 and
10 μg/mL of enrofloxacin with 0.1N HCL and each solution has shake well for 10 min with
chloroform (5 mL x 3 times), separate the chloroform layer and measure the absorbance at
418 nm, and a calibration curve of absorbance against concentration was plotted were shown
in Figure 3(a).
Method-B
From the standard stock - B solution, prepare 10 µg/mL with 0.1N NaOH. The solution was
scanned in the visible range 400 - 800 nm. The absorbance was recorded at 473 nm [Figure 2
(b)]. Prepare a series of solutions having the concentration ranging from 1, 2, 3, 4, 5, 6, 7, 8, 9
and 10 μg/mL of enrofloxacin with 0.1N NaOH. Absorbances of the above solutions were
measured at 473 nm, and a calibration curve of absorbance against concentration was plotted
www.wjpr.net Vol 5, Issue 6, 2016.
1405
[image:4.595.110.487.71.279.2](a) (b)
Figure 2: λ max of Enrofloxacin (a) using BTB reagent and (b) Gibb’s reagent.
(a) (b)
Figure 3: Calibration curve of Enrofloxacin (Method-A) and (Method-B) Procedure for the assay
Method-A
Twenty tablets of enrofloxacin were powdered and accurately weighed equivalent quantity of
250 mg and make up to 250 mL with 0.1N HCl (1000 µg/mL). From this prepare 100
µg/mL then take 1.0 mL of sample solution, add 2 mL of 0.05% w/v Bromothymol blue
(BTB) and 1 mL of phthalate buffer (pH - 2.8) make up to 10 mL by using 0.1N HCl (10
µg/ml). The above solution was transferred in to a separating funnel, add 5 mL x 3 times
chloroform and shake for 10 min. Take chloroform layer and measure the absorbance of
yellow colored products at 418 nm against blank.
Method-B
Twenty tablets of enrofloxacin were powdered and accurately weighed equivalent quantity of
[image:4.595.108.491.323.468.2]www.wjpr.net Vol 5, Issue 6, 2016.
1406 µg/mL then take 1.0 mL of sample solution, add 2 mL of 0.05% w/v of Gibb’s reagent and 2
mL of borate buffer (pH - 9.4) make up to 10 mL with 0.1N NaOH, stands for 10 min, the
absorbance of wine red colored products was measured at 473 nm against blank.
Table l: Estimation of Enrofloxacin Tablet
(brand)
Labelled amount (g)
Estimated amount (Mean ± SD, g) % Recovery % RSD
Method A Method B Method A Method B Method A MethodB
Brand A 0.05 0.0503±0.00021 0.049±0.0076 100.06% 99.0% 0.417 0.95
Brand B 0.05 0.0496±0.00048 0.05016±0.00049 99.2% 100.3% 0.967 0.976
Validation of the Method
The optimized spectrophotometric methods were validated according to the procedures
described in ICH guidelines Q2 (R1).
Linearity
The linearity of a method is its ability to obtain test results that are directly proportional to the
sample concentration over a given range. A concentration of 1, 2, 3, 4, 5, 6, 7, 8, 9 and 10
μg/mL for Method-A and 1, 2, 3, 4, 5, 6, 7, 8, 9 and 10μg/mL for Method-B have been
investigated. The relationship between absorbance and concentration was used to make this
determination. Calibration curves for each method were plotted and the obtained data were
subjected to regression analysis. The result was showed in table 6.
Precision
The reproducibility of the proposed method was determined by performing the assay for the
same day (intra-day assay precision) and on three different days (inter-day assay precision).
Precision studies in spectrophotometric methods were performed by preparing nine
determinations covering the specified range for the procedure (3 x 3 replicates for each
concentration). The results were showed in table 4 & 5.
Table 4: Precision studies for Enrofloxacin [Method-A] CONC. Ab.(Intra-day)
(mean±SD) % RSD CONC.
Ab.(Inter-day) (mean±SD)
% RSD
3µg/mL 0.2813±0.00055 0.196 3µg/mL 0.2863±0.0015 0.52
6µg/mL 0.4513±0.00059 0.174 6µg/mL 0.4553±0.0015 0.33
www.wjpr.net Vol 5, Issue 6, 2016.
1407 Table 5: Precision studies for Enrofloxacin [Method-B]
Accuracy
In order to ensure the suitability and reliability of proposed method, recovery studies were
carried out. The accuracy study was carried out by the analysis of standard additions at three
levels that is multi-level recovery studies. To a fixed equivalent quantity of formulation
powder as well as synthetic mixture, a known quantity of standard enrofloxacin added at
50%, 100% and 150% level and the contents were re-analyzed by Spectrophotometricaly.
The % recovery and % RSD were calculated. The results were showed in table 2 & 3.
Table 2: Recovery Studies for Enrofloxacin (Method A & B). Level of
addition (%) Pure drug
Con. of drug in formulations (µg/ml)
Conc. Drug of Pure (µg/ml)
Method-A Method-B Method-A Method-B
50% 6 5 3 2.5
100% 5 6 6 5
150% 5 6 9 7.5
Table 3: Statistical validation data for accuracy determination of Enrofloxacin Level of
% recovery
Mean Standard Deviation % RSD % Analytical recovery
A B A B A B A B
50% 9.027 8.976 0.0057 0.000583 0.617 0.085 100.3 99.71
100% 10.17 12.08 0.412 0.000234 0.578 0.245 101.4 100.72
150% 12.44 14.9633 0.0016 0.00146 0.012 0.123 99.94 99.73
Limit of Detection (LOD) and Limit of Quantification (LOQ)
The LOD and LOQ were separately determined based on the standard calibration curve. The
residual standard deviation of y- intercept of regression lines may be used to calculate LOD
and LOQ. LOD = 3.3*D/S and LOQ = 10*D/S where , D is the standard deviation of the
intercept of regression line and S is the slope of the calibration curve. The result was shown
in table 6.
CONC. Ab.(Intra-day) (mean±SD)
%
RSD CONC.
Ab.(Inter-day) (mean
± SD) % RSD
3µg/mL 0.221±0.00039 0.176 3µg/mL 0.2316±0.0001 0.043
5µg/mL 0.5516±0.00091 0.164 5µg/mL 0.5592±0.0043 0.768
www.wjpr.net Vol 5, Issue 6, 2016.
1408 Table 6: Calibration Data of Enrofloxacin (Method A & B)
Parameters Method-A Method-B
λmax 418.5 473nm
Linearity(µg/mL) 1-10 1-7
Correlation coefficient(r²) 0.9997 0.9999
Slope(m) 0.0722 0.1118
Intercept(c) -0.0006 -0.0025
LOD (μg/mL) 0.02 0.06
LOQ (μg/mL) 0.28 0.87
Ruggedness
The ruggedness of an analytical method is the degree of reproducibility of test results
obtained by the analysis of the same samples under a variety of conditions, such as different
laboratories, analysts, instruments. Ruggedness of the proposed methods was determined by
analysis of aliquots from homogenous slot by two analyst using same operational and
environmental conditions. The results were shown in table 7.
Table 7: Ruggedness for Enrofloxacin SL NO:
Conc. (µg/mL)
Method-A Method-B
Analyst-1 Analyst-2 Analyst-1 Analyst-2 A B Absorbance Absorbance Absorbance Absorbance 1
6 5
0.441 0.440 0.56 0.56
2 0.441 0.441 0.56 0.56
3 0.440 0.443 0.57 0.56
4 0.441 0.442 0.56 0.56
5 0.441 0.441 0.56 0.56
6 0.441 0.441 0.57 0.57
Ab.Mean 0.4406 0.4413 0.5633 0.5616
S.D 0.00049 0.00059 0.0051 0.0041
%RSD 0.111 0.135 0.6080 0.730
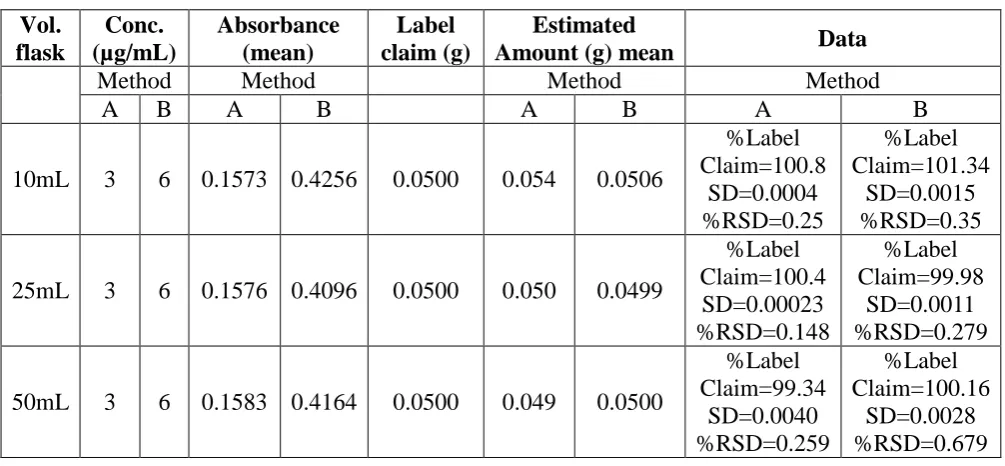
Robustness
The robustness of an analytical procedure is the measure of its capacity to remain unaffected
by small, but deliberate, variations in method parameters and provides an indication of its
reliability during normal usage. The proposed methods parameters were change of volumetric
flasks (10 mL, 50 mL and 100 mL) were performed. Three replicates were made for the same
conc. (10 μg/mL) in 10 mL, 50 mL and 100 mL volumetric flasks in spectrophotometric
www.wjpr.net Vol 5, Issue 6, 2016.
[image:8.595.47.550.88.321.2]1409 Table 8: Robustness for Enrofloxacin
Vol. flask Conc. (µg/mL) Absorbance (mean) Label claim (g) Estimated
Amount (g) mean Data
Method Method Method Method
A B A B A B A B
10mL 3 6 0.1573 0.4256 0.0500 0.054 0.0506
%Label Claim=100.8 SD=0.0004 %RSD=0.25 %Label Claim=101.34 SD=0.0015 %RSD=0.35
25mL 3 6 0.1576 0.4096 0.0500 0.050 0.0499
%Label Claim=100.4 SD=0.00023 %RSD=0.148 %Label Claim=99.98 SD=0.0011 %RSD=0.279
50mL 3 6 0.1583 0.4164 0.0500 0.049 0.0500
%Label Claim=99.34 SD=0.0040 %RSD=0.259 %Label Claim=100.16 SD=0.0028 %RSD=0.679
RESULTS AND DISCUSSION
In this proposed method, based on spectrophotometric determination of Enrofloxacin in pure
and dosage forms were developed in two methods. One was extractive spectrometric method
by using bromothymolblue and other method by using Gibb’s reagent.
Method-A
Enrofloxacin react with Bromothymolblue in acidic medium and extract with chloroform to
get a yellow colored ion-pair complex and measured the maximum absorbance at 418.5nm.
The ion-pair formation is due to Enrofloxacin contains secondary amino group which is
protonated in acidic medium, while sulphonic acid group is present in BTB, which is the only
group undergoing dissociation in the pH range 1-5. The color of such dye is due to the
opening of lactiod ring and subsequent formation of quinoid group. Finally the protonated
Enrofloxacin forms ion-pairs with the dye and extracted into chloroform.
Method-B
Enrofloxacin react with Gibb’s reagent in alkaline medium at a pH (9.4) to form a pinkish red
colour product. The maximum absorbance is measured at 473nm. Enrofloxacin having amino
group coupled with imide portion of 2, 6-dichloroquinone chloramide to get a coupled
product in alkaline medium at a pH of 9-10. The method was validated as per ICH guidelines.
Accurate results were obtained by utilizing the proposed methods for the estimation of
enrofloxacin and excellent concurrence has occurred with the results by the reported methods
www.wjpr.net Vol 5, Issue 6, 2016.
1410 method-A and 1-7 μg/ml in method-B at 473 nm. The % recovery is higher than 98 % has
found it revealed that the method is safe and free from interference of excipients which is
used in the formulation. The value of standard deviation and % R.S.D. were found to be < 2
%, showed the high precision of the method. High % recovery and low % RSD suggests that
the method can be used for the routine analysis of commercial formulations.
CONCLUSIONS
The objective of the proposed work was to develop spectrophotometric methods for the
determination of enrofloxacin, and validate the methods according to ICH guidelines and
applying the same for its estimation in marketed formulations. The proposed
spectrophotometric methods developed were found to be rapid, simple, precise, accurate and
economic for routine estimation of enrofloxacin in commercial dosage forms.
ACKNOWLEDGMENT
I would like to extent my sincere thanks to Shasun Pharmaceuticals, Pondicherry, India for
provided the pure drug to carry out this research work.
REFERENCE
1. Hooper D C and Wolfson J S, Quinolone Antimicrobial Agents 2 nd Ed, 1993, 59 - 75.
2. Brown S A, J. Vet. Pharmacol. Ther, 1996; 19: 1-14.
3. Elmas M, Tras B, Kaya S, Bas A, Yazar E & Yarsan E, Can. J. vet. Res., 2001; 65: 64 -
67.
4. Riviere J, Craigmill A L, Sundlo S F, Hankbook of comparative pharmacokinetics and
residues of veterinary antimicrobials, Boca Raton, FL, CRC Press, 1991; 339-407.
5. Prescott J F and Baggott, J D, Antimicrobial therapy in veterinary medicine, Ames, I A,
Iowa State University Press, 1993; 2: 119-26.
6. Plumb D C, Veterinary drug handbook, Pharma Vet Publishing, 1991; 520-529.
7. Richez P, Monlouis JD, Dellac D & Daube G, J. vet. Pharmacol. Therapeut, 1997; 20:
152-153.