Establishment of Efficient Algorithm for Medical
Image Diagnosis
A. Sorna Gowri
Assistant Professor, The M.D.T Hindu College, Tirunelveli
Dr. K. Ramar
Principal, Einstein Engineering College, Tirunelveli
Abstract-Breast Cancer Diagnosis and Prognosis are two medical applications pose a great challenge to the researchers. The use of machine learning and data mining techniques has revolutionized the whole process of breast cancer Diagnosis and Prognosis. Breast Cancer Diagnosis distinguishes benign from malignant breast lumps and Breast Cancer Prognosis predicts when Breast Cancer is likely to recur in patients that have had their cancers excised. Thus, these two problems are mainly in the scope of the classification problems. This study paper summarizes various reviews on breast cancer diagnosis and prognosis and about adaptive neural network current research being carried out using the data mining techniques to enhance the breast cancer diagnosis and prognosis.
Keywords: Breast cancer, classification methods, neural
network, adaptive neural fuzzy inference system
1. INTRODUCTION
Breast cancer has become the leading cause of death in women in developed countries. The most effective way to reduce breast cancer deaths is detect it earlier. Early diagnosis requires an accurate and reliable diagnosis procedure that allows physicians to distinguish benign breast tumors from malignant ones without going for surgical biopsy. The objective of these predictions is to assign patients to either a “benign” group that is
noncancerous or a “malignant” group that is cancerous.
The prognosis problem is the long-term outlook for the disease for patients whose cancer has been surgically removed. In this problem a patient is classified as a ‘recur’ if the disease is observed at some subsequent time to tumor excision and a patient for whom cancer has not recurred and may never recur. The objective of these predictions is to handle cases for which cancer has not recurred (censored data) as well as case for which cancer has recurred at a specific time. Thus, breast cancer diagnostic and prognostic problems are mainly in the scope of the widely discussed classification problems. These problems have attracted many researchers in computational intelligence, data mining, and statistics fields. Cancer research is generally clinical and/or biological in nature, data driven statistical research has become a common complement. Predicting the outcome of a disease is one of the most interesting and challenging tasks where to develop data mining applications. As the use of computers powered with automated tools, large volumes of medical data are being collected and made available to the medical research groups. As a result, Knowledge Discovery in Databases (KDD), which includes data mining techniques, has become a popular research tool for medical researchers to
identify and exploit patterns and relationships among large number of variables, and made them able to predict the outcome of a disease using the historical cases stored within datasets. The objective of this study is to summarise various review and technical articles on diagnosis and prognosis of breast cancer. It gives an overview of the current research being carried out on various breast cancer datasets using the data mining techniques to enhance the breast cancer diagnosis and prognosis.
2. DATA MINING CLASSIFICATION METHODS
The data mining consists of various methods. Different methods serve different purposes, each method offering its own advantages and disadvantages. However, most data mining methods commonly used for this review are of classification category as the applied prediction techniques assign patients to either a “benign” group that is non-
cancerous or a ”malignant” group that is cancerous and
generate rules for the same. Hence, the breast cancer diagnostic problems are basically in the scope of the widely discussed classification problems. In data mining, classification is one of the most important tasks. It maps the data in to predefined targets. It is a supervised learning as targets are predefined. The aim of the classification is to build a classifier based on some cases with some attributes to describe the objects or one attribute to describe the group of the objects. Then, the classifier is used to predict the group attributes of new cases from the domain based on the values of other attributes. The commonly used methods for data mining classification tasks can be classified into the following groups.
2.1. Decision Trees (DT’s)
A decision tree is a tree where each non-terminal node represents a test or decision on the considered data item. Choice of a certain branch depends upon the outcome of the test. To classify a particular data item, we start at the root node and follow the assertions down until we reach a terminal node (or leaf). A decision is made when a terminal node is approached. Decision trees can also be interpreted as a special form of a rule set, characterized by their hierarchical organization of rules.
2.2. Support Vector Machine(SVM)
2.3. Genetic Algorithms (GAs) / Evolutionary Programming (EP)
Genetic algorithms and evolutionary programming are algorithmic optimization strategies that are inspired by the principles observed in natural evolution. Of a collection of potential problem solutions that compete with each other, the best solutions are selected and combined with each other. In doing so, one expects that the overall goodness of the solution set will become better and better, similar to the process of evolution of a population of organisms. Genetic algorithms and evolutionary programming are used in data mining to formulate hypotheses about dependencies between variables, in the form of association rules or some other internal formalism.
2.4. Fuzzy Sets
Fuzzy sets form a key methodology for representing and processing uncertainty. Uncertainty arises in many forms in today’s databases: imprecision, non-specificity, inconsistency, vagueness, etc. Fuzzy sets exploit uncertainty in an attempt to make system complexity manageable. As such, fuzzy sets constitute a powerful approach to deal not only with incomplete, noisy or imprecise data, but may also be helpful in developing uncertain models of the data that provide smarter and smoother performance than traditional systems.
2.5. Neural Networks
Neural networks (NN) are those systems modeled based on the human brain working. As the human brain consists of millions of neurons that are interconnected by synapses, a neural network is a set of connected input/output units in which each connection has a weight associated with it. The network learns in the learning phase by adjusting the weights so as to be able to predict the correct class label of the input.
2.6. Rough Sets
A rough set is determined by a lower and upper bound of a set. Every member of the lower bound is a certain member of the set. Every non-member of the upper bound is a certain non-member of the set. The upper bound of a rough set is the union between the lower bound and the so-called boundary region. A member of the boundary region is possibly (but not certainly) a member of the set. Therefore, rough sets may be viewed as with a three-valued membership function (yes, no, perhaps). Rough sets are a mathematical concept dealing with uncertainty in data. They are usually combined with other methods such as rule induction, classification etc.
3. ADAPTIVE NEURAL FUZZY INFERENCE SYSTEM
(ANFIS)
Adaptive Neural Fuzzy Inference System (ANFIS), proposed by Jang in 1993, is a combination of two machine learning approaches: Neural Network (NN) and Fuzzy Inference System (FIS) .Some of the earlier work on ANFIS was done by Übeyli who aimed to integrate adaptive neural fuzzy inference system (ANFIS) for breast cancer diagnosis. The author used a database of patients with known diagnosis (i.e. supervised learning). The ANFIS classifier was trained with a set of records for nine examined features for breast cancer, and then was used to
diagnose new cases. The system combined between neural network and it is ability of learning and fuzzy modeling approach. The performance of Übeyli’s ANFIS-based model showed a promising results and underlined it is capability to diagnose the disease with 98% classification accuracy. Motivated by this work, to adapt the ANFIS based data mining technique with a pre-processing stage involving Information Gain Method (IG), with expectation that the method can enhance the classification accuracy for breast cancer datasets. The details of ANFIS, IG structure, and experimental validation are described in next few Sections.
3.1 ANFIS Structure
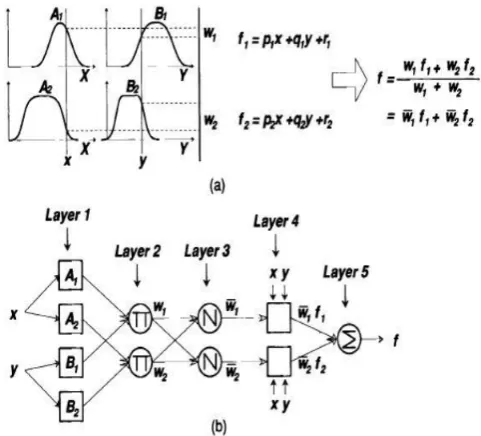
ANFIS exploit the advantages of NN and FIS by combining the human expert knowledge (FIS rules) and the ability to adapt and learn (NN) .For simple illustration, suppose the fuzzy system contains two Sugeno fuzzy rules: 1: 1 1,T = 1 + 1 + 1
2: 2 2, = 2 + 2 + 2
ANFIS learns first the structure and then learns the parameters.Structure-learning includes space classifying of fuzzy input and rule-extracting.According cliustering is done by extracting a set of rules that models the data behaviour to classify the training sample space.If the space is clustered into ni
Classes,then there will be corresponding ni,fuzzy
rules.Hence,initial input parameters of membership functions for each class are determined by the clustered centered coordinates and its radius length.
Figure 1 (a) shows the fuzzy reasoning and Figure 1 (b) shows the corresponding structure of ANFIS In Figure 1 (b), the node function in each layer is as the following : Layer1: Each node (represented by a square) in this layer
accepts input and computes the membership μAi (x) .
1= ( ) (1)
quantifier .Usually ( ) is chosen to be bell-shaped with values between 0 and 1, such as the generalized bell function:
( ) = [− ( / )2 ] (2)
Layer2: Every node in this layer (represented by a circle)
takes the corresponding outputs from Layer 1 and multiplies them to generate a weight:
= ( )× ( ), =1,2 ( 3)
The output of this node represents the firing strength of the rule.
Layer3: Every node in this layer is a circle node labeled N.
This layer normalize the weight of a certain node in compare to the sum of other nodes weights (The ration of weight) then compute the implication of each output member function.
i = wi / ∑j j , =1,2. =2 (4)
Layer 4: Everynode in this layer is illustrated
with a square. Based on sugeno inference system The output of a rule can be written on the following linear format.
= = ( + + ) (5)
Layer 5: This layer called the aggregation layer, which
computes the summation of rules, the proposed algorithm produce a single output (centroid):
= u = ∑I =∑ / ∑i (6)
3.2 ANFIS Learning
The method to train ANFIS is the hybrid learning algorithm which uses the gradient descent method and Least Square Estimate (LSE). Each cycle of the hybrid learning consists of a forward pass and a backward pass. In the forward pass the signal travels forward until Layer 4 and the consequent parameters are identified using the LSE method. In the backward pass the errors are propagated backward and the premise parameters are updated by gradient descent. The process repeated until achieving the lowest error or a predefined threshold[22]
3.3 Information Gain
The information gain method was proposed to approximate quality of each attribute using the entropy by estimating the difference between the prior entropy and the post entropy .This is one of the simplest attribute ranking methods and is often used in text categorization. If is an attribute and is the class, the following equation gives the entropy of the class before observing the attribute:
( ) = −∑x ( ) 2 ( ) (7)
Where( ) is the probability function of variable . The conditional entropy of given (post entropy) is given by:
( | ) =−∑x ( )∑c P( | ) 2 ( | ) (8)
The information gain (the difference between prior entropy and postal entropy)is given by the following equations
H( , )= ( ) − ( | ) (9)
( , )
=−∑c ( ) 2 ( )−∑x( − ( )∑c ( / ) 2 ( | )(10)
3.4 Proposed IG-ANFIS approach
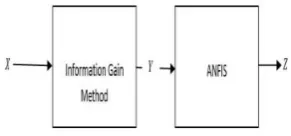
The proposed approach is to combine the information gain method and ANFIS method for diagnosing diseases (in this case; breast cancer). The information gain will be used for selecting the quality of attributes. The output of applying the information gain method is a set of features with high ranking values, the set of high ranked features will be the input for ANFIS. The selected features will be applied to ANFIS to train and test the proposed approach. The structure of the proposed approach is shown in Figure2, where X={x1,x2,..,xn}are the original features in dataset, Y={y1,y2,..,yk}are the features after applying the information gain (features selections), and Z denotaed to the final output after applying Y on ANFIS(diagnose).
Figure 2: The general structure for the proposed approach 3.5 The Experimental Results
The database, Wisconsin Breast Cancer Dataset (WBC), have been created by William Wolberget al. from the University of Wisconsin-Madison, USA. The database attributes were collected from digital fine needle aspirate (FNA) of breast mass. WBC contains 699 records. Each record consists of 9 features plus the class attribute. In our experiment, the database was divided into training and testing datasets. 341 records used for training and 342 records for testing. The records which contain missing values (16 records) have been ignored. The class attributes have been normalized to [0=Benign, 1=Malignant]. The information gain method has been used to select the quality of attributes. Table 10 shows the ranking of attributes after applying the attribute evaluator InfoGainAttributeVal and the searching method Ranker-T-1 using WEKA on WBC dataset.
Table 1: Information Gain Ranking Using WEKA on
WBC
Attribute Name Rank
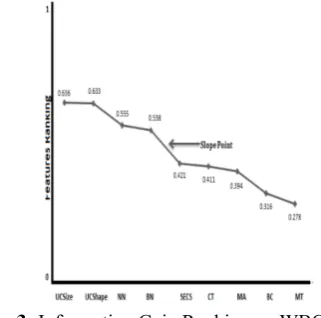
and a point where the rank is dropped significantly. Figure 3 shows the graph of Table 1. It shows the most significant
change in the graph (the slope point) which gave us an indication to choose the first four top ranking features located above the slope point as the recommended number of features to be used later as inputs to ANFIS. The graph shows the biggest drop just after the feature number 4 (BN). Therefore, features Uniformity of Cell Size (UCSize), Uniformity of Cell Shape (UCShape), Normal Nucleoli (NN), and Bare Nuclei (BN) are selected to train and test the model. At this stage, the attributes have been deducted and the recommended number of features has been set to 4 features.
Figure 3: Information Gain Ranking on WBC.
The first stage was to select the most important features that may lead to more accurate results as mentioned earlier. The second stage is to construct the fuzzy inference system (FIS). The most known fuzzy inference systems are Mamdani-FIS and Sugeno-FIS. Mamdani-FIS method is widely used to obtain expert knowledge. It allows users to describe the expertise as a simulation to the real life and nature. However, Mamdani-FIS is computationally expensive. On the other hand, Sugeno-FIS method is computationally efficient and works well with optimization and adaptive techniques.
In our proposed approach, Sugeno Fuzzy Inference system has been used to maps feature to feature membership functions, feature membership function to rules, rules to a set of output, output to output membership functions, and the output membership function to a single-valued output as shown in Figure 4. The membership function maps input with a membership values as shown in Figure 5.
Figure 4 Sugeno Fuzzy Inference System with four features input
and single output
In addition to the membership function, FIS contains the rules that add human reasoning capabilities to machine intelligences, which are usually based on Boolean logic. In our proposed approach, the rules have been defined from the real data. The rules express the weight of each feature by giving higher priority for features that have the highest rank. The proposed approach contains 81 rules (Number of rules = where is the Number of member functions and is the number of features i.e.34=81 rules). The following are two examples of rules used in the proposed approach:
IF AND(Uniformity CellSize is poor, Uniformity CellShape is Avg, BareNuclei is poor, Normal Nucleoli is poor)THEN(output is OK)
IF AND(UniformityCellSize is poor, Uniformity CellShape is high, Bare Nuclei is poor, Normal Nucleoli is avg)THEN (output is NOT_OK)Figure 5 is a visual implementation for
the rule Uniformity Cell Size. It contains three member functions: poor, average, and high.
Figure 5: Input Membership Function for the feature
“Uniformity of Cell Size”
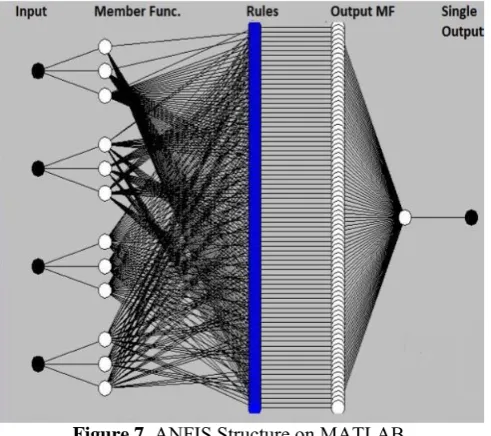
In the third and final stage, the constructed Fuzzy Inference System and the new features set were loaded to ANFIS which will train and test the proposed approach as shown in Figure 6. The structure of ANFIS on MATLAB is shown in Figure 7
Figure6: The structure for the proposed approach
(IG-ANFIS)
Table2: Comparison of classification accuracy between
IG-ANFIS and some previous work .
* The approach Accuracy
Figure 7 ANFIS Structure on MATLAB
The result of applying ANFIS on the features selected using the information gain on WBC dataset showed 98.24% accuracy. The results of previous work (using the same dataset) are shown in Table 2 .
4. CONCLUSION:
A new approach for diagnosing breast cancer by reducing the number of features to the optimal number using the information gain and then apply the new dataset to the Adaptive Neuro Fuzzy Inference system (ANFIS). The study found that the accuracy for the proposed approach is 98.24% compared with other methods. The proposed approach showed a very promising results which may lead to further attempts to utilise information technology for diagnosing patients. Overall, the results show that IG-ANFIS can be applied successfully to medical diagnosis problems. IG-ANFIS were able to consistently achieve 98.24% success in the breast cancer diagnosis test. The success rates achieved were dependent on the structure of the network and the training algorithm used. The results depend more heavily on the actual data used for the diagnosis. The process of selecting the right inputs to be used and validity of the measurements has a greater impact on the effectiveness of these diagnosis tools than structural or algorithmic factors.
REFERENCES
1. Langdon JD, Russel RC, Williams NS, Bulstrode CJK Arnold, Oral and Oropharyngeal cancer practice of surgery, London: Hodder Headline Group; 2000.
2. K.A. Dinshaw and B. Ganesh, Annual Report 2002-2005, Hospital based cancer registry, Tata Memorial Hospital, 2008
3. Willium GS, Hine MK, Levy BM, A text book of oral Pathol. 4th ed. Philadelphia: W.B. Saunders Company
4. Warren S, Biopsy in relation to tumour diagnosis, 4th ed. Boston: American Cancer Society, Mass Deviation; 1968.
5. Fayyad, U. M., Piatetsky-Shapiro, G. & Smyth, P. (1996a). From Data Mining to Knowledge Discovery: An Overview. In Fayyad, U. M., Piatetsky-Shapiro, G., Smyth, P. & Uthurusamy, R. (eds.) Advances in Knowledge Discovery and Data Mining, 1–36. AAAI Press/MIT Press
6. Fayyad, U. M., Piatetsky-Shapiro, G. & Smyth, P. (1996b). From Data Mining to Knowledge Discovery in Databases. AI Magazine 17(3): 37–54
7. Khosla, R. & Dillon, T. (1997). Knowledge Discovery, Data Mining and Hybrid Systems. In Engineering Intelligent Hybrid Multi-Agent Systems, 143–177. Kluwer Academic Publishers.
8. Nikhil Sureshkumar Gadewal, Surekha Mahesh Zingde, Database and interaction network of genes involved in oral cancer: Version II, Bioinformation 6(4): 169-170 (2011)
9. Jin Oh Kang, Suk-Hoon Chung, Yong-Moo Suh et. al. Prediction of Hospital Charges for Cancer Patients with Data Mining Technique. J Kor Soc Med Informatics 2009;15(1):13-23
10. Bellaachia and Erhan Guven, Predicting Breast Cancer Survivability using Data Mining Techniques. Ninth Workshop on Mining Scientific and Engineering Datasets in conjunction with the Sixth SIAM International Conference on Data Mining (SDM 2006), Saturday, April 22, 2006.
11. Delen D, Walker G, Kadam A. Predicting breast cancer survivability: a comparison of three data mining methods. Artificial Intelligence in Medicine. 2005 Jun; 34(2):113-27.
12. Arihito Endo et. al. [15] Comparison of Seven Algorithms to Predict Breast Cancer Survival. Biomedical Soft Computing and Human Sciences 2008 ; 13(2) : 11- 16
13. Shantakumar B. Patil and Dr. Y.S. Kumaraswamy. Extraction of Significant Patterns from Heart Disease Warehouse for Heart Attack Prediction. IJCSNS International Journal of Computer Science and Network Security February 2009 ; VOL.9 No.2
14. Shantakumar B. Patil and Dr. Y.S. Kumaraswamy [2009] Intelligent and Effective Heart Attack Prediction System Using Data Mining and Artificial Neural Network, European Journal of Scientific Research 2009; ISSN 1450-216X Vol.31 No.4 : 642-656
15. DSVGK Kaladhar, B. Chandana and P. Bharath Kumar, “Predicting cancer survivability using Classification algorithms”, International Journal of Research and Reviews in Computer Science (IJRRCS) Vol.2, No.2, pp 340 – 343, April 2011.
16. Werning, John W (May 16, 2007). Oral cancer: diagnosis, management, and rehabilitation. p. 1. ISBN 978-1588903099. 17. http://www.oralcancerfoundation.org/facts/index.htm
18. Jemal A, Thimas A, Murray T, Thun M. Cancer statistics, 2002. CA Cancer J Clin 2002; 52:181-2.
19. Woolgar JA, Scott J, Vaughan ED, Brown JS, West CR, Rogers S. Survival, metastasis and recurrence of oral cancer in relation to pathological features. Ann R Coll Surg Engl 1995;77:325-31. 20. E. Allegra, N. Lombardo, L. Puzzo1, A. Garozzo, The usefulness of
toluidine staining as a diagnostic tool for precancerous and cancerous oropharyngeal and oral cavity lesions, ACTA oto rhinolaryngologica italica 2009;29:187-190
21. Crispian Scully, Jose.V. Bagan, Colin Hopper, Joel. B. Epstein, “Oral Cancer: Current and future diagnostics techniques – A review article”, American Journal of Dentistry, Vol. 21, No.4, pp 199 – 209, August 2008.
22. Jang,R. and J.Shing,ANFIS:Adaptive-Network-based Fuzzy Inference system.IEEE transactions on systems,1993.23(3):p.665-685.