Improving Capacity in LMDS Networks
Using Trellis-Coded Modulation
Ranjan Bose
Department of Electrical Engineering, Indian Institute of Technology (IIT) Delhi, Hauz Khas, New Delhi 110016, India Email:[email protected]
Received 23 January 2004; Revised 5 July 2004; Recommended for Publication by Jonathon Chambers
Local multipoint distribution systems (LMDS), which are operating worldwide in the frequency range of 26 to 43 GHz, have large bandwidths of 0.1 up to 2 GHz but a limited area coverage of a few kilometers only. This is due to line-of-sight (LOS) constraints for reliable point-to-multipoint links as well as due to large propagation losses. The size of the macrocells illuminated by the base stations, where LOS exists, is approximately 1 to 5 km. As suggested in the CRABS report (1999), the maximal spectral efficiency can be obtained with a dual frequency and polarization reuse plan. This frequency and polarization reuse leads to interference. In this paper, we report a new technique that uses trellis-coded modulation (TCM) for increasing the capacity of LMDS networks. Analytical expressions have been derived for pairwise error probability for both high and low SNR scenarios. Numerical simulations have shown that using the proposed TCM schemes in cochannel cells have resulted in a large decrease in interference, thereby allowing us to reduce the frequency reuse distance. In this paper, we present the strategy using two TCM schemes that allow the frequency reuse factor of unity, without compromising on the QoS caused by increased interference. Design rules for constructing TCM schemes are also proposed in this paper.
Keywords and phrases:broadband wireless access, trellis-coded modulation, cochannel interference, interference mitigation.
1. INTRODUCTION
Broadband radio access systems operating at millimeter waves, often called local multipoint distribution systems (LMDS), are currently being developed in the 26–43 GHz frequency range, having bandwidths of 0.1 up to 2 GHz [1,2,3,4]. LMDS are local cellular point-to-multipoint radio systems, delivering broadband services from a central trans-mitter or base station (BS) tofixedcustomer stations (CS) mounted on individual buildings, blocks of apartments, or buildings of residential as well as business customers within its cell size [5] (http://www.iec.org/online/tutorials/lmds/). These broadband radio access systems offer rapid infras-tructure deployment and the ability to provide local con-tent. They can be significantly cheaper to install than a ca-ble system since only customers requesting LMDS are pro-vided with terminals (extension on demand). As a result of the propagation characteristics of signals in this frequency range, LMDS systems use a cellular-like network architec-ture, though services provided are fixed, not mobile. In the United States, 1.3 MHz of bandwidth (27.5–28.35 GHz, 29.1–29.25 GHz, 31.075–31.225 GHz, 31–31.075 GHz, and 31.225–31.3 GHz) has been allocated for LMDS to de-liver broadband services in a point or point-to-multipoint configuration to residential and commercial cus-tomers [5]. The 42 GHz LMDS band proposed in Europe
provides 2 GHz of bandwidth. Rain attenuation and line of sight (LOS) play an important role at these frequencies [6,7]. The capacity needed by each user has also increased over time as new services have been developed and this is likely to con-tinue. The parameters for the traditional LMDS, suggested in the CRABS report (Telenor scheme) [8], uses two frequen-cies and two polarizations (vertical and horizontal) and cells which are essentially square.
H1 H1 H2 H2 H1 H1 BS(−2, 2) BS(0, 2)
BS(−4, 2) BS(2, 2)
H1 H1 H2 H2 H1 H1
CS
L
BS(−4, 0) BS(2, 0)
BS
V1 V1 V2 V2 V1 V1
BS(−2, 0) BS(0, 0)
V1 V1 V2 V2 V1 V1
L2
Cell radiusR
BS(−4,−2)
H1 H1 H2 H2 H1 H1
BS(−2,−2) BS(0,−2) BS(2,−2)
H1 H1 H2 H2 H1 H1
BS(−2,−4) BS(0,−4)
BS(−4,−4) BS(2,−4)
Figure1: Dual frequency and polarization reuse plan as suggested in the Telenor scheme of the CRABS report [8]. The circles in the figure denote the position of the base stations, on which four 90◦-sectoral horn antennas are mounted.
The specific TCM schemes are given in Section 5and the results from numerical simulations are also presented. In Section 5we also compare the proposed scheme to the ex-isting one, and discuss the trade-offs. The paper concludes in Section 6.
2. SYSTEM DESCRIPTION
We have used the scheme suggested by Telenor in the CRABS report [8], as shown inFigure 1. The maximal spectral ef-ficiency is obtained with a dual frequency and polarization reuse plan as shown, where the macrocells are square in shape. For this architecture, the cochannel cells appear in the fifth tier. “H1” implies that the cell uses horizontal po-larization, frequency 1, V1 implies vertical popo-larization, fre-quency 2, and so forth. The locations of the base stations are marked by circles. The half-power beamwidth (HPBW) of the transmitter at the BS is 90◦, thus leading to cells that are square in shape. The receivers are usually parabolic dish an-tennas mounted on the rooftop of the customers with a nar-row HPBW of 2◦–5◦. In the figure, BS(0,0) is the desired base station for the CS. The interfering BS is BS(−4,−4). The cus-tomer antenna, though looking at its own BS(0, 0), picks up interference from BS(−4,−4).
The LOS interference calculations are done based on a H-plane or E-plane sectoral horn antennas for the trans-mitter at the base stations, providing horizontal and verti-cal polarization, respectively. The transmitter antennas have a HPBW approximately equal to 90◦. The receiver anten-nas of the subscribers are assumed to have a circular aper-ture with a parabolic taper on pedestal with a 10 dB edge illumination, having high gain between 30–40 dB with a very narrow HPBW of 2◦–5◦ for a diameter of about 10 to 24 cm.
The carrier-to-cochannel interference (C/I) ratio has been calculated for LOS under clear weather conditions with-out any power control strategy using
C/Id1,d2,p
=[EIRPD−EIRPI] +
GR(0)−GR(θ)
−Lfs
d1
−Lfs
d2
−Acs
d1
−Acs
d2
−Af
d2,p
(dB),
(1)
where EIRPDand EIRPIare the equivalent isotropic radiated
powers of the desired and interfered signals at the customer location,GR(θ) is the receiver antenna gain at an angleθoff
the boresight,Lfsis the free space path loss,Acsis the attenua-tion during clear sky,Af is the short-term enhancement due
to atmospheric multipath and focussing effects,pis the time percentage for whichAf exceeds a certain value [12,13],d1 andd2are the distances in km from the BS of the desired and cochannel cell, respectively. At 42 GHz,Acs has been taken as 0.2 dB/km [14]. The short-term enhancement due to at-mospheric multipath and focussing effects,Af, is determined
using the formula [12]
Af =2.6
1−e−d2/10log
10
p
50 (km). (2)
3. THE PROPOSED IDEA
HT1 HT1 HT2 HT2 HT1 HT1
BS(0, 2) BS(0, 2)
HT1 (1, 5)
HT1 HT2
(3, 5)
HT2 HT1
(5, 5) HT1
BS(2, 0) BS(−4, 0)
VT1 VT1 VT2 VT2 VT1 VT1
BS(−4,−2)
BS(0, 0)
VT1 (1, 3)
VT1 VT2
(3, 3)
VT2 VT1
(5, 3) VT1
HT1 HT1 HT2 HT2 HT1 HT1
BS(0,−2)
HT1 (1, 1)
HT1 HT2
(3, 1)
HT2 HT1 HT1
BS(0,−4) BS(−4,−4)
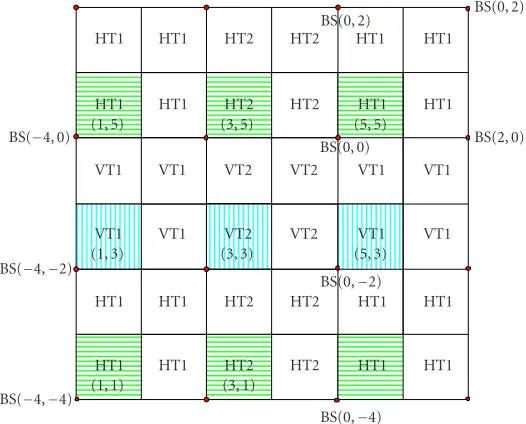
Figure2: Frequency, polarization, and TCM scheme planning (1F2P2T).
Note that in this figure we are using one coordinate scheme for BS and another one to label the cells. These TCM schemes are so designed that the sequence of symbols generated by one trellis isrejectedby the other. As a result of the coding gain, the effective CCI will be reduced.
As is clear fromFigure 2, we have only one frequency and two polarizations. Consider cell (5,5). It will get CCI from all “H” cells, that is, cell using the horizontal polarization. The closest cells using horizontal polarization are (1,5), (3,5), (3,1), (5,1), and (1,1). In the Telenor scheme, the cochannel cells of the first tier were only (1,5), (5,1), and (1,1). Con-sidering a receiver antenna beamwidth of 5◦at 42 GHz, the different areas in the cell experiencing interference are given inTable 1[15,16,17].
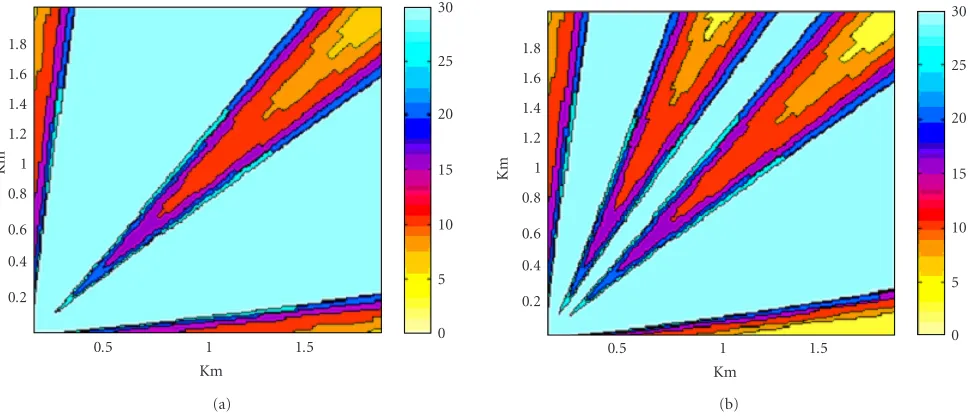
Figure 3ashows the interference levels within the cell for the Telenor scheme (2F2P). The figure is color coded. The regions depicted in light shades of gray represent C/I above 30 dB while the regions in dark shades of gray represent high interference levels. Due to the directional receiver antenna at the customer location, we find the high interference regions in the cell appearing as wedges. The figure shows that certain areas within the cell are bad in terms of the CCI. Since this is a fixed wireless communication scenario, these interferences affected regions will remain so. Figure 3b depicts the sce-nario where the frequency reuse distance has been reduced. As expected, the reduction of two frequencies to one, that is, (2F2P) to (1F2P), has resulted in higher interference levels, leading to an increase in the areas within the cell with low C/I. We observe a drastic increase in the percentage of cell area experiencing interference, as shown by the figures and Table 1.
For the sake of illustration, we say that the satisfactory performance requires the symbol error rate, Psym ≈ 10−5. Suppose the modulation scheme to be used is 8-PSK. If gray coding is used to assign codewords to the symbols, the bit
er-ror rate,Pe ≈Psym/log2(M), whereM =8 for PSK. So, 8-PSK cannot be used in those regions within the cell where the C/I<10 dB [18]. This implies that for the Telenor scheme, approximately 5.48% of the area of the cell will have unsat-isfactory quality of service (QoS) (seeTable 1). On the other hand, for the single-frequency, two-polarization scheme, we have more than 10% area with unsatisfactory QoS (i.e., C/I
<10 dB). To mitigate the higher interference level, we would use TCM in combination with PSK. We will call this 8-PSK/TCM. It will be shown inSection 5that this scheme low-ers thePsym, thus reducing the areas within the cell with poor QoS. Besides, this strategy requires less bandwidth without compromising on the QoS.
1.8 1.6 1.4 1.2 1 0.8 0.6 0.4 0.2
0.5 1 1.5
30 25 20
15 10 5 0 Km
Km
(a)
1.8 1.6 1.4 1.2 1 0.8 0.6 0.4 0.2
0.5 1 1.5
30 25 20
15 10 5 0 Km
Km
(b)
Figure3: Color-coded areas within the cell that experience C/I levels below a specified level for CCI. The units of the color bar is in dB. (a) 2 frequencies, 2 polarizations (2F2P); (b) 1 frequency, 2 polarizations (1F2P).
Table1: Areas within the cell that experience different levels of CCI.
C/I value Area within the cell (%)
Telenor scheme (2F2P) 1 frequency, 2 polarization
Below 8 dB 1.37 3.77
Below 10 dB 5.48 10.10
Below 15 dB 15.14 24.09
Below 20 dB 22.24 34.07
Below 25 dB 27.33 41.76
Below 30 dB 29.87 45.04
Above 30 dB 70.12 54.95
been explored in [9]). The best we can do is to design the two TCM schemes in such a manner that they mutually re-ject each other’s signals (in the same way as noise is rere-jected). It should be noted here that we do need two TCM schemes. FromFigure 2it is clear that four colors (HT1, HT2, VT1, VT2) are needed for the polarization-code planning. If we just use one TCM scheme, we willnot be able to reject the CCI in all the cochannel cells.
4. DESIGN CRITERIA FOR TCM FOR LMDS
In this section we develop the design rules for the construc-tion of TCM schemes for the LMDS architecture. As depicted inFigure 1, the CS receives signal both from the desired BS as well as the interfering BS. Consider the received signal at a certain CS
r(t)=a(t)s(t) +b(t)u(t) +n(t), 0≤t≤T, (3)
where a(t) is the attenuation for the desired signal,b(t) is the attenuation for the interfering signal,n(t) is the additive
white Gaussian noise with a two-sided spectral density of
N0/2,s(t) = N−1
n=0 snφn(t) are the symbols of the MPSK in
theN-dimensional signal space generated by the desired BS, andu(t) =N−1
n=0 unφn(t) are the symbols generated by the
interfering BS. Here,φn(t),n=0, 1,. . .,N−1, represent the
N orthonormal functions andsnandunare the projections
ofs(t) andu(t) onto the functionφn(t), respectively, that is,
sn= T
0 s(t)φ∗n(t)dtandun= T
0 u(t)φ∗n(t)dt.
Since this is a fixed broadband wireless access scenario, botha(t) andb(t) can be assumed to have a constant enve-lope and phase over the interval 0≤t≤T. Hence (3) can be expressed as
r(t)=as(t) +bu(t) +n(t), 0≤t≤T. (4)
We assume that the receiver performs coherent detection [10]. For the coherent demodulator block (Figure 4), the in-tegrator outputs, that is,
rj= T
0 r(t)φ
∗
×
Figure4: Block diagram of the coherent demodulator.
constitute the components of a random vector r = (r0,
r1,. . .,rN−1). For the given (fixed) receiver location, from (4)
Assuming thatn(t), hencen, is statistically independent ofsandu, it can be seen from (6) thatris a random vector whose components{rj}are statistically independent
Gaus-sian random variables with meanE[rj]=asj+bujand
vari-anceN0/2. Hence, we can write the conditional density ofr, given the attenuationsaandb, and the transmitted signals
andu, as follows:
We have assumed here that channel state information is avail-able. This is a fair assumption as this is a fixed broadband wireless access scenario and it is easy to measure the channel parameters.
Next, consider the discrete time model for the system as shown in Figure 5. Here, we use TCM 1 to encode the bit stream from the desired BS. The decoding is done using the Viterbi decoding where asequence of symbolsis taken for the purpose of decoding. Let the input bits be encoded by the TCM 1 to produce a sequence of signalssl =(s1,s2,. . .,sl),
where each signal sk is a two-dimensional vector chosen
from an MPSK signal set. Here the subscript “k” denotes the symbols in different time instances. Similarly, let ul =
(u1,u2,. . .,ul) represent the sequence of signals generated
in the interfering cell, where each signal uk is also a
two-dimensional vector chosen from the same MPSK signal set. The cell under consideration and the interfering cell differ in the TCM schemes deployed in the respective cells. Since the receiver performs coherent detection, the received signal at timekcan be written as
rk=ask+buk+nk, (8)
whereais the attenuation for the desired signal,bis the at-tenuation for the interfering signal, andnkis the sample of a
zero-mean complex Gaussian noise process. For a given cell,
Desired cell
Figure5: The baseband discrete time model for the system.
bothaandbare random variables, the values of which de-pend on the location of the receiver (CS) inside the cell. We now calculate the pairwise error probabilityP2(sl,ˆsl) [10]. As
mentioned before, we assume that a maximum likely decoder is being used (Viterbi decoding) and the channel state in-formation is available. The metric related to the conditional channel probabilities is given by m(rl,sl) = lnpN(rl|sl,ul)
[11]. Using (7), the decoding metric can be written as
mrk,sk;a,b
= −rk−ask−buk2, (9)
where the variance factorN0/2 is discarded since it is inde-pendent of the transmitted signal and has no bearings on the decoder decision.
The pairwise error probability is given by
P2
The conditional pairwise error probability can be upper-bounded by using the Chernoffbound as
P2
whereηis the Chernoffparameter. From (8) and (11) we can write
We observe that the right-hand side of (13) is independent ofb. Intuitively, this can be explained as follows. Viterbi de-coding of a TCM scheme chooses the most likely path in the trellis, given the received signal. An error occurs when an incorrect path is decoded as the most likely path instead of the correct path in the trellis. The presence of the interfering signal equally hampers the decision process for the correct path (corresponding to sl) as well as the wrongly decoded
path (corresponding toˆsl). Thus the pairwise error
proba-bility (the probaproba-bility of choosingˆsloversl) is independent
ofb.
To determine the pairwise probability for the entire cell, we need to average over the probability density function (pdf) ofa, which is calculated as follows.
Probability density function ofal
We approximate the region of interest by a quarter within the square LMDS cell as shown inFigure 6.Rminis the mini-mum distance from the desired BS where a customer site can be located andRis the length of the side of the square cell (cell radius). The received power at the customer site can be written as [19]
PR=PTGTGRAcsλ 2
4π22Ld2 , (14)
wherePTis the transmit power,GTis the transmitter antenna
gain,GRis the receiver antenna gain,λis the wavelength,dis
the distance between the transmitter and receiver,Acsis the clear sky attenuation, and Lis the system loss factor. Next, define the attenuation factora=PR/PT =K2/d2, where
The cumulative distribution function is given by
Pr[a≤A]=1−Pr[a > A]
The pdf of acan be easily obtained by differentiating (16) with respect toA[20]:
pA(a)=
From (13), we can write the expression for the pairwise error probability as
Figure6: Approximation of the square LMDS cell.
The Chernofffactor,C(sk, ˆsk), can be written as
Combining (17) and (19) and simplifying, we obtain
Csk, ˆsk error probability is given by
P2
s0,s4,s2,s6
Figure7: The two TCM schemes employed in the cochannel cells.
Pairwise error probability for low SNR
For the low SNR scenario, we assume δ2
k(K2/R2min) 1.
It may be recalled that δ2
k is a measure of the SNR and
(K2/R2
min) represents the maximum attenuation value (i.e., the largest possible value ofai) for the desired signal. Using
the approximationse−x ≈ 1−x and erf(x) ≈ 2x/√π for
x1, equation (21) can be simplified to
P2
If we represent the maximum attenuation value within the cell byamax=(K2/R2min) and the minimum attenuation value
where the sum of the squared Euclidean distance,d2
E(leff)=
l
k=1,sk=sˆk|sk−sˆk|
2andl
effis the effective length of the error event. Thus, the design rule for the low SNR scenario is to maximize the minimumd2
E(leff).
Pairwise error probability for high SNR
For the high SNR case, we assumeδ2
k(K2/R2) 1. Using the
assumption that erf(x)≈1−(e−x2
/√πx)(1−1/2x2) forx 1 and neglectingR2
mine−δ
2
k(K4/R2min)with respect toR2e−δk2(K4/R4),
equation (21) can be simplified to
P2
Defining the product of the squared Euclidean distance,
d2
equation (24) can be written as
P2
Thus, the design rule for the high SNR scenario is to maxi-mizeboththe minimumd2
E(leff) and the minimumd2P(leff).
5. NUMERICAL SIMULATIONS
In this section we discuss the proposed TCM schemes and the results obtained by numerical simulations. We propose a 4-state, fully connected trellis followed by a mapper. The TCM schemes for the cochannel cells are shown inFigure 7. The labels of the branches are written on the left. For exam-ple, the branch connecting node 1 to node 1 is labeled with
s0, the branch connecting node 1 to node 2 is labeled withs4, and so forth, wheresi,i =0, 1,. . ., 7, are the symbols from
the 8-PSK constellation diagram. This encoder takes in 2 bits at a time and adds an additional bit. Thus the rate of this en-coder is 2/3. In order to achieve the same data rate, we have to pay an additional bandwidth penalty of 3/2 (since only 2/3 of the bandwidth is used to send information, the rest 1/3 is overhead). Since the input is 2 bits at a time, every node of the trellis has 22 = 4 outgoing branches. A sequence of in-coming bits is translated into a sequence of outgoing sym-bols. At the decoder, Viterbi decoding is performed to re-cover the transmitted symbols. For both these TCM schemes,
d2
E(leff) = 3.712Esandd2P(leff) = 4.688Es2, whereEs
repre-sents the average energy per symbol for the digital modula-tion [21].
Simulations have been carried out to test the perfor-mance of the system using one-frequency, two-polarization, and two TCM schemes. The design criterion for the two TCM schemes (given inFigure 7) is to maximize the mini-mumd2
E(leff). This is the common design criterion for both
acceptable QoS will be available if we deploy the two TCM schemes in the cochannel cells. FromTable 1, we note that only 3.77% of the total cell area has C/I<8 dB for the 1F2P2T case. Thus, only 3.77% of the whole cell will have unaccept-able QoS. Comparing this with the pure 8-PSK case using 2F2P, we find that acceptable QoS means C/I>9.5 dB. This corresponds to 5.48% of the cell area having poor QoS. Thus, the 1F2P2T scheme outperforms the 2F2P scheme. The im-provement in performance is due to the coding gain. The signal from the interfering cell is being treated like “noise” by TCM scheme 1 and hence rejected. The asymptotic cod-ing gain [10] of TCM 1 and TCM 2 with respect to uncoded 8-PSK is given by
g∞=10 log10
dfree2
d28-PSK
=10 log10
3.712 0.586
=8.017 dB.
(26) We next look at the reduction in the bandwidth requirement offered by the 1F2P2T scheme. Our TCM scheme takes 2-input bits and outputs 3 bits, which are then mapped on to one of the possible 8 symbols of 8-PSK. The code rate of our encoder is 2/3. This means that 2/3 of the total bandwidth will be used for data transmission and the remaining 1/3 of the bandwidth will be used for coding overhead. Hence, for this 2/3 rate TCM scheme, the net bandwidth required will be (1/2)/(2/3)=3/4 of the original bandwidth, providing a bandwidth reduction of 25%. The factor of 1/2 is because we are using just one frequency instead of two. In general, for a rate (m/(m+ 1)) TCM encoder, the bandwidth reduction is given by
BW reduction (%)=100
1−1 2
(m+ 1)
m
=100(m−1)
2m .
(27)
This suggests that the code rate of the trellises should be greater than 1/2 in order to cause a reduction in the eff ec-tive bandwidth used. The plot of the percentage bandwidth reduction versusmis given inFigure 8. The asymptotic value of bandwidth reduction is 50%. From the figure it is clear that 40% bandwidth reduction is achieved simply by using a 5/6 encoder. It should be noted that a larger value ofmimplies a higher decoder complexity.
Tradeoffs between the proposed and the existing schemes
We next discuss the trade-offs between the two strategies: two-frequency, two-polarization (2F2P) and the one-fre-quency, two-polarization, and two-TCM schemes (1F2P2T). The trade-offs are discussed under the heads of bandwidth requirement, complexity, and frequency planning.
(1) Bandwidth requirement: there is always a reduction in the bandwidth used when we use the 1F2P2T as op-posed to the 2F2P scheme. From equation (27) we see that for a rate (m/(m+ 1)) TCM encoder, the achieved bandwidth reduction is 100(m−1)/2m%. The asymptotic value of bandwidth reduction is 50%. FromFigure 8it is clear that 40% bandwidth reduction
50
40
30
20
10
0
0 5 10 15
m
BW
re
d
u
ct
io
n
(%
)
Figure8: Bandwidth reduction with increasingm, where (m/m+1) is the rate of the encoder.
is achieved simply by using a rate 5/6 encoder. A higher rate encoder can also provide a better coding gain and thus a better performance. We also observe the law of diminishing returns as we increase the value ofm. (2) Complexity: by introducing two TCM schemes, we
have added computational complexity to the system. However, very fast TCM encoders and decoders are available off-the-shelf. Hence, the additional complex-ity will not necessarily translate into additional costs. (3) Frequency planning: the 2F2P scheme requires a more
complex frequency planning than the 1F2P2T scheme, since there is only one frequency to layout in the lat-ter scheme. The coding diversity (different TCM en-coders) will have to be enabled at the BS transmitters.
6. CONCLUSIONS
In this paper we propose a new scheme to increase the capac-ity of interference-limited LMDS networks. We suggest the use of two different TCM schemes in cochannel cells in or-der to mitigate the effect of interference. It is shown that the frequency reuse of unity is possible using this scheme. Thus we can use one-frequency, two-polarization, and two TCM codes (1F2P2T) for LMDS networks. LOS downlink scenario has been considered. Analytical expressions for pairwise er-ror probability have been worked out for the case when chan-nel state information is available. The design rules are as fol-lows: (i) for the low SNR scenario, maximize the minimum squared Euclidean distance,d2E(leff) and (ii) for the high SNR scenario, maximize both the minimum squared Euclidean distance, d2
E(leff), and the minimum squared product dis-tance,d2
P(leff).
Numerical simulations have been performed to test out the proposed scheme (1F2P2T). It has been found that for the scenario that uses 8-PSK/TCM, a reduction in the band-width requirement of about 25% is possible. This can trans-late into increased capacity, or better QoS to preferred cus-tomers. The relative trade-offs between the existing scheme and the proposed scheme are also discussed. It is also shown that by using TCM in interference-limited LMDS network, one can increase the capacity of the network by 50%.
ACKNOWLEDGMENT
The author wishes to thank Professor R. Jakoby of the Wire-less Communication Lab, Technical University of Darmstadt, Germany, for the initial discussions on this topic.
REFERENCES
[1] H. Petry, “Broadband wireless access—where are we today?” inProc. Mikrowellen und Optonik/Microwaves and Optronics (MIOP ’01), Stuttgart, Germany, May 2001.
[2] P. B. Papazian, G. A. Hufford, R. J. Achatz, and R. Hoffman, “Study of the local multipoint distribution service radio chan-nel,” IEEE Transactions on Broadcasting, vol. 43, no. 2, pp. 175–184, 1997.
[3] S. Q. Gong and D. Falconer, “Cochannel interference in cellu-lar fixed broadband access systems with directional antennas,” Wireless Personal Communications, vol. 10, no. 1, pp. 103–117, 1999.
[4] R. Bultitude, P. Hou, R. Hahn, G. Hendrantoro, D. Falconer, and R. Berube, “Radio propagation data pertinent to the de-sign of LMCS systems at 28 GHz,” inProc. Symposium on An-tenna Technology and Applied Electromagnetics (ANTEM ’98), Ottawa, Canada, August 1998.
[5] D. A. Gray, “A broadband wireless access system at 28 GHz,” in NIST-Cosponsored Wireless Communications Conference, pp. 1–7, Boulder, Colo, USA, August 1997.
[6] A. Seville, M. Willis, and E. Falaise, “Area coverage studies for millimetre-wave services,” inProc. Millennium Conference on Antenna and Propagation, Davos, Switzerland, April 2000. [7] A. F. Elrefaie and M. Shakouri, “Propagation measurements
at 28 GHz for coverage evaluation of local multipoint distri-bution service,” inProc. Wireless Communications Conference, pp. 12–17, Boulder, Colo, USA, August 1997.
[8] ACTS Project, “Cellular radio access for broadband services (CRABS),” AC215, Telenor R&D, Kjeller, Norway, February, 1999.
[9] R. Bose and A. Kumar, “Reducing frequency reuse distance in cellular communications using trellis coded modulation,” IEE Proceedings-Communications, vol. 148, no. 3, pp. 149–153, 2001.
[10] S. H. Jamali, Coded-Modulation Techniques for Fading Chan-nels, vol. 268 ofThe Kluwer International Series in Engineering and Computer Science, Springer, New York, NY, USA, 1994. [11] E. Biglieri, D. Divsalar, P. J. McLane, and M. K. Simon,
Introduction to Trellis-Coded Modulation with Applications, Macmillan, New York, NY, USA, 1991.
[12] ITU-R, “Prediction procedure for the evaluation of mi-crowave interferrence between stations on the surface of the earth at frequencies above 0.7 GHz,” ITU-R Recommendation 452-6, PN Series, Propagation in Non Ionized Media, pp. 565– 591, 1990.
[13] ITU-R, “Propagation data and prediction methods required for the design of terrestrial line-of-sight systems,” ITU-R Rec-ommendation P.530-9, 2001.
[14] R. Jakoby and M. Grigat, “MMDS zur Erweiterung von BK-Netzen,” Research report from the Research Center of Deutsche Telekom AG Darmstadt, 1996.
[15] R. Bose, G. Bauer, and R. Jakoby, “Two-dimensional line of sight interference analysis of LMDS networks for the down-link and updown-link,” IEEE Transactions on Antennas and Propa-gation, vol. 52, no. 9, pp. 2464–2473, 2004.
[16] R. Bose, A. Hayn, and R. Jakoby, “Intra- and inter cell in-terference investigations for broadband radio access systems above 10 GHz,” Journal of Telecommunications and Informa-tion Technology, no. 2, pp. 10–20, June 2001.
[17] A. Hayn, R. Bose, and R. Jakoby, “Multipath propagation and LOS interference studies for LMDS architecture,” inEleventh International Conference on Antennas and Propagation (ICAP ’01), pp. 686–690, Manchester, UK, April 2001.
[18] J. G. Proakis, Digital Communications, McGraw-Hill, New York, NY, USA, 1983.
[19] W. C. Y. Lee, Mobile Communications Engineering, McGraw-Hill, New York, NY, USA, 1982.
[20] A. Papoulis,Probability, Random Variables and Stochastic Pro-cesses, McGraw-Hill, New York, NY, USA, 3rd edition, 1991. [21] R. Bose, Information Theory, Coding and Cryptography,
McGraw-Hill, Singapore, 2003.
Ranjan Bosereceived his B.Tech. degree in electrical engineering from the Indian Insti-tute of Technology (IIT) Kanpur, in 1992, and the M.S. and Ph.D. degrees in elec-trical engineering from the University of Pennsylvania, Philadelphia, USA, in 1993 and 1995, respectively. He worked at Al-liance Semiconductor Inc., San Jose, as a Se-nior Design Engineer from 1996 to 1997. Since November 1997, he has been with