Multi-Objective Optimization of in Precision Turn-Boring Parameters for
AA7050-T7451 with Multiple Performance Characteristics
Shen-Jenn Hwang
1, Yi-Hung Tsai
21
Department of Mechanical Design Engineering,
2Department of Mechanical and Electro-Mechanical Engineering,
National Formosa University
E-mail:
12Abstract
The present study propose an innovative turn-boring operation method and focuses on
finding optimal turn-boring process parameters for AA7050-T7451 by considering
multiple performance characteristics using Taguchi orthogonal array with the grey
relational analysis, the effect of cutting variables such as, feed rate, depth of cut and
cutting speed are optimized with considerations of multiple performance
characteristics namely surface roughness, roundness error, material removal rate and
power consumption the optimal values were found out from the Grey relational grade.
The result of the Analysis of Variances (ANOVA) is proved that the most significant
factor is cutting speed, followed by feed rate, radial depth of cut. Finally, confirmation
tests were performed to make a comparison between the experimental results.
Experimental results have shown that machining performance in precision turn-boring
process can be improved effectively through this approach.
Keywords: turn-boring; AA 7050-T7451; surface roughness; roundness error; power
consumption; grey relational analysis.
1.
Introduction
Fine boring is one of the important machining aerospace and automotive parts that
have to be efficient and high accuracy. It is an important task to select cutting
parameters for achieving superior cutting performance. The evolution of boring
machining operation properties using different parameters is a complex phenomenon.
There are many factors such as cutting speed, depth of cut, feed rate, insert material
etc affecting the performance of boring machining operation resulting in different
surface quality, accuracy and power consumption . Venkatarao et al. [1] studied the
effect of various input cutting parameters such as cutting speed, feed rate, and tool
nose radius on tool life in boring for AISI 1040steel by analyzing surface roughness,
amplitude of work piece vibration and volume of metal removed. Venkatarao et al. [2]
using an artificial neural network to predict the cutting tool wear, surface roughness
and vibration of the work piece in boring of AISI 316 steel. Chun et al. [3] using the
response surface methodology to study the effect of the overhang, feed rate, and the
depth of cut on machining errors in boring for AISI4140 steel. They found the depth
of cut is the most significant parameters affecting the dimensional accuracy.
With the rapid development of technology in aerospace, automobile and biomedical
industry, conventional machining operations can be not enough to satisfy machining
quality, productivity and cost demands. To improve processing quality and varieties of
metal compound machining methods has been developed. At this point, an innovative
process such as turn-milling is an effective way of machine difficult-to-cut materials
as a kind of compound machining. Schulz [5] proposed two different turn-milling
operations, namely coaxial and orthogonal, and carried out experimental trials to
identify cutting conditions (i.e. feed, speeds, depth of cut) that result in a good surface.
He has further concluded that short chips are formed by intermittent cutting process.
Choudhury and Mangrulkar [6] carried out a series of orthogonal turn-milling
experiments and states that surface finish quality obtained by orthogonal turn-milling
will be about 10 times better than those obtained by conventional turning.
Base on turn-milling method idea, we also proposed a new innovative turn-boring
technology of both the boring tool cutter and workpiece rotation simultaneously. Due
to the direction of rotation of the tool and the workpiece is reversed, resultant from
intermittent cuts and chip breaking. It keeps low thermal stresses, lowers cutting
forces and has useful material removal rates. It also can offer increased productivity.
So far, this compound processing machining method has not yet seen any study
reports.
intention of obtaining improved machined surface, accuracy, material removal rates
and . This study focused on the optimal turn-boring parameters considering the
multiple qualities characteristics such as surface roughness, roundness error, power
consumption and material remove rate using Taguchi based the Grey Relational
Analysis (GRA). The grey relation analysis theory proposed by Deng [7] was used for
solving the complex interrelationship among the multi-objective in various fields of
manufacturing. It’s is an effective approach to solve the multi-objective optimization.
Recently, some researchers have effectively used this method for solving the intricate
interrelationships between the multiple objectives in engineering manufacture with
multiple responses. Kuram and Ozcelik [8] employed the Taguchi method and the
Grey Relational Analysis to multi-optimize with multiple response outputs in the
micro-milling. They studied the effects of spindle speed, feed per tooth and depth of
cut on tool wear, force, and surface roughness. Yang et al. [9] applied the Taguchi
method and the GRA to optimize the milling parameters such as the cutting speed, the
feed rate, and the depth of cut for simultaneous optimization of the energy, production
rate and cutting quality. Kant and Sangwan [10] using grey relational analysis to find
the optimum values of machining parameters to achieve the minimum power
consumption and surface roughness. Hwang et al. [11] investigated and optimized the
high speed end milling of SKD61 Tool Steel using Taguchi methods with grey
relational analysis. Recently, this method attracts more and more widely applied on
mechanical machining and tribological engineering, including drilling [12-14],
turning [15-16], milling [17-18], wire electrical discharge machining [19-20], and
tribology [21].
As mentioned above, The GRA is an effective approach to solve the multi-objective
optimization. Therefore, this study applied a Taguchi L
27orthogonal array to plan the
experiments. The experimental design was organized for three parameters including
feed rate, depth of cut and relative cutting speed of turn-boring with three levels for
each factor. This study presented the multi-objective optimization of turn-boring
parameters to simultaneously minimize the surface roughness, roundness error, power
consumption and maximize material remove rate using Taguchi based GRA in
turn-boring of AA 7050-T7451.
2. Experimental procedure
composition of the workpiece used in this study is given in Table 1 and the
mechanical properties are listed in Table 2. The schematic diagram of the
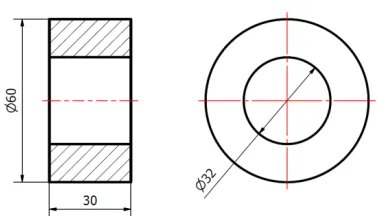
experimental set-up is illustrated in Fig. 1. The geometry and dimensions of the
specimens was a length of 30mm outer diameter of 60mm and inner diameter of
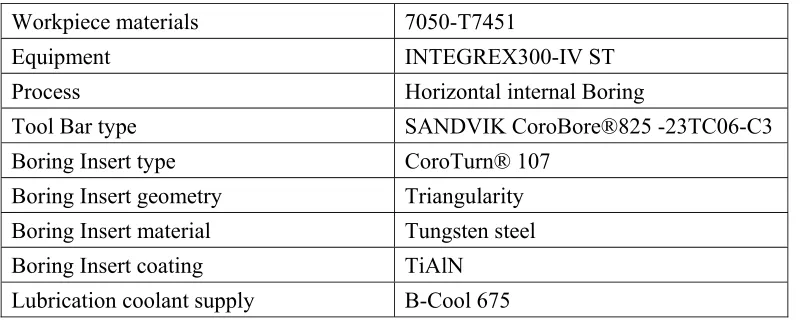
32mm is shown in Fig. 2.The experimental conditions used to refer to a turn-boring
operation are summarized in Tables 3. The cutting fluid properties are shown in table
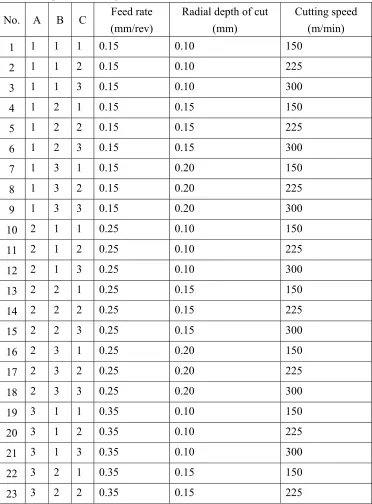
4. Turn-boring parameters and their levels as showed in Table 5. Taguchi's L27
orthogonal arrays are given in Table 6. The machining parameters are concentration
of cutting fluid, temperature of cutting fluid , feed rate, depth of cut and cutting speed
and the output response is surface roughness (Ra), roundness error (Er), material
removal rate (MRR) and power consumption(Pc). The surface roughness Ra is
measured with surface roughness tester (MITUTOYO, MODEL SJ210), the
roundness is measured with Coordinate Measuring Machine (DEA GLOBAL Silver
SF 12.15.10).The material removal rate is calculated by using Eq. (1), as showed in
Fig 3.
MRR
=
(
−
)
4
where
n = 1000 /
, Vc is relative Cutting Speed in m/min ,MRR is material
removal rate in mm
3/min.
ap
is Axial length of cut in mm. D2 is Finished Diameter in
mm. D1
is Initial diameter in mm. n is machine speed in revolutions/minute. fr
is
machine feed rate in mm/rev.
The power consumption is calculated by using Eq. (2)
=
∙
∙
∙
240×10
Where is the turn-boring power consumption in kw, is feed rate in mm/rev,
is relative cutting speed in m/min,
is radial depth of cut in mm and
is
Cutting
impedance : 700 N/mm
2Table 1 Chemical composition of AA 7050-T7451 aluminum alloy.
Element
Al Zn Mg
Cu
Zr Ti Cr Fe Si
% wt
89.0 6.13 2.3 2.1 0.12 0.04 0.03 0.08 0.05
Table 2 Mechanical properties for 7050-T7451
Properties E (GPa)
Sy (MPa)
Su (MPa)
Elongation %
Table 3 Experimental conditions.
Workpiece materials
7050-T7451
Equipment INTEGREX300-IV
ST
Process Horizontal
internal
Boring
Tool Bar type
SANDVIK CoroBore®825 -23TC06-C3
Boring Insert type
CoroTurn® 107
Boring Insert geometry
Triangularity
Boring Insert material
Tungsten steel
Boring Insert coating
TiAlN
Lubrication coolant supply
B-Cool 675
Table 4 cutting fluid properties
Manufacturer
Blaser Swisslube
Trade name
B-Cool 675
pH-value
8.5 - 9.2 @ 50 g/l H2O (DIN 51369)
Density at 20°C
1.02 g/cm³ (DIN 51757)
Viscosity at 40°C
60
mm
2s
(ISO 3104)
Flash point (
℃
)
143°C (ISO 2592)
Refractive index
1.430
Fig.2 Geometry and dimensions of the specimens
Fig. 3 Schematic diagram of material removal rate
Table 5 Turn-boring parameters and their levels
Symb
ol
Control parameters
unit
Level
1
Level
2
Level
3
A
Feed rate: mm/rev
0.150 0.250 0.350
B
Radial depth of cut:
mm 0.100 0.150 0.200
Table 6 Experiment design and real value
No. A B C
Feed rate
(mm/rev)
Radial depth of cut
(mm)
Cutting speed
(m/min)
1
1 1 1 0.15
0.10
150
2
1 1 2 0.15
0.10
225
3
1 1 3 0.15
0.10
300
4
1 2 1 0.15
0.15
150
5
1 2 2 0.15
0.15
225
6
1 2 3 0.15
0.15
300
7
1 3 1 0.15
0.20
150
8
1 3 2 0.15
0.20
225
9
1 3 3 0.15
0.20
300
10 2 1 1 0.25
0.10
150
11 2 1 2 0.25
0.10
225
12 2 1 3 0.25
0.10
300
13 2 2 1 0.25
0.15
150
14 2 2 2 0.25
0.15
225
15 2 2 3 0.25
0.15
300
16 2 3 1 0.25
0.20
150
17 2 3 2 0.25
0.20
225
18 2 3 3 0.25
0.20
300
19 3 1 1 0.35
0.10
150
20 3 1 2 0.35
0.10
225
21 3 1 3 0.35
0.10
300
22 3 2 1 0.35
0.15
150
24 3 2 3 0.35
0.15
300
25 3 3 1 0.35
0.20
150
26 3 3 2 0.35
0.20
225
27 3 3 3 0.35
0.20
300
3. Results and discussions
Multi-objective optimization with Grey relational analysis
Grey relational analysis is a statistical method to analyze the complex multi-response
systems. Based on experimental data, the Grey relational analysis is utilized to
convert the multi-response optimization into the single objective optimization of the
grey relational grade
. The aim of this study was to identify the optimal
combination of turn-boring parameters that simultaneously minimize surface
roughness(Ra), roundness error(Er), power consumption (P
c)and maximize the
material removal rate(MRR) in turn-boring of AA7050-T7451. Steps of grey
relational analysis are as follows:
3.1 Grey relational generation
The first step of grey relational analysis is goes to normalize the experimental data
depending on the type of performance response. Ra, Er, P
cand MRR are to normalize
in the range of zero to one. This is called grey relational normalization. In the present
study, as surface roughness, roundness and power consumption had to be minimized,
the smaller-the-better model aims to obtain the minimum quality characteristics. MRR
had to be maximized.
For the Lower-the-better criterion, the normalize data can be expressed as
∗( )
=
max ( ( )) − ( ( ))
max (( ( )) − min ( ( ))
For the
Larger-the-better
criterion, the normalize data can be expressed as
∗
( )
=
( ) − min ( ( ))
max (( ( )) − min ( ( ))
where
∗( )
is the value after grey relational generation (normalized value), and
max
( )
and
( )
are the largest and smallest values of
( )
for the kth
response, respectively, k being 1 for surface roughness, 2 for roundness error , 3 for
power consumption and 4 for material removal rate.
The processed data after grey
normalized result should be equal to 1.
3.2
grey relational coefficient
Grey relational coefficients denote the relationship between the ideal and the actual
experimental results. Grey relational coefficient
( )
can be calculated as the
following:
( )
=
Δ
+ Δ
Δ ( ) + Δ
0 < ( ) ≤ 1
Here,
Δ ( ) = ‖
∗( ) −
∗( )
‖
,
∗( )
is
reference sequence and
∗( )
is
comparability sequence;
Δ
=
∀ ∀Δ ( )
is the minimum value,
Δ
=
∀ ∀
Δ ( )
is the maximum value;
is the distinguishing
coefficient(
∈
[0, 1]) and is used to adjust the difference of the relational coefficient.
Generally, the distinguishing coefficient is assumed as 0.5 to fit the practical
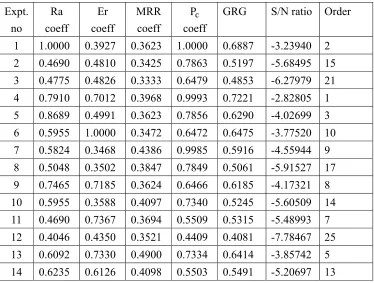
requirements and the grey relational coefficient calculated using Eq. (4) was given in
Table 8.
3.3
Calculate Grey Relational Grade (GRG)
The grey relational grade
with Eq. (5)
can be computed by averaging the
grey relational coefficients
to evaluate the multiple response as a single
index
as
=
1
( )
Here,
n is the number of performance characteristics. The highest grey relational
grade corresponds to the experimental value closest to the ideal normalized value.
Thus, higher grey relational grade shows that the corresponding parameter
combination is closer to the optimal. According to Eq. (5), the GRG between the
process parameters and the performance characteristics is calculated. Grey relational
grade as shown in Table 8.
3.4. Optimal grey relational grade
S
= −10 log
1
1
In Eq. (6), y
iis the ith measured experimental results in a run/row and n explains the
number of measurements in each test trial/row. S/N ratios of multiple quality
characteristics were calculated by using Eq. (6) and were listed in Table 9. The level
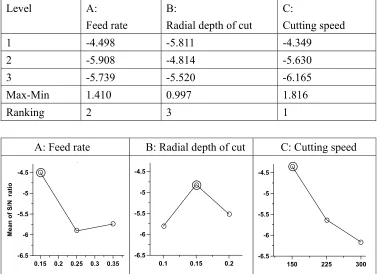
of a parameter with the highest S/N ratio gives the optimal level. As showed in Fig. 4.
The optimal turn-boring parameter setting for the multiple performance characteristic
is A1B2C1. Thus, the best parameters combination were feed rate of 0.15 mm/rev,
radial depth of cut of 0.150 mm and cutting speed of 150 m/min, is the optimal process
parameter combination. In addition, the difference between the maximum and
minimum values for the GRG in Table 9 is 1.410 for the feed rate, 0.997 for radial
depth of cut and 1.816 for the cutting speed. It reflects the impact level of the three
process parameters on the performance characteristics. And the cutting speed has the
most remarkable influence on the performance characteristics.
3.5. Analysis of variance (ANOVA)
The multi objectives are converted into a single object with the help of grey relational
analysis. The significant contribution of each input parameter on the responses in
turn-boring parameters is studied by using analysis of variance. The results of the
ANOVA are given in Table 10. Feed rate, depth of cut and cutting speed influenced
the multiple performance characteristics by 19.76%, 8.77% and 29.02%, respectively.
This indicates that the cutting speed
is the most contributing factor.
3.6 Prediction of grey relation grade
After finding the suitable optimal parameters, it is necessary to predict the grey
relational grade theoretically. The estimated grey relational grade of the optimal level
of the design parameters combination can be calculated as:
=
+
(
−
)
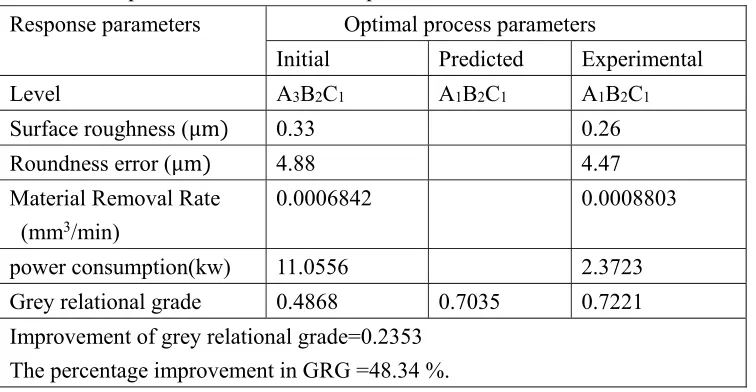
characteristics. Table 11 shows the comparison results of the initial turn-boring and
optimal turn-boring parameters.
It was determined that there is a good agreement
between estimated value and experimental value. It was found out that the
improvement of grey relational grade from initial factor combination (A
3B
2C
1) to the
optimal factor combination (A
1B
2C
1) was 0.2353 and the percentage improvement in
Grey relational grade with the multiple responses was 48.34%.
3.7 Experimental validation
In the last step, the obtained results are conducted to verify the optimized solution.
Table 11 compares the confirmation test results using the initial and optimal level
combination of process parameters.
It is obvious that
surface roughness
(R
a)is
decrease from 0.33µm to 0.26 µm,
roundness error
(E
r) is decrease from 4.88µm to
4.47 µm,
material removal rate
(MRR) is increase from 0.0006843(mm
3/min) to
0.0008803(mm
3/min),
power consumption
and (P
c) is decrease from 11.0556kw to
2.3723kw . It indicates that the GRA algorithm can be used to improve the
performance characteristics.
4.
Conclusions
In this study, an innovative precision turn-boring
has successfully demonstrated the
application of the Taguchi-based grey relational analysis for multi-objective
optimization of process parameters in
turn-boring
AA7050-T7451 for achieving for
simultaneous minimum surface roughness, roundness error, power consumption and
maximum MRR. The main findings can be summarized as follows:
1.
The multi-optimization method we proposed shows that feed rate of 0.15mm/rev,
radial depth of cut of 0.150mm and cutting speed of 150 m/min are the optimal
combination of
turn-boring
parameters.
2.
It was observed through ANOVA that the relative cutting speed has a dominant
effect of almost 29.05% in contribution ratio, while feed rate has 19.76% and
radial depth of cut has 8.77% influence on the surface roughness, roundness error
and power consumption and material remove rate is considered simultaneously.
3.
The percentage improvement in GRG with the multiple responses was 48.34%. It
is clearly shown that the performance indicators (surface roughness, roundness
error, material remove rate and power consumption) are significantly improved in
turn-boring
for AA7050-T7451 aluminum alloy using the Taguchi-based grey
Table 7 Normalized sequence after grey relational generation.
no
Ra
(μm)
Er
(μm)MRR
(mm3/min)P
(kw)
Normalized values
1 0.19 6.10 0.0005865 2.3691 1 0.19242 0.119837 1 2 0.49 5.42 0.0003910 3.5536 0.433962 0.390671 0.039959 0.864119 3 0.48 5.41 0.0002932 4.7381 0.45283 0.393586 0 0.728238 4 0.26 4.47 0.0008803 2.3723 0.867925 0.667638 0.239877 0.999633 5 0.23 5.31 0.0005869 3.5585 0.924528 0.422741 0.12 0.863557 6 0.37 3.85 0.0004402 4.7447 0.660377 0.848397 0.060061 0.727481
7 0.38 6.59 0.0011746 2.3756 0.641509 0.049563 0.360123 0.999254 8 0.45 6.55 0.0007830 3.5634 0.509434 0.061224 0.200123 0.862995 9 0.28 4.42 0.0005873 4.7513 0.830189 0.682216 0.120163 0.726724 10 0.37 6.45 0.0009775 3.9484 0.660377 0.090379 0.279591 0.818829 11 0.49 3.33 0.0006516 5.9227 0.433962 1 0.146435 0.592346 12 0.58 5.74 0.0004887 7.8969 0.264151 0.297376 0.079877 0.365874 13 0.36 4.38 0.0014672 3.9539 0.679245 0.693878 0.479673 0.818199 14 0.35 4.77 0.0009781 5.9309 0.698113 0.580175 0.279837 0.591405 15 0.53 3.99 0.0007336 7.9078 0.358491 0.80758 0.179939 0.364624
17 0.69 6.46 0.0013051 5.9391 0.056604 0.087464 0.413442 0.590465
18 0.72 6.73 0.0009788 7.9188 0 0.008746 0.280123 0.363362 19 0.59 5.24 0.0013684 5.5278 0.245283 0.443149 0.439305 0.637647 20 0.45 4.39 0.0009123 8.2917 0.509434 0.690962 0.252952 0.320585 21 0.33 4.88 0.0006842 11.0556 0.735849 0.548105 0.159755 0.003522 22 0.48 4.08 0.0020541 5.5355 0.45283 0.781341 0.719469 0.636764 23 0.43 5.57 0.0013694 8.3032 0.54717 0.346939 0.439714 0.319265 24 0.47 6.23 0.0010270 11.0709 0.471698 0.154519 0.299816 0.001767 25 0.63 6.76 0.0027407 5.5431 0.169811 0 1 0.635892 26 0.24 5.28 0.0018271 8.3147 0.90566 0.431487 0.626721 0.317946
27 0.29 4.98 0.0013703 11.0863 0.811321 0.51895 0.440082 0
Table 8
Grey relational coefficients and grey relational grades for different performance
Expt.
no
Ra
coeff
Er
coeff
MRR
coeff
P
coeff
GRG S/N
ratio
Order
15 0.4380 0.9122 0.3788 0.4404 0.5423 -5.31521 18
16 0.6709 0.4701 0.6098 0.7327 0.6209 -4.13957 4
17 0.3464 0.3579 0.4602 0.5497 0.4286 -7.35896 24
18 0.3333 0.3356 0.4099 0.4399 0.3797 -8.41119 27
19 0.3985 0.5114 0.4714 0.5798 0.4903 -6.19076 20
20 0.5048 0.7293 0.4009 0.4239 0.5147 -5.76892 19
21 0.6543 0.5855 0.3731 0.3341 0.4868 -6.25299 22
22 0.4775 0.8635 0.6406 0.5792 0.6402 -3.87369 6
23 0.5248 0.4583 0.4716 0.4235 0.4695 -6.56729 23
24 0.4862 0.3794 0.4166 0.3337 0.4040 -7.87237 26
25 0.3759 0.3333 1.0000 0.5786 0.5720 -4.85208 12
26 0.8413 0.5043 0.5726 0.4230 0.5853 -4.65243 11
27 0.7260 0.5629 0.4717 0.3333 0.5235 -5.62167 16
Table 9 Response table for S/N ratio of average grey relational grade.
Level A:
Feed rate
B:
Radial depth of cut
C:
Cutting speed
1 -4.498
-5.811
-4.349
2 -5.908
-4.814
-5.630
3 -5.739
-5.520
-6.165
Max-Min 1.410
0.997
1.816
Ranking 2
3
1
A: Feed rate
B: Radial depth of cut
C: Cutting speed
0.15 0.2 0.25 0.3 0.35 -6.5 -6 -5.5 -5 -4.5 Mean o f S /N rati o
0.1 0.15 0.2
-6.5 -6 -5.5 -5 -4.5
150 225 300
-6.5 -6 -5.5 -5 -4.5
Table 10 ANOVA table for grey relational grade
Factors DoF
Sum
of
Squares
Mean of
Square
F
Value
p
Value
Contribution
(%)
A: Feed rate
2
10.667
5.334
4.65
0.022 19.76
B: Radial depth
of cut
2 4.733 2.367 2.07
0.153
8.77
C: Cutting speed 2
15.669
7.834
6.84
0.005 29.02
Error 20
22.918
1.146
42.45
Total 26
53.988
Table 11 Comparison of the initial and optimized results.
Response parameters
Optimal process parameters
Initial Predicted
Experimental
Level A
3B
2C
1A
1B
2C
1A
1B
2C
1Surface roughness (
μm)
0.33 0.26
Roundness error (
μm)
4.88 4.47
Material Removal Rate
(mm
3/min)
0.0006842
0.0008803
power consumption(kw)
11.0556
2.3723
Grey relational grade
0.4868
0.7035
0.7221
Improvement of grey relational grade=0.2353
The percentage improvement in GRG =48.34 %.
Reference
2.
Venkatarao K, Murthy BSN, Mohanrao N,
Prediction of cutting tool wear,
surface roughness and vibration of work piece in boring of AISI 316 steel with
artificial neural network,
Measurement 2014
, 51, 63–70.
3.
Chun S.H, Ko T.J. Study on the response surface model of machining error in
internal lathe boring. Int J Precis Eng Manuf 2011, 12, 2, 177–182.
4.
Davim, J.P. Machining of titanium alloys, Springer-Verlag, Berlin, Heidelberg,
2014.
5.
Attanasio, A.; Gelfi, M.; Pola, A.; Ceretti, E.; Giardini, C. Influence of Material
Microstructures in Micromilling of Ti6Al4V Alloy. Materials
2013,
6,
4268-4283.
6.
Schulz, H.; Kneisel, T., Turn-milling of hardened steel-an alternative to turning,
Ann. CIRP 1994, 43, 93–96.
7.
Choudhury, S.K.; Bajpai, J.B., Investigation in orthogonal turn-milling towards
better surface finish, J. Mater. Process Technol 2004, 170, 487–493.
8.
Deng, J.L., Introduction to grey system theory, J. Grey Syst 1989, 1, 1–24.
9.
Kuram, E.; Ozcelik, B., Multi-objective optimization using Taguchi based grey
relational analysis for micro-milling of Al7075 material with ball nose end mill,
Measurement 2013, 46, 1849–1864.
10. Kant, G., Sangwan, K.S. Prediction and optimization of machining parameters
for minimizing power consumption and surface roughness in machining, J.
Clean. Prod 2014, 83, 151-164.
11. Hwang S. J.; Hwang Y. L.; Lee B. Y. The use of the Taguchi-Grey based to
optimize high speed end milling with multiple performance characteristics,
Journal of Material Science Forum 2006, 505-507, 835-840.
12. Tas_kesen, A.; Kütükde, K. Experimental investigation and multi-objective
analysis on drilling of boron carbide reinforced metal matrix composites using
grey relational analysis, Measurement 2014, 47, 321–330.
13. Prasanna, J.; Karunamoorthy, L.; Venkat Raman, M.; Prashanth, S. ; Raj Chordia,
D. Optimization of process parameters of small hole dry drilling in Ti–6Al–4V
using Taguchi and grey relational analysis, Measurement 2014, 48,346–354.
14. Sheth, Saurin.; George, P.M. Experimental investigation, prediction and
optimization of cylindricity and perpendicularity during drilling of WCB
material using grey relational analysis, Precision Engineering 2016 , 45, 33-43.
15. Goel, B. ; Singh, S. ; Sarepaka, R.V. Optimizing single point diamond turning
for mono-crystalline germanium using grey relational analysis, Mater. Manuf.
Processes 2015, 30, 1018–1025.
aluminum 7075 aerospace alloy, Journal of Manufacturing Processes 2017, 26,
1-12.
17. Zhou, Jinhua,; Ren, Junxue,; Yao, Changfeng. Multi-objective optimization of
multi-axis ball-end milling Inconel 718 via grey relational analysis coupled with
RBF neural network and PSO algorithm, Measurement 2017, 102, 271-285.
18. Sarikaya, M. ; Yilmaz, V. ; Dilipak, H. Modeling and multi-response
optimization of milling characteristics based on Taguchi and gray relational
analysis, Proc. Inst. Mech. Eng. Part B-J. Eng. Manuf 2016, 230, 1049–1065.
19. Abhijit Saha, Subhas Chandra Mondal, Multi-objective optimization in WEDM
process of nanostructured hardfacing materials through hybrid techniques,
Measurement 2016, 94, 46-59.
20. Somvir Singh Nain, Dixit Garg, Sanjeev Kumar. Modeling and optimization of
process variables of wire-cut electric discharge machining of super alloy Udimet
L605,
Engineering Science and Technology, an International Journal 2017
vol.20,1, 247-264.
21. Singh, T.; Patnaik, A.; Chauhan, R. Optimization of tribological properties of
cement kiln dust-filled brake pad using grey relation analysis, Materials &
Design 2016, 89, 5, 1335-1342.