Copyright to IJIRSET www.ijirset.com 13755
Stock Price Prediction Using Artificial
Neural Network
Mayankkumar B Patel 1, Sunil R Yalamalle 2
P.G. Student, Department of Industrial Engineering and Management, R V College of Engineering, Bangalore, Karnataka, India1
Assistant Professor, Department of Industrial Engineering and Management, R V College of Engineering, Bangalore, Karnataka, India2
ABSTRACT: A stock market is a public market for the trading of company stock. It is an organized set-up with a regulatory body and the members who trade in shares are registered with the stock market and regulatory body SEBI. Since stock market data are highly time-variant and are normally in a nonlinear pattern, predicting the future price of a stock is highly challenging.
Prediction provides knowledgeable information regarding the current status of the stock price movement. Thus this can be utilized in decision making for customers in finalizing whether to buy or sell the particular shares of a given stock.
Many researchers have been carried out for predicting stock market price using various data mining techniques. This work aims at using of Artificial Neural Network techniques to predict the stock price of companies listed under LIX15 index of National Stock Exchange (NSE). The past data of the selected stock will be used for building and training the models. The results from the model will be used for comparison with the real data to ascertain the accuracy of the model.
KEYWORDS: Stock prediction, Neural Network, LIX15 of NSE, Multi Layer perceptron (MLP), MATLAB
I. INTRODUCTION
From the beginning of time it has been man’s common goal to make his life easier. The prevailing notion in society is that wealth brings comfort and luxury, so it is not surprising that there has been so much work done on ways to predict the markets. Various technical, fundamental, and statistical indicators have been proposed and used with varying results. However, no one technique or combination of techniques has been successful enough. With the development of neural networks, researchers and investors are hoping that the market mysteries can be unraveled. A stock market is a public market for the trading of company stock and derivatives at an agreed price; these are securities listed on a stock exchange as well as those only traded privately. It is an organized set-up with a regulatory body and the members who trade in shares are registered with the stock market and regulatory body SEBI. The stock market is also called the secondary market as it involves trading between two investors. Stock market gets investors together to buy and sell their shares. Share market sets prices according to supply and demand. Stocks that are in demand will increase their price, whereas as stocks that are being heavily sold will decrease their price. Companies that are permitted to be traded in this market place are called “listed companies”.
Copyright to IJIRSET www.ijirset.com 13756
important and rewarding. Prediction provides knowledgeable information regarding the current status of the stock price movement. Thus this can be utilized in decision making for customers in finalizing whether to buy or sell the particular shares of a given stock.
An Artificial Neural Network (ANN), often just called a neural network, is a set of interconnected links that have weights associated with them. The concept of ANN was derived from biological neural networks. Neural networks open up a new foray into the field of making efficient and usable predictions in order to optimize profits. Artificial Neural Networks are being used in numerous areas, as it is an irrefutably effective tool that aids the scientific community in forecasting about probable outcomes.
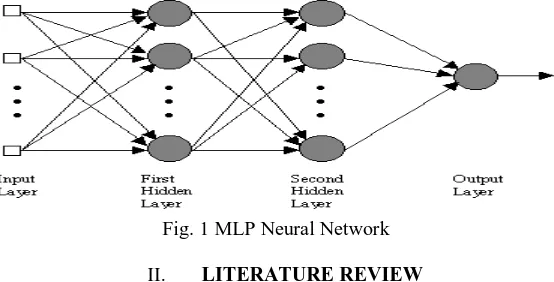
Any ANN can be thought of as a set of interconnected units broadly categorized into three layers. These three layers are the input layer, the hidden layer and the output layer. Inputs are fed into the input layer, and its weighted outputs are passed onto the hidden layer. The neurons in the hidden layer (hidden neurons) are essentially concealed from view. Using additional levels of hidden neurons provides increased flexibility and more accurate processing. However, the flexibility comes at the cost of extra complexity in the training algorithm. Having more hidden neurons than necessary is wasteful, as a less number of neurons would serve our purpose just fine. On the other hand, having less hidden neurons than required would cause reduced robustness of the system, and defeat its very purpose. An illustration of a neural network is shown in Figure 1.
MLP Neural Network
Multi Layer perceptron (MLP) is a feedforward neural network with one or more layers between input and output layer. MLP maps sets of input data onto a set of appropriate outputs. Feedforward means that data flows in one direction from input to output layer (forward). An MLP consists of multiple layers of nodes in a directed graph, with each layer fully connected to the next one. Except for the input nodes, each node is a neuron (or processing element) with a nonlinear activation function. This type of network is trained with the backpropagation learning algorithm. MLPs are widely used for pattern classification, recognition, prediction and approximation. Multi Layer Perceptron can solve problems which are not linearly separable. MLPs separate classes via Hyperplanes. MLPs use distributed learning. MLPs have one or more hidden layers.
Fig. 1 MLP Neural Network
II. LITERATURE REVIEW
Darmadi Komo et al. (1994) used and compared two neural network models, Radial Basis Function (RBF) and Backpropagation (also known as multilayer perceptron (MLP)), for stock market predictions. Actual data of the Wall Street Journal's Dow Jones was used for a benchmark in the experiments. A notable success was achieved with the proposed models producing over 80% prediction accuracies observed based on the monthly Dow Jones Industrial Index predictions. The results demonstrated that the RBF neural network is preferred over the MLP network.
Copyright to IJIRSET www.ijirset.com 13757
importance of data mining in prediction field is given. They concluded with there is a growing gap between more powerful storage and retrieval systems. A new technological leap is needed to structure and prioritize information for specific end-user problems. The data mining tools can make this leap.
Dase R.K. et al. (2010) did a review of literature on application of Artificial Neural Network for stock market predictions. They found that Predicting stock index with traditional time series analysis was proven to be difficult but an Artificial Neural network may be suitable for this task. A Neural Network has the ability to extract useful information from large set of data. From the past literature, they found that Artificial Neural Network is very useful for predicting world stock markets. They suggested, this is new emerging field and there is considerably large scope for the use of Artificial Neural Network for accurate prediction of stock market index.
Akhter Mohiuddin Rather (2011), in his work, used prediction based neural networks approach for stock returns. An autoregressive neural network predictor was used to predict future stock returns. Various error metrics have been used to evaluate the performance of the predictor. Experiments with real data from National stock exchange of India (NSE) were employed to examine the accuracy of this method. Data from date 02-01-2007 till 22-03-2010 for: TCS, BHEL, Wipro, Axis Bank, Maruthi and Tata Steel were taken. The result was not accurate but he suggested the use of better neural predictive systems and training methods for minimizing the prediction errors for the future work. D. Ashok kumar et al. (2013) discussed some basic ideas of time series data, need of ANN, importance of stock indices, survey of the previous works and it investigates neural network models for time series in forecasting. In their study, for performance of between BSE100 stock market index and NIFTY MIDCAP50 stock market index is studied by neural network model and measured aggregation where observed viz., MAE, MAPE, PMAD, MSE and RMSE. The result shows that the performance is comparatively best. From the result they observed that an optimal feedback weighting factor learning rate is 0.28, momentum is 0.5 and epoch is 2960. The model achieved the lower prediction error and it may be fit into any stock market data.
Aditya Nawani et al. (2013) discuss how data mining techniques can be applied to design a market capital prediction system for trading firms. Their study shows how neural networks can be utilized, in combination with the Graphical user Interface of MATLAB, GUIDE, to make accurate predictions. When implemented, the trained system can be used to forecast the market capital for a particular combination of input parameters. The accuracy of this method was high because the results obtained were found to be comparable to the output expected.
III. OBJECTIVES AND SCOPE Objectives
To study the current stock market trend and collect trend data.
To build prediction model for the companies listed under LIX15 index of NSE using multilayer perceptron (MLP) Neural Network technique.
To compare the model with real data for its accuracy.Scope
The past three years’ data of the companies listed under LIX15 index of NSE are used for building, training and testing the prediction model for MLP algorithms.IV. PROPOSED METHODOLOGY
Step 1: Data collection- past data of stock market are collected from various authorized sources.
The data of companies listed under LIX15 index of NSE, for the duration of 36 months (2011 to 1-1-2014) have been collected.Step 2: Developing MLP neural network algorithm to predict future stock price.
Copyright to IJIRSET www.ijirset.com 13758
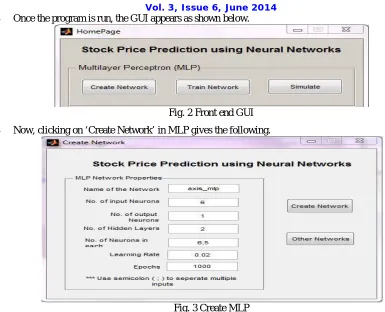
Once the program is run, the GUI appears as shown below.
Fig. 2 Front end GUI
Now, clicking on ‘Create Network’ in MLP gives the following.
Fig. 3 Create MLP
Here, as shown in above snapshot, ‘Name of the Network’ can be any name. The other six parameters namely, ‘No. of input Neurons’, ‘No. of output Neurons’, ‘No. of Hidden Layers’, ‘No. of Neurons in each’, ‘Learning Rate’ and ‘Epochs’ are used for different combinations of values and the result of all these combinations are taken into the consideration to check which combination gives the more accurate result.
After entering all the values, click on ‘create network’. Now, the network is created.
Once the network is created, the next step is to train the network. Clicking on ‘Train Network’ gives the following.
Fig. 4 MLP Network
Copyright to IJIRSET www.ijirset.com 13759
Fig. 5 Performance Curve MLP
For different combinations of data and parameters, this performance curve varies. Training of the model stops either it reaches to mentioned number of epochs (shown in Fig. 3) or when Mean Squared Error (MSE) is almost never improving after certain epochs. The circle in the performance curve shows the best validation performance.
Fig. 6 Error Curve MLP
Copyright to IJIRSET www.ijirset.com 13760
Fig. 7 Output Curve MLP
Here, actual value is compared with the predicted value. In the output curve as shown in Fig. 7, blue line shows actual value for that particular input index and red line shows predicted value.
V. RESULTS
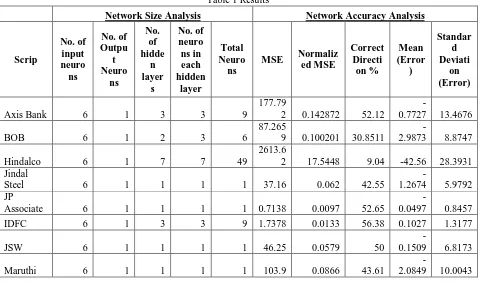
For different combinations of data and parameters, the different results and outputs are taken for all the companies that are listed under LIX15 Index of NSE.
Table 1 Results
Network Size Analysis Network Accuracy Analysis
Scrip No. of input neuro ns No. of Outpu t Neuro ns No. of hidde n layer s No. of neuro ns in each hidden layer Total Neuro ns
MSE Normaliz ed MSE Correct Directi on % Mean (Error ) Standar d Deviati on (Error)
Axis Bank 6 1 3 3 9
177.79
2 0.142872 52.12
-0.7727 13.4676 BOB 6 1 2 3 6
87.265
9 0.100201 30.8511
-2.9873 8.8747 Hindalco 6 1 7 7 49
2613.6
2 17.5448 9.04 -42.56 28.3931 Jindal
Steel 6 1 1 1 1 37.16 0.062 42.55
-1.2674 5.9792 JP
Associate 6 1 1 1 1 0.7138 0.0097 52.65
-0.0497 0.8457 IDFC 6 1 3 3 9 1.7378 0.0133 56.38 0.1027 1.3177 JSW 6 1 1 1 1 46.25 0.0579 50
-0.1509 6.8173 Maruthi 6 1 1 1 1 103.9 0.0866 43.61
Copyright to IJIRSET www.ijirset.com 13761
McDowell 6 1 2 3 6 4.894 0.0496 64.36 0.5567 2.1467 Rcom 6 1 1 1 1 1.4888 0.0155 56.38
-0.0623 1.2218 SBI 6 1 2 3 6
2423.9
3 0.8634 68.08
23.134
8 43.5753 Tata
Motors 6 1 1 1 1
2198.9
7 14.017 22.87
-10.338
8 45.8614 Tata Steel 6 1 1 1 1
30.781
2 0.0529 56.38 0.6005 5.5302 Yes Bank 6 1 7 7 49
12.337
2 0.0434 52.12
-0.4361 3.4945 Performance analysis is the most important part. The numbers here are very deceptive and careful analysis of the same is important.
MSE: Mean Square Error is obtained by squaring the difference of obtained output and the actual output. The main drawback of MSE is that the value of MSE increases with the increase in the stock price. Eg: Assume that a neural network is able to predict the price with 90% accuracy. For stock like Idea cellular whose price is in the range of 150-200 the maximum possible MSE is 400. If the same network is used for Infosys whose price is in the range of 2000 - 3000 the maximum MSE is around 90,000. Hence MSE is a very deceptive number. It is used by the system for training the weights.
MSE various with stock price hence cannot be used for comparison. We need a number which can be compared, for this Normalized MSE is the solution. Normalized MSE is obtained by dividing MSE with the stock price. Correct Direction %: Let us assume that the actual closing price of the stock is 100 Rs even if the predicted price is 99.9999 Rs it is not accounted in the above percentage. Hence correct direction % should alone not be used for the analysis. It is used along with the normalized MSE for comparing neural networks. Standard Deviation is used for identifying the range for the accuracy of the network. It is used along with Correct Direction %. Thus, Normalized MSE along with Correct Direction % and SD are used for comparing performance of the system.
VI. CONCLUSION
Stock market data are highly time-variant and are normally in a nonlinear pattern, predicting the future price of a stock is highly challenging. Prediction provides knowledgeable information regarding the current status of the stock price movement. In the literature review, different data mining techniques for stock market prediction are reviewed. It is noticed that Artificial Neural Network technique is very useful in predicting stock indices as well as stock price of particular company. Many different algorithms have been used with neural network. Feedforward MLP neural network technique is considered to predict the stock price of companies listed under LIX15 index of NSE. From the result table is can be concluded that MLP neural network technique gives the satisfactory output with
Copyright to IJIRSET www.ijirset.com 13762 REFERENCES
[1] Darmadi Komo, Chein-I Chang, Hanseok KO, “Neural Network Technology for Stock Market Index Prediction”, International Symposium on
Speech, Image Processing and Neural Networks, 13-16 April 1994
[2] D. Venugopal Setty, T.M.Rangaswamy and K.N.Subramanya, “A Review on Data Mining Applications to the Performance of Stock Market”, International Journal of Computer Applications, (0975 – 8887) Volume 1 – No. 3, 2010
[3] Dase R.K. and Pawar D.D., “Application of Artificial Neural Network for stock market predictions: A review of literature”, International Journal of Machine Intelligence, ISSN: 0975–2927, Volume 2, Issue 2, pp-14-17, 2010
[4] Akhter Mohiuddin Rather, “A prediction based approach for stock returns using autoregressive neural networks”, IEEE, 978-1-4673-0126-8,
2011
[5] D. Ashok kumar and S. Murugan, “Performance Analysis of Indian Stock Market Index using Neural Network Time Series Model”, International Conference on Pattern Recognition, Informatics and Mobile Engineering (PRIME), IEEE, 978-1-4673-5845-3, 2013
[6] Aditya Nawani, Himanshu Gupta, Narina Thakur, “Prediction of Market Capital for Trading Firms through Data Mining Techniques”, International Journal of Computer Applications (0975 – 8887) Volume 70– No.18, May 2013
[7] Chi Kin Chow, Tong Lee, “Construction of multi-layer feed forward binary neural network by a genetic algorithm Neural Networks”, IJCNN
Proceedings of the 2002 International Joint Conference, Honolulu, HI, USA, 2002
[8] Cao Q, Leggio KB, Schniederjans Mj., “A comparison between Fama French’s model and artificial neural network s in predicting the Chinese
stock market”, Computers & Operations Research, Vol. 32, pp. 2499-2512, 2005
[9]Satyajit Dhar, Tuhin Mukherjee, Arnab Kumar Ghoshal, “Performance Evaluation of Neural Network Approach in Financial Prediction:
Evidence from Indian Market”, Proceedings of the International Conference on Communication and Computational Intelligence,
pp.597-602, 2010
[10]Text Book “Data Mining Techniques”, by Michael J.A. Berry and Gordon S. Linoff, Second edition
[11]Gitansh Khirbat, Rahul Gupta, Sanjay Singh, “Optimal Neural Network Architecture for Stock Market Forecasting”, International
Conference on Communication Systems and Network Technologies, IEEE, 978-0-7695-4958-3, 2013
[12] Binoy B. Nair, M. Patturajan, V.P Mohandas, Sreenivasan R.R, “Predicting the BSE Sensex: Performance Comparison of Adaptive Linear
Element, Feed forward and Time Delay Neural Networks”, IEEE, 978-1-4673-0449-8, 2012
[13]Kumar Abhishek, Anshul Khairwa, Tej Pratap, Surya Prakash, “A Stock Market Prediction Model using Artificial Neural Network”, International Conference on Computing, Communications and Networking Technologies (ICCCNT), IEEE-20180, 26th-28th July 2012
[14]Kunwar Singh Vaisla and Dr. Ashutosh Kumar Bhatt, “An Analysis of the Performance of Artificial Neural Network Technique for Stock
Market Forecasting”, (IJCSE) International Journal on Computer Science and Engineering, Vol. 02, No. 06, pp. 2104-2109, 2010
[15]J. G. Agrawal, Dr. V. S. Chourasia, Dr. A. K. Mittra, “State-of-the-Art in Stock Prediction Techniques”, International Journal of Advanced
Research in Electrical, Electronics and Instrumentation Engineering, Vol. 2, Issue 4, April 2013
[16]Pratap Kishore Padhiary and Ambika Prasad Mishra, “Development of Improved Artificial Neural Network Model for Stock Market
Prediction”, International Journal of Engineering Science and Technology (IJEST), Vol. 3 No. 2, Feb 2011
[17]Yusuf Perwej and Asif Perwej, “Prediction of the Bombay Stock Exchange (BSE) Market Returns Using Artificial Neural Network and
Genetic Algorithm”, Journal of Intelligent Learning Systems and Applications, 4, 108-119, 2012