Doctoral School in Materials, Mechatronics and Systems Engineering
Planar copper containing anode-supported
solid oxide fuel cells
Vincenzo De Marco
Month 2017
XXIX
c
y
c
P
LANAR COPPER CONTAINING ANODE
-
SUPPORTED
SOLID OXIDE FUEL CELLS
Vincenzo De Marco
E-mail: [email protected]Approved by:
Prof. - - - -, Advisor Department of - - - University of - - - -, Country.
Prof. - - - -, Department of - - - University of - - - -, Country.
Ph.D. Commission:
Prof. - - - -, Department of - - - University of - - - -, Country.
Prof. - - - -, Department of - - - University of - - - -, Country.
Prof. - - - -, Department of - - - University of - - - -, Country.
University of Trento,
Department of Industrial Engineering
University of Trento - Department of Industrial Engineering
Doctoral Thesis
Vincenzo De Marco - 2017
Published in Trento (Italy) – by University of Trento
Abstract
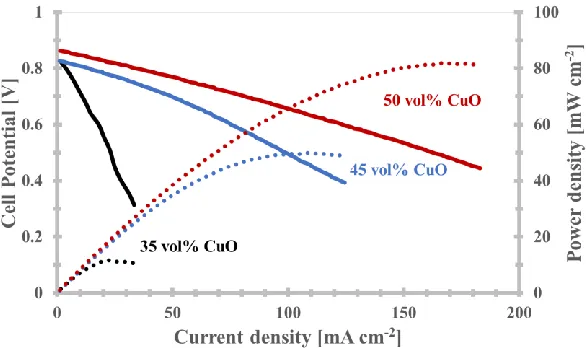
Planar copper-containing anode supported Intermediate Temperature Solid Oxide Fuel Cells (IT-SOFCs) were produced by single step cosintering. The anode and the electrolyte were realized through water-based tape casting, the cathode being added by screen printing. A 5 mol% of Lithium oxide addition allowed reducing the Gadolinia-Doped Ceria (GDC)-based electrolyte sintering temperature below the copper oxide melting point. IT-SOFCs sintered at 950°C revealed a power density peak of 26 mW cm-2 at 650°C in H2, the maximum CuO amount within the anodic
cermet being limited at 35 vol%. To improve the cell performance, the anode electrolyte thickness ratio was increased, in order to take advantage by the compressive tensile state induced by the supporting to the thinner layer, this leading to a further sintering temperature reduction and to avoid cracks due to the thermal expansion coefficient (TEC) mismatch existing between anode and electrolyte. IT-SOFCs at 900°C showed a power density peak of 200 mW cm-2 at 700°C in H2.
Table of contents
Chapter I
Introduction ...11
Chapter II Background ...14
2.1. Introduction ...14
2.2. SOFC principles and thermodynamics ...14
2.3. Materials and cell components ...23
2.3.1. Electrolyte ...23
2.3.1.1. Gadolinia-doped Ceria based Electrolytes ...23
2.3.2. Anode ...25
2.3.2.1. Issues related to the employment of C-based fuels ...26
2.3.3. Cathode ...28
2.4. Motivation of the work ...28
Chapter III Materials and experimental procedures ...30
3.1. Materials ...30
3.2. Experimental procedure ...31
3.2.1. Slurry preparation………..31
3.2.1.1. Mixing………...31
3.2.1.2. Deairing………32
3.2.1.3. Additive mixing………32
3.2.2. Tape casting process………33
3.2.3. Analysis of viscosity………..34
3.2.4. GDC doping and dilatometry………34
3.2.5. Production of IT-SOFC………...35
3.2.6. Electrochemical characterization………....36
3.2.7. Sintering temperatures and anode composition analysis……36
Chapter IV
Results and discussion ...…39
4.1. Production of Gadolinia-doped Ceria dense electrolyte ...40
4.1.1. Analysis of viscosity………40
4.1.2. Additives optimization………...………..41
4.1.3. Tape casting process………..41
4.2. Effect of Bismuth Oxide as Sintering Aid for Gadolinia-doped Ceria at 1050°C……….44
4.3. Effect of Lithium Oxide as Sintering Aid for Gadolinia-doped Ceria ...…49
4.4. CuO and GDC reduction by TPR……….……….54
4.5. Electrochemical screening……….………...56
4.5.1. Cell tests in H2….………..………..….56
4.5.1.1. Effect of CuO concentration…….………...56
4.5.1.2. Effect of anode/electrolyte thickness ratio………...….65
4.5.1.3. Effect of pore former addition………...69
4.5.1.4. Effect of cell operation on Copper migration………74
4.5.1.5. Effect of temperature………....81
4.5.2. Cell tests in CH4/CO2 mixture….……….83
Chapter V Conclusions ...…86
5.1 Introduction………...86
5.2 IT-SOFC production………....86
5.3 Improvement of IT-SOFC performance………..86
5.4 Results in CH4/CO2 mixture………...87
References ...…88
Scientific Production ...94
Participation to Congresses, Schools and Workshops ...95
Chapter I
Introduction
Solid oxide fuel Cells (SOFCs) are among the most promising devices for an environment-friendly energy conversion, due to reasons like their high fuel flexibility and to the possibility to be coupled within hybrid system for cogeneration purposes1,2,3,4,5,6. The aim to guarantee power also to small scale and domestic
applications have recently lead the research towards lower operating temperature, within the “intermediate temperature” (IT) range (400-750°C), due to better stability and durability, lower corrosion rate and overall cost7. The principal approach that can
allow to decrease IT-SOFC service temperatures without determining valuable performance reductions are fundamentally two: (1) decreasing the thickness of the electrolyte, thus reducing the specific ohmic resistance of the cell and (2) increasing the conductivity of the electrolyte at lower temperature. The material traditionally used in SOFC as electrolyte is yttria-stabilized zirconia (YSZ), due to its high mechanical and chemical stability and high ionic conductivity over a wide range of temperatures and oxygen partial pressures. Nevertheless, the conductivity of YSZ decreases in the IT range, this causing the necessity to find alternative materials. One of the preferred electrolyte materials for IT-SOFC is actually gadolinia doped-ceria (GDC), because of its higher ionic conductivity at lower temperature10. The poor densification behavior of
GDC (in some cases achievable only above 1500°C11) is the main issue associated
with its use. In the current approach, it is proposed to promote sintering at lower temperature by using sintering aids although this can determine variable effects on conductivity12,13,14,15. Another issue to be faced in SOFC is the anode poisoning due
to carbon and/or sulphur impurities contained in hydrocarbon fuels16. At the state of
the art, anodes are often made by YSZ and Ni, this latter being toxic and deactivated by contaminants present in available fuels even in parts per million levels17-19. Strong
efforts have been made to develop innovative anode materials, like metal sulfides, cermets, ceria doped-oxides and perovskites. The literature review suggests, as an overall conclusion, that the use of innovative copper-based anode represents a potential solution to the specific inconvenient20.
The fundamental aim of the present work was the realization of planar Ni-free IT-SOFC able to be fed with fuel different than pure hydrogen (like, for example, biogas and sulphur containing methane). For this reason, according to some previous works20,
order to maximize the cell performances, the effect of different parameters have to be considered. In particular, the CuO concentration within the anodic cermet plays a fundamental role in the cell performance, due to the enhanced electronic conductivity provided by a copper increasing.
Unfortunately, thermal expansion coefficient (TEC) mismatch20 during the cooling
stage after sintering can induce the formation of cracks and even failures when an excessive CuO load is used in the anode. As a matter of fact, TEC mismatch is responsible for residual stresses in the SOFC-constituting layers.In addition, uneven sintering rate between anode and electrolyte can be responsible for differential densification of the two layers21-24.
In order to eventually further reduce the electrolyte sintering temperature, one possible constructive strategy involves the development of compressive stresses in such layer upon co-sintering the multilayered cell. The difference of shrinkage rate (dε⁄(dt)) between anode and electrolyte can generate such desired residual stress.
Stresses generated upon sintering can be reduced by tailoring anode and electrolyte thickness and composition23. Stresses that arise upon sintering because of the
different shrinkage rate between the layers can be responsible for flaws, delamination, retarded densification which are particularly undesirable in the electrolyte while, at least to some extent, they do not influence the anode performance, due to its necessary porous structure. In addition, mismatch stresses generated during the sintering period generally place the layer that have a more rapid densification rate in biaxial tension; therefore, the other layers are subjected to compressive stresses, which can help densificatio 25, 26. On this basis, at a first approximation, in order to
obtain an electrolyte with gas-tight microstructure, one possible constructive strategy could involve the development of compressive stresses in the electrolyte upon co-sintering.Although, the multilayered cell is non-symmetrical (the anode being always thicker than the electrolyte and the cathode and the constituting materials possessing different thermal and elastic properties, one can simplify the system, as it is subjected only to planar deformations upon sintering, i.e. neglecting any bending effect. In addition, also the effect of the cathode during sintering can be neglected because of its typical very limited thickness and high porosity. According to previous works20, 25, 26
the equibiaxial stress generated by sintering mismatch in the electrolyte can be approximated as:
𝜎𝑒𝑙= 1 1 + 𝛼
𝑟
𝛽 Δ𝜀 (1.1)
In the case of an asymmetric bilayer, like in a half-cell consisting of the anode and the electrolyte, a curvature is generally developed upon the sintering process due to mismatch in shrinkages and/or shrinkage rates and a more complicated stress field is generated21-26. Nevertheless, without entering in such details, according to if Δ𝜖̇ < 0
(i.e., the fastest shrinking layer is the anode), the electrolyte goes under compression with clear advantage to its densification; and in the SOFC configuration of interest here (with GDC electrolyte and CuO/GDC anode), the presence of larger CuO amount in the anode could definitely induce an anticipated sintering of this latter20 with beneficial
effects on the electrolyte. In addition, Eq. 1.1 points out also that the stress intensity within the electrolyte increase for smaller r, i.e. for increasing anode thickness. As already mentioned, an additional source of residual stresses in a multi-layered system is the thermal expansion mismatch during cooling after sintering. In this case, the behaviour of the material can be considered simply elastic and stresses (calculated like in Eq. (1.1)) are generated in each layer due to thermal strain difference. For the SOFC composition considered in the present work, since CuO has a TEC larger than GDC (≈ 13∙10-6 K-1 compared to ≈ 9.4∙10-6 K-1 20), larger amount of CuO in the anode
implies more intense tensile stresses in the electrolyte, which can be detrimental for the integrity of this latter. Nevertheless, it is also clear that such stresses can be reduced if sintering is carried out (and possible) at lower temperature.
The basic idea to produce planar copper-based anode-supported IT-SOFC with improved performances is therefore to reduce the sintering temperature of GDC by using sintering aids and use thicker anode. In the present work, lithium oxide was used to reduce the sintering temperature of 10 mol% gadolinia doped-ceria used for realizing by tape casting the electrolyte and, with CuO addition, the anode. The behaviour of planar IT-SOFC where the anode thickness and CuO content were changed was investigated to point out possible beneficial combinations.
Chapter II
Background
2.1 Introduction
A Solid Oxide Fuel Cell (SOFC) is an energy conversion device able to convert the chemical energy of a fuel in to electrical energy. The conversion occurs like in a conventional battery, through electrochemical combination of the reactants. A SOFC does not discharge with time but continues generating electricity as long as fuel and oxidant are supplied to the electrodes, this constituting a difference with batteries. In a SOFC, the chemical energy of the fuel is not converted in thermal energy by combustion. Due to this fact the SOFC efficiency does not obey to the Carnot cycle limitation. If we consider an ideally reversible heat engine, operating between the temperatures T1 and T2 (T1< T2), the maximum efficiency is given by:
𝜂 = 1 −𝑇1 𝑇2
(2.1)
Thus, to increase the efficiency, the difference between T1 and T2 has to be as large
as possible but, due to the limited stability of the materials, it is not possible to overtake operating temperatures allowing achieving efficiency higher than ≈ 30%.
Instead, a SOFC can get efficiency higher than any other known thermal device (>50%), and such efficiency can be further increased by coupling the SOFC with other devices (e.g.: micro turbine) able to convert the unutilized fuel in to thermal energy (combined heat and power systems). Others advantages of the SOFC is the absence of moving parts (this resulting in a limited operating noise) and the theoretical fuel flexibility. In this chapter, there is an introduction of the cell functioning principles and a discussion about the materials utilized and the problems generated by using fuel different from hydrogen. Finally, there is an overview of the most common configurations and architectures.
2.2 SOFC principles and thermodinamycs
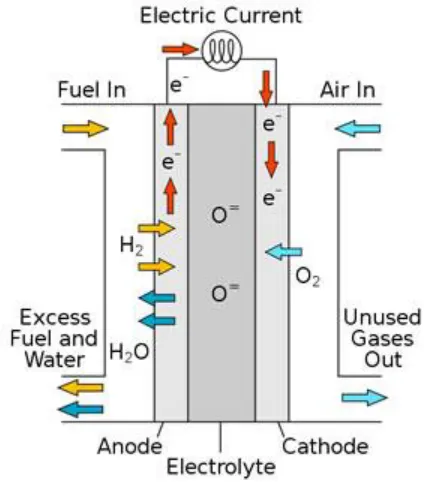
Figure II - 1. Schematic representation of the operating principle of the SOFC. Hydrogen is
oxidized at the anode; oxygen is reduced at the cathode. The oxygen ions diffuse through the electrolyte to the anode side, where water is generated27.
The most common fuel, thanks to its high reactivity, is the hydrogen. The fuel cell reaction can be divided in to two electrochemical half-cells reactions. At the cathode, the oxygen is reduced through the reaction:
4𝑂2𝑐+ 4𝑒−= 2𝑂2− 𝑒 (2.2)
The inverse reaction occurs at the anode:
2𝑂2−
𝑒= 4𝑂2𝑎+ 4𝑒− (2.3)
Thus, the overall reaction results to be
𝑂2𝑐= 𝑂2𝑎 (2.4)
In the previous equations, the subscripts c, a and e stand for the states at the anode, the cathode and the electrolyte.
𝐸𝑟= 𝑅𝑇 4𝐹𝑙𝑛
𝑃𝑂2𝑐
𝑃𝑂2𝑎 (2.5)
In the previous equation, R is the gas constant (=8314 J/mol∙K), T the temperature expressed in Kelvin, F is the Faraday constant (=9648∙104 C/mol) and P𝑂
2is the
oxygen partial pressure at the anode (a) and at the cathode (c). At the anode side, the oxygen partial pressure depends on the employed fuel and on its type and composition. If we consider the hydrogen, the anode reaction is:
𝐻2𝑎+1
2𝑂2𝑎= 𝐻2𝑂𝑎 (2.6)
The equilibrium constant K of the reaction can be expressed as:
𝐾 = 𝑃𝐻2𝑂𝑎
𝑃𝐻2𝑎∙ 𝑃𝑂2𝑎 1 2
(2.7)
We can calculate the oxygen partial pressure at the anode as:
𝑃𝑂2𝑎= ( 𝑃𝐻2𝑂𝑎
𝑃𝐻2𝑎∙ 𝐾) 2 (2.8)
Therefore, the Nernst equation becomes
𝐸𝑟= 𝐸0+ 𝑅𝑇
4𝐹𝑙𝑛𝑃𝑂2𝑐+ 𝑅𝑇 4𝐹𝑙𝑛
𝑃𝐻2𝑎 𝑃𝐻2𝑂𝑎
(2.9)
In the previous equation
𝐸0=𝑅𝑇
2𝐹𝑙𝑛 𝐾 (2.10)
is the reversible voltage when the partial pressure of the reactants are equal to unity (the standard state). Such voltage is related to the standard Gibbs free energy change of the reaction by the equation:
where n is the number of moles of oxygen required to oxidize the fuel. In the standard state, the equation becomes:
𝛥𝐺0= −𝑛𝐹𝐸0 (2.12)
The standard Gibbs free energy gives us information about the spontaneity of the reaction. It is defined through the standard enthalpy change 𝛥𝐻0 and the standard
entropy change 𝛥𝑆0:
𝐸0= −𝛥𝐺0 𝑛𝐹 = −
𝛥𝐻0− 𝑇𝛥𝑆0 𝑛𝐹 (2.13)
𝛥𝐺0 is the maximum electrical work output that can be obtained from (2.6), 𝛥𝐻0 is
the total thermal energy available by the same reaction at constant pressure and
𝑇𝛥𝑆0 is the heat released or absorbed. Thus, it is possible to define the ideal
thermodynamic efficiency as:
𝜀𝑇= 𝛥𝐺0 𝛥𝐻0 (2.14)
Table 2.1 reports some thermodynamic function of the most common reaction in a SOFC. It has to be noted that for carbon and methane oxidation, the thermodynamic efficiency is almost 1.
The effect of temperature and pressure on the reversible voltage is shown by differentiating the Eq. 2.11 for a non-standard state:
𝜕𝜀 𝜕𝑇𝑃=
𝛥𝑆 𝑛𝐹 (2.15) 𝜕𝜀
𝜕𝑃𝑇 =𝛥𝑉
𝑛𝐹 (2.16)
Table II – 1. Standard free energy and enthalpy change, Nernst potential and thermodynamic efficiency for some common reaction in a SOFC28
Reaction T [K] 𝛥𝐺0 [kJ] 𝛥𝐻0
[kJ] 𝐸
0[V] 𝜀
𝑇
𝐻2+
1 2𝑂2
= 𝐻2𝑂
1000 -192.5 -247.3 0.997 0.78
1250 -178.2 -249.8 0.924 0.71
𝐶𝑂 +1
2𝑂2
= 𝐶𝑂2
1000 -195.4 -283.3 1.013 0.69
1250 -173.2 -283.3 0.898 0.61
𝐶𝐻4
+ 2𝑂2
= 𝐶𝑂2
+ 𝐻2𝑂
1000 -802.5 -800.4 1.039 1
1250 -802.9 -801.2 1.039 1
𝐶 + 𝑂2
= 𝐶𝑂2
1000 -396.6 -396.2 1.027 1
1250 -396.6 -396.6 1.027 1
voltage drops due to different irreversible effects. Such effects contribute to decrease the overall SOFC efficiency, which becomes:
𝜀𝐹𝐶= 𝜀𝑇𝜀𝑉𝜀𝐽𝜀𝐻 (2.17)
In the previous equations, subscripts T, V, J and H stand for the thermodynamic, voltage, current and heating value efficiency, respectively. The voltage efficiency 𝜀𝑉
is defined as the ratio of the operating cell voltage under load to the reversible voltage:
𝜀𝑉= 𝐸 𝐸𝑟
(2.18)
The loss of voltage E depends on current density and it is called polarization η:
𝐸 = 𝐸𝑟− 𝜂 (2.19)
Different effects contribute to give the total polarization: the activation polarization 𝜂𝐴,
the concentration polarization 𝜂𝐷 and the ohmic polarization 𝜂𝛺:
𝜂 = 𝜂𝐴+ 𝜂𝐷+ 𝜂𝛺 (2.20)
The overpotential can be optimized by properly choosing the materials, the cell design and the operating temperature and pressure.
The activation polarization 𝜂𝐴 is function of the activation energy that has to be
overcome by the reagents to react. For electrochemical reactions having 𝜂𝐴>50 mV,
it is obtained by the Tafel equation:
𝜂𝐴= 𝑎 ± 𝑏 log 𝑗 (2.21)
where j is the current density, while a and b are constants related to the material, the catalytic activity and the type of the electrode reaction. Normally, the high operating temperatures of SOFC make the activation polarization smaller.
The insufficient velocity of reacting and reacted species to and away from the reaction sites as more current is drawn from the cell is the reason of concentration polarization
𝜂𝐷. When large currents are drawn from the cell, there is an increasing in the reactions
velocity and the reacting species begin to be depleted in one or both of the electrodes. When the limiting reaction step is dominated by the diffusion of the species to and away from the electrodes, a limiting current 𝑗𝐿 is reached. Such limit is function of the
diffusion coefficient D, the activity of the reacting ions 𝑎𝑀 and the thickness of the
𝑗𝐿= 𝑛𝐹𝐷𝑎𝑀
𝜕 (2.22)
and the concentration polarization can be expressed by:
𝜂𝐷= 𝑅𝑇 𝑛𝐹ln (1 −
𝑗
𝑗𝐿) (2.23)
This contribution becomes important when the current density j tends to 𝑗𝐿. Such
value strongly depends also on the ease of access to the reacting sites of the electrodes. Therefore, this parameter is affected also by electrodes thickness, porosity, pore size and morphology.
The resistance of the cell for both ionic conduction through the electrolyte and the electronic conduction in the electrodes and the current collector are the reasons why ohmic polarization occurs, that we express through the Ohm’s law:
𝜂𝛺= 𝑗 𝑅𝑡𝑜𝑡 (2.24)
Rtot is the total resistance of the cell, which mostly depends on the ionic conductivity
of the electrolyte. Thus, the ohmic resistance can be decreased by properly choosing the electrolyte materials, as well as the operating temperature.
The ratio between the actual current withdrawn and the current available from the complete conversion of the fuel gives us the current efficiency 𝜀𝐽. When some of the
fuel is not consumed, the current density j can be expressed through the Faraday’s law:
𝑗 = 𝑛𝐹 (𝑑𝑓
𝑑𝑡)𝑐𝑜𝑛𝑠𝑢𝑚𝑒𝑑 (2.25)
Where df/dt is the molar flow rate of the fuel. The current efficiency is given by:
𝜀𝐽= 𝑗 𝑗𝐹 (2.26)
In the previous equation 𝑗𝐹 is the current density available from the complete fuel
oxidation.
Regarding the heating value efficiency 𝜀𝐻, it can be considered when the fuel is not
Figure II - 2. Typical current-voltage plot of a SOFC. The different polarization contribution to the
voltage drop are indicated32.
At low current densities values, the activation polarization mostly contributes to the voltage drop. By increasing the current density, the voltage drops linearly, this impling that the ohmic losses are predominant in this range. At high current values, mass transport effects become important and the rapid voltage drop observed is attributed to the concentration polarization.
The product between the operating voltage E and the current I allows to calculate the power output 𝑃𝑊:
𝑃𝑊= 𝐸 𝐼 (2.27)
Figure II - 3. Typical power- current plot of an operating SOFC.
For extreme values of current, the power drops to zero and it has a maximum in between. In first approximation, the main contribution to the overpotential is ohmic, the relationship between voltage and current density is nearly linear. It can be written as:
𝐸 = 𝐸𝑟− 𝐸𝛺= 𝐸𝑟− 𝑅𝑡𝐼 (2.28)
Thus, we can define a parabolic expression for the power, expressed by:
𝑃𝑊= 𝐼𝐸𝑟− 𝐼2𝑅𝑡 (2.29)
By differentiating Eq. 2.29 with respect to the current to zero, it is possible to calculate the value of current relative to the maximum power:
𝑑𝑃𝑊
𝑑𝐼 = 0 (2.30)
𝐼𝑃𝑚𝑎𝑥=
𝐸𝑟 2𝑅𝑡 (2.31)
Substitung the current from Eq. 2.31 in Eq. 2.28 gives the chance to get the operating voltage relative to the maximum power output:
𝐸𝑃𝑚𝑎𝑥=
Thus, to achieve the maximum power, the cell voltage is operating at 50% of the reversible voltage and in this case the voltage efficiency is ≈50%. Thus, the SOFC can operate in different regimes, depending on what is suitable for a certain type of application. If we operate at low current densities the efficiency is higher but with low power densities, more usable for stationary applications. For high current densities operating cells, higher power can be achieved, but with lower efficiency. Such devices are more indicated for mobile applications.
2.3 Materials and cell components
A SOFC is made by a series of solid layers with the electrolyte sandwiched between two porous electrodes. The materials selected for being used in the SOFC have several constrains due to more than just their specific role. Some parameters to be considered are: operating temperature, the architecture, the fabrication method, ionic and electronic conductivity of the materials, the porosity, resistance to high temperature, as well as the relative mechanical and chemical compatibility among the materials. The SOFC layers, in fact, require a high temperature treatment to achieve dense electrolyte layer to avoid gas leakage between the electrodes and to minimize the contribution of the ionic resistance. More cell components may be subjected to the heat treatment of the electrolyte, which normally requires the highest temperature and longest sintering cycle, depending on the fabrication procedure selected and on the cell configuration. Thus, the materials employed have to be stable and compatible in both heating and cooling stage of sintering, when it is possible the onset of large residual stresses fractures and debonding, that have to be avoided. General requirements of cell components and materials of interests are reviewed in the following sections.
2.3.1 Electrolyte
The most important characteristic of the electrolyte layer in a SOFC is its ability to conduct exclusively the ions. The ionic conduction in solid electrolyte is primarly determined by the presence of lattice defects. These defects can be stoichiometric or not. Also the partial pressure 𝑃𝑂2 has considerable relevance: for values to those required to maintain stoichiometry, the oxide becomes metal-deficient with excess of interstitial defects. The negative charge is balanced by electron holes produced by the thermal activation of the electrons from the valence band to the conduction band. Thus, electron holes are the main charge carrier with a concentration usually increasing with 𝑃𝑂2 and the electrolyte loses functionality because the electrodes are short-circuited. In the case of lower oxygen partial pressure respect to stoichiometric condition, the oxide is rich in oxygen vacancies and free electrons are the main defects29. In general, for every condition of temperature and partial pressure, the ionic
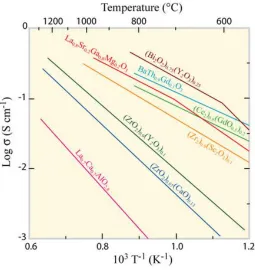
The most commonly material used as electrolyte for SOFC is YSZ. Fig. II – 4 shows the ionic conductivity versus temperature of fore some materials for high (II-4) and intermediate (II-5) temperature ranges.
Figure II - 4. Conductivity of some ion conductors in intermediate temperature range30
Although YSZ is not the best ionic conductor, the others materials tipically have other issues to be faced like cost and difficulty in processing. At the present state YSZ is the state of the art electrolyte for high temperature SOFC application. However, the aim of our work being the production of IT-SOFCs, doped ceria is used and properly discussed in the next session.
2.3.1.1 Gadolinia-doped Ceria based electrolytes
One of the most diffused electrolytes in SOFC operating at intermediates temperatures is Gadolinia-doped Ceria (GDC)31 . Ceria has a cubic fluorite structure
Pure Ceria has a negligible electronic conductivity and free mobile oxygen vacancies are introduced by substituting Ce4+ with divalent or trivalent atoms such as La3+, Y3+,
Gd3+, Ca2+ and Sr2+. If we fix the doping concentration, the ionic conductivity of doped
ceria increases with increasing the dopant radius, up to a maximum correspondent to Gd3+, before decreasing with further increasing of ionic radius32. Also the dopant
concentration influences the conductivity that has a maximum for a specific concentration for every doping atom. When the concentration is further increased, the conductivity decreases, due to the attractive interactions between immobile doping ions and mobile oxygen vacancies33. The licterature suggests that Gd2O3 is the dopant
exhibiting the highest conductivity34, 35. However, in doped CeO2, the Ce4+ ion tends to
reduce to Ce3+ at low oxygen partial pressure condition, this been offset by the creation
of negative charge36. This phenomenon leads to electronic conductivity short-circuiting
the cell, reducing the open circuit voltage (OCV) and its efficiency37. Another problem
that has to be faced, related to the reduction of doped ceria at the anode side, is the lattice expansion resulting that can induce the formations of micro cracks and mechanical failure of the electrolyte8.
The most problematic aspect regarding the employment of doped-ceria as electrolyte is represented by the high temperature required to get a full dense microstructure9. In
fact, sintering temperatures higher than 1400°C are necessary and this could preclude any possibility to co-sinter doped ceria with other cell components because of instability or reactivity. In general, the sinterability of doped ceria is enhanced by decreasing the particle size or by the addition of transition metals38.
2.3.2 Anode
actually strong efforts are being produced to adapt the SOFC to be fed with hydrocarbons, thus other compositions have been proposed.
2.3.2.1 Issues related to the employment of C-based fuels
Although actual Ni-YSZ anodes show good performance and long-term stability for hydrogen, this changes when carbon-containing fuels feed the SOFC. As one can observe in Table II – 2, hydrogen has the highest energy density per mass than any other fuels but, due to the diffulties in storaging and distributing it, serious issues against the real implementation of a hydrogen-based energy economy have to be faced.
Table II – 2. Comparison of some energetic properties of hydrogen and methane.
H2 CH4
Energy density [kWh/kg] 33.3 13.9 Density [g/l] 0.09 0.718 Energy density [kWh/l 0.5-2.4 2.6-3.4 Explosion range [vol%] 4-72.5 5-13.5
Moreover, water is the only by-product but hydrogen is not available in nature as single molecule but it is always bonded to another atom. It has to be produced by water electrolysis, or by steam reforming and partial oxidation of naptha and natural gas. Using natural gas, methane and other simple hydrocarbons directly in a SOFC, by direct oxidation or internal steam reforming they could constitute a valid alternative. When a molecule like methane is used to fuel a SOFC, the simple reaction of hydrogen oxidation is replaced with a more complex set of reactions. The direct oxidation of methane is one of the possible reactions:
𝐶𝐻4+ 4𝑂2− = 𝐶𝑂2+ 2𝐻2𝑂 + 6𝑒− (2.33)
However, this reaction is unlikely to directly occur, even in a case of a simple hydrocarbon such as methane. Instead, it is more probable to proceed as:
𝐶𝐻4+ 𝑂2−= 𝐶𝐻3𝑂𝐻 + 2𝑒− (2.34) 𝐶𝐻3𝑂𝐻 + 2𝑂2−= 𝐻𝐶𝑂𝑂𝐻 + 𝐻2𝑂 + 64 (2.35)
𝐻𝐶𝑂𝑂𝐻 + 𝑂2−= 𝐶𝑂
2+ 𝐻2𝑂 + 2𝑒− (2.36)
Other possible reaction are methane cracking, which are followed by electrochemical reactions of the cracking products:
𝐶 + 2𝑂2−= 𝐶𝑂
2+ 4𝑒− (2.38) 𝐻2+ 𝑂2−= 𝐻2𝑂 + 2𝑒− (2.39)
It is also possible that there is only a partial oxidation: If this happens, the reaction produce a mixture of CO and H2, called syngas, and produces electrons:
𝐶𝐻4+ 𝑂2−= 𝐶𝑂 + 𝐻2+ 2𝑒− (2.40)
The production of carbon monoxide can lead to the Bouduard equilibrium reaction or to its electrochemical reaction:
2𝐶𝑂 = 𝐶 + 𝐶𝑂2 (2.41) 𝐶𝑂 + 𝑂2−= 𝐶𝑂
2+ 2𝑒− (2.42)
In principle, the reaction above can take place by fuelling the cell only with dry methane, with no steam added. Carbon can be formed in both gas phase or as a solid deposit on anodic surface. The formation of C is very important, especially when it is in the form of solid coke. Regardless the coke formation process, this can cause the anode deactivation.
The most used strategy to solve this problem is the use of alternative anode materials that do not catalyse carbon formation. If we consider that the fuel is methane with steam, the immediate option would be the partial or complete substitution of nickel with another good reforming metal catalyst. Even if the use of an electronic conductor, like copper, decreases the catalyst content, the stability period results to be slightly increased39. Moreover, copper shows one of the highest conductivity values among
metals (5.96∙105 S∙cm-1), is inert toward C-H bond cleavage and carbon deposition
and, compared to the other metals, is also cheap. On the other hand, the copper has a very low melting point (1083 °C), as well as its oxides. Copper forms two oxides: cuprite (Cu2O) and tenorite (CuO). Tenorite is the stable oxide in the standard
condition but it reduces to cuprite above 1026°C and melts above 1100°C. Cuprite is instable in air and it tends to form a CuO layer in humid conditions40.
solve this problem, the solution applied in this work is the use electrolyte sintering aid able to get a fully dense microstructure at temperature lower than copper oxide melting point.
2.3.3 Cathode
The cathode is where the electrochemical reduction of oxygen occurs. Thus, in order to properly work, the cathode material must have several roles such as reduction of molecular oxygen, transport of ions to the electrolyte interface and distribution of the electrical current associated with the oxygen reduction reaction. Moreover, in addition to both the catalytic activity and the electrical conductivity, the material used in the cathode must be stable in strongly oxidising atmosphere and have both chemical and mechanical compatibility with other cell components. The majority of the materials used for the fabrication of this electrode have perovskite structure. For high-temperature operating cells, the state-of-the-art cathode is a mixture of lanthanum strontium manganite (LSM) and YSZ. Other cathode materials, more suitable for intermediate operating temperature, are Lantanum strontium cobaltite (LSC) and lanthanum strontium/cobalt ferrite (LSCF). These latter are mixed electronic ionic conductors (MIEC) and can be employed as single-phase cathode. A mixed conductor has the benefit to extend the area of reaction of the whole electrode surface area, resulting in a lower cathode polarization resistance. The formation of cracks and the delamination can be avoided by properly adding the electrolyte material, so that a better match of TEC. Normally, cobalt based perovskites show higher ionic and electronic conductivity than any other cathode material. Such cathode are characterized by an high value of TEC (higher than 20∙10-6 °C-1), than can be reduced
by substituting some Co with Fe. The thermal expansion coefficient LSCF matches with GDC and the cathode does not show any degradation sign after 500h of operation35.This suggest this solution as very promising cathode for IT-SOFCs.
2.4 Motivation of the work
Based on the above mentioned background, it is possible to state two main motivations related to our work: firstly, the fundamental aim is the realization of planar Ni-free IT-SOFC with which it is possible to use fuels different than pure hydrogen (e.g.: biogas and sulphur containing methane). Thus, according to some previous works16, 20, our research moves towards the utilization of copper as the metal
compound in the anodic GDC cermet. Unfortunately, GDC shows a very poor densification behavior (> 1400°C11), while the CuO has a relatively low melting point,
GDC/copper-based supporting anode with the GDC-GDC/copper-based electrolyte represents an additional important issue. Thus, the second motivation is to find a processing strategy able to reduce the GDC sintering temperature at a temperature compatible with the melting point of the CuO, in order to achieve a one step cosintering of the whole IT-SOFC. In the current approach, it is proposed to promote sintering at lower temperature by using sintering aids12,13,14,15. In particular20, 48, Li2O seems to have a really favourable effect
Chapter III
Materials and experimental procedures
In this chapter, an overview of the materials and the instruments utilized for the research development is reported.
3.1 Materials
In this section, all materials used to realize the tape, such as powder, solvent and all the organic additives are properly described and analysed.
The powder used for the electrolyte is Gadolinia-doped ceria with Gadolinia in a concentration equal to 10 mol%. With component percentages are:
- CeO2 = 0.9 mol
- Gd2O3 = 0.1 mol
Values obtained according to Ce1-xGdxO2-x/2 formula, where x is the concentration of
the dopant. Table III-1 shows the particle size of the powder indicated in the datasheet containing the specifications of the same, provided by Treibacher industrie.
Table III – 1. GDC powder specifications
d50 0.27 μm
d90 0.40 μm
SSA (Specific Surface Area) 9.1 m2/g
The importance of the SSA resides in the fact that many parameters can be adjusted in relation to it. In the specific case the amount of dispersant was calculated considering the active part (PA), namely the mass of the solid part of the dispersant solution, in relation to the unit of specific surface area of the powder. Moreover, two different sintering aids were tested, bismuth oxide and lithium oxide. The starting doping powders were Bi(NO3)3·5H2O (Sigma Aldrich, ACS reagent, ≥98.0%, Product
Number 383074) and LiNO3 (Avantor Materials, Baker analyzed reagent, Product
number 2384-01). For the anode, CuO powder (Sigma Aldrich, Product number 208841) was utilized. Solvent and various organic additives, necessary for both electrolyte and anode production, were employed and are below shown. As dispersant, Darvan 821-A was found as one of the best usable for GDC powders42-44.
Table III – 2 Dispersant specifications
Darvan 821 – A
pH 7-7.5
Solid load [wt%] 40 Density [g/cm3] 1.16-1.19
Vicosity 15-50 cps
In the present work, water (in our case bi-distilled) was chosen as solvent. The Rohm and Haas Company produces the binders used in the lab. They are acrylic-based polymers with high molecular weight. They are provided as low viscosity emulsions. According to the glass transition temperature of the polymer, it will improve the strength and green density for a given ceramic process.
In the case of tape casting the products that best meet the process requirements are: DURAMAX B -1000, used as a plasticizer for its low Tg
DURAMAX B -1014, it used as a binder for its high Tg
Table III – 3 shows the fundamental properties of the two additives.
Table III – 3. Binder and plasticizer specifications
Duramax
code Tg [°C] pH
Solid load [wt%] Dimension of particles (nm) Viscosity (mPa∙s)
B 1000 -26 9.6 55 370 140 B 1014 29 3 45 85-140 750
The cathode starting powder was LSCF (Treibacher Industrie, Lot. EA 14/11.2).
3.2 Experimental procedure 3.2.1 Slurry preparation 3.2.1.1 Mixing
The first step necessary for preparing a ceramic suspension is dispersing the powders in an optimal way. The dispersion mechanism provides that the ceramic powder particles are perfectly deflocculated in the aqueous suspension.
1.The surface of the powder particles is wetted by the solvent, after which the light agglomerates remain "stuck" between them because of the Van der Waals electrostatic forces;
2. The primary particles must be mechanically separated and this happens thanks to the action of the spheres of zirconia vortex; once finished this step, they are evenly distributed throughout the liquid
3. The state of perfect distribution of the particles in the solvent must be stabilized and protected. This latter action is made by the dispersant.
3.2.1.2 Deairing
The deairing process is necessary to remove the air stored within the suspension because of the mixing vortex. It is done by connecting a glass ampoule, where is previously stored the suspension immediately after the mixing step, to a venturi pump. The ampoule is suspended on a magnetic mixer, this expedient is of fundamental importance because the liquid under vacuum tends to create a dry film on its surface. The drying effect is due to the fast evaporation of water from the suspension surface caused by the vacuum in the bulb. To avoid this phenomenon, this method creates the minimum agitation sufficient to keep the free liquid surface dry. A second important trick is to not proceed with the de-aeration of the suspension until it reaches room temperature; in fact, the suspension, just extracted from the vortex, is very hot due to internal friction and impact shocks of powder particles and small spheres of zirconia. A deaeration made of a hot liquid leads to a very fast lowering of its temperature and accentuates the drying phenomenon, not desired in this phase. Slurry having a solid load between 16 and 30 vol% (2 vol% step) were tested. For suspensions with high SL (in the case of GDC close to 30 vol%), this phase becomes very critical since it covers any bubbles in the first seconds of the deaeration stage, leaving residues on the ampoule inner walls, which, once dried, fall in solid form in the liquid. The presence of a low viscosity slurry is a strong help in this process. To avoid the presence of solid phases after the deaeration a filtering is carried out before continuing with the next step. In our case we were used polymeric filters with mesh of 100 microns. For the above mentioned reasons, both for the deaeration process itself (with its partial drying of the slurry) and for the subsequent filtering, there is a loss in weight of the suspension compared to the initial quantity extracted after mixing. This leads compute the "deaeration efficiency", defined as the ratio between the post-deairing and the mass of the suspension after mixing vortex.
3.2.1.3 Additive mixing
polymeric part diluted in water, allow the powder grain to remain cohesive and to maintain the desired shape at the same time, even after the green layer drying. The mixing of the additives was accomplished by pouring the suspension into an open container, then by immersing a Teflon impeller which is rotated at a constant number of RPM (in our case equal to 80 RPM) via a mixer Daihan scientific WiseStir HD-50D. The employed RPM were chosen after various tests. In fact, a too high speed can lead to resorption of air in the suspension, whereas a too low speed may not provide proper mixing even after a relatively long time.
The mixing process is the most critical since the used additives have pH different from each other. The pH of the GDC powder in water and dispersant (this latter being previously optimized through viscosimetric tests) was measured using a pH meter; the value amounts in a range of 7.5 - 8. By the addition of additives, which have a different starting pH, this value is altered.
If the pH decrease during the mixing process, the phenomenon of instability can arise; vice versa, if the ceramic suspension pH is kept at high values, the instability does not occur because the dispersant, beyond a certain maximum pH for which the ceramic powder particles are perfectly deflocculated, does not change its electrosteric function. The phenomenon of the instability results in a thickening of the slurry in a more or less evident way, depending on the variation of pH. Through various tests the minimum pH for which the agglomerate problem started to appear was determined
3.2.2 Tape casting process
The ceramic suspension film is produced by tape casting, using a device available in the laboratory. Before casting the suspension is further filtered to avoid the presence of any macroscopic agglomerate formed in the previous stage of mixing of the additives.
Doctor blade runs on a support material represented by a sheet of aluminum coated with polymeric materials (LDPE on a surface and on the other PET). Casting is realized on the LDPE side which facilitates the removal of the samples, once dried, due to its low wettability.
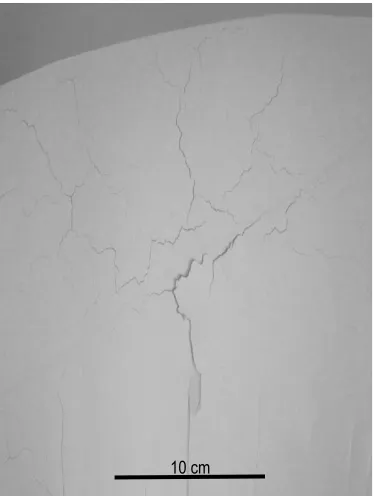
The obtained film is liquid, due to the high water content. The water is carefully removed, creating an atmosphere with constant humidity within the plexiglass case. The drying process is a critical phase, since the material tends to create cracks or to sag if it does not take place in an optimal way45, 46.
3.2.3 Analysis of viscosity
To carry out viscosimetric analysis, a rotational viscometer Myr mod was used. V2L, with a set of spindles (cylindrical rotating body to be immersed in the liquid) that allowed to measure the viscosity for a wide range of values (spindle September TL5 - TL7 , viscosity range from 1.5 to 6 ∙ 105 mPas - cP) . The fluid was maintained at a constant temperature of 25°C, as described in ASTM - " Standard Test metods for Rheological Properties of Non - Newtonian Materials by Rotational viscosimeter " ( D2196-10 ), through the use of a thermal bath (LAUDA C6). The viscosimetric analysis were performed on the suspension samples containing a fixed solid load (SL), i.e. the ratio between the volume of powder and the total volume, and by gradually varying the active part of the dispersant ( AP), i.e. the mass of active part of dispersant for powder surface. In other words the mass of the solids that actively participates in the deflocculation of the powders in water.
The same type of tests was carried out at different SL value, progressively varying the AP, to check the progress of the viscosity as a function of both AP that of SL. The measurements were made by varying the AP from 0 mg/m2 up to a PA of 1.25 mg/m2
and the rotational speed between 3 and 200 rpm.
3.2.4 GDC doping and dilatometry
The starting doping compounds were Bi(NO3)3·5H2O and LiNO3. GDC10
doping was accomplished by dissolving the nitrates in ethanol and adding the appropriate amount of GDC10. The dispersion was kept stirring on a hotplate at 90°C until complete evaporation of the ethanol. Bi-containing and Li-containing powders were calcined at 700°C and 650°C for 3 h, respectively. The powder was then ground and sieved (mesh size = 150 µm) to eliminate the largest agglomerates. Cylindrical samples (diameter = 13 mm, height = 4 mm) were formed by uniaxial pressing using 100 MPa maximum pressure. The sintering behavior of samples containing different dopant load were analyzed by dilatometry (Linseis L75 Platinum Series, Linseis Instrument) using an alumina support tube and constant heating rate of 10°C/m up to 1550°C in air flux. The Bi-containing samples were sintered in a furnace at constant heating rate of 10°C/m up to 1050°C with different holding time.
3.2.5 Production of IT-SOFC
was kept in agitation for 2 h in a high-energy mixer and de-aired for 30 min. Hence, plasticizer and binder were added and the suspension was mixed for additional 20 min. The slurry was cast on a silicone-coated polyethylene terephthalate film in a laboratory scale tape caster, with a double blade apparatus (Mistler, Yardley, PA), by using a 200 μm blade height. The relative humidity in the tape casting chamber was kept constant at 80% to avoid the formation of cracks upon drying. The recipe used for the electrolyte production is shown in Table III-4. The 2 mol% Li2O containing GDC
powder was used for 25 vol% CuO-containing cells, while for all the other cells the 5 mol% Li2O containing GDC powder was used.
A similar process was used for the production of the Cu-containing anode-supporting layer. A slurry consisting of different CuO powder amount (varying between 25 and 45 vol%), 2 mol% (for 25 vol% CuO containing cells) or 5 mol% Li2O-doped
GDC powder (65 vol%), distilled water and dispersant was produced; this was then de-aired after 2 h high-energy mixing. Plasticizer and binder were added and the suspension was tape cast (blade height = 250 μm), always controlling the relative humidity at 80%. Table III-5 shows the recipe followed for the production of the anode.
. Table III – 4 Composition of the suspension used for tape casting the electrolyte.
Material Manufacturer/provider Content (vol%)
2 or 5 mol% Li2
O-doped GDC10
Treibacher 17
Binder (Duramax B 1014)
Rohm and Haas 8
Plasticizer (Duramax B 1000)
Rohm and Haas 6
Dispersant (Darvan 821 A)
Vanderbilt Minerals 0.5
Distilled water 68.5
Table III – 5 Composition of the suspension used for tape casting the anode.
Material Manufacturer/provider Content (vol%)
5 mol% Li2
O-doped GDC
Treibacher
14.25-12.35-11.4-10.45
CuO Sigma Aldrich 4.75-6.65-
7.6-8.55 Binder (Duramax
B 1014)
Rohm and Haas 12
Plasticizer (Duramax B 1000)
Dispersant (Darvan 821 A)
Vanderbilt Minerals 2.5
Distilled water 60.5
To produce the anode-supported half cells, green disks (anode thickness ≈ 80 µm, electrolyte thickness ≈ 60 µm, diameter = 24-30 mm) were extracted by using a die cutter. The anodes disks and one electrolyte disk were stacked together and thermo-pressed at 80°C for 15 min under 30 MPa.
The cathode was produced mixing 50 wt% LSCF (Treibacher Industrie, Lot. EA 14/11.2) and 50 wt% GDC powder in ethanol (powder/solvent weight ratio = 1:1). The slurry was mixed for 2 h and terpineol (containing 4 wt% ethyl cellulose) was added in a 1:1 weight ratio with the powder. The slurry was then screen printed (diameter ≈ 20 mm) on the green half cell.
The green cells were sintered at 900°C or 950°C (heating rate = 1°C min-1) in static
air for 3 h. The cooling stage was controlled at 1°C min-1 down to 500°C, to limit the
residual stresses due to the thermal expansion coefficient difference.
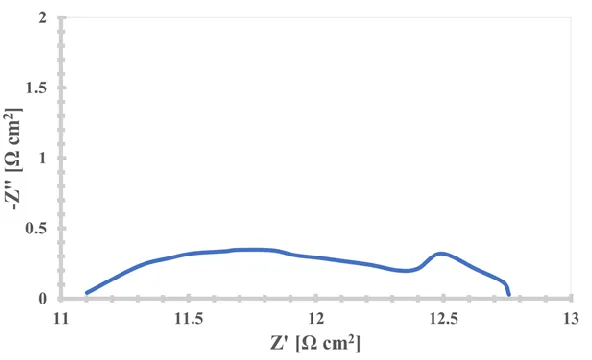
3.2.6 Electrochemical characterization
The anode reduction was performed in a controlled atmosphere, having a N2 and an air flow rate of 141 ml min-1 and 471 ml min-1, respectively. The hydrogen
flux was kept at 20 ml min-1 for 1 h and it was increased up to 200 ml min-1 until the
end of the reduction process. The electrochemical tests of 25 vol% CuO containing anode were carried out at 800°C and 700°C in a controlled atmosphere with a flux of 100 ml min-1 H2 and 500 ml min-1 air, respectively. The more than 35 vol% CuO
containing anode SOFCs were tested at temperatures between 550°C and 700°C in 200 ml min-1 H2 and 471 ml min-1 air containing flux. Electrochemical measurements
were performed by using Autolab PGSTAT302N potentiostat/galvanostat. EIS spectra were collected in the range of frequency 10 kHz e 0.01 Hz and using 10 mV perturbation amplitude. Electrochemical impedance spectroscopy parameters were evaluated at 600°C by using Zsimpwin 3.22 program.
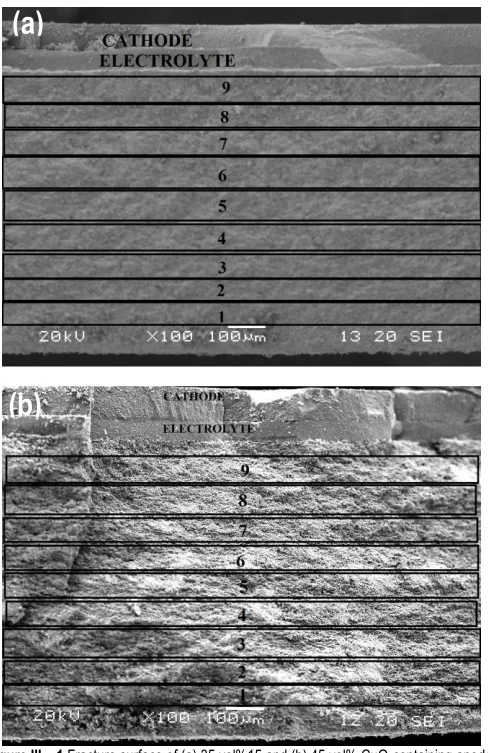
3.2.7 Sintering temperature and anode composition analysis
thickness, position 1 and 9 corresponding to the outer portion and the anode/electrolyte interface, correspondingly. For each section, Cu and Ce content was evaluated and comparison was made between cells before and after the electrochemical characterization.
Figure III – 1 Fracture surface of (a) 35 vol%15 and (b) 45 vol% CuO-containing
anode-supported SOFC
(b)
3.2.8 Analysis of catalytic activity of GDC
The reducibility of CuO and GDC was studied by reduction at controlled temperature (H2-TPR) by using a Thermo TPR/R/O 1100. The sample (≈30 mg) was
introduced in a quartz reactor placed in a tubular furnace. The furnace temperature was increased up to 850 °C (10°C/min), while a flux made of 5 vol% H2 in Ar (30
mL/min) was employed. The reaction between the hydrogen and the sample were detected by a thermal conductivity detector (TCD).
The quartz reactor (8mm DI) was placed in a tubular furnace controlled by a PID. The gas chromatograph used for gas analysis (Agilent 7890) was equipped with a column Molecular Sieve X13 (for H2, Ar, CO and CH4 separation) e by a Hayesep Q column
(per CO2). The gas was analysed by a TCD revealer.
Two different reactions were studied:
𝐶𝐻4+ 𝐶𝑂2= 2𝐻2+ 2𝐶𝑂(3,1) 2𝐶𝐻4+ 𝑂2= 4𝐻2+ 2𝐶𝑂 (3.2)
The catalyst (200 mg) was activated by reducing in H2 (700°C, ca. 30 min). For the
the reaction 3.1 (Dry reforming of Methane, DRM) was employed a gas mixture of 100 mL/min with a volume ratio CH4:CO2:N2:He=10:10:20:60, while for the reaction 3.2
(Partial oxidation of Methane, POM) a gas mixture of 100mL/min with a volume ratio of CH4:CO2:N2:He =10:1:20:69 was used.
The reactant conversion was calculated through the gas composition by the eq:
𝑋𝑖(%) = 100 (1 − 𝐶𝑖 𝐶0𝑁2
𝐶0 𝑖𝐶𝑁2
) (3.3)
Where Xi represents the reactant conversion (i=CH4, CO2 e O2), 𝐶0
𝑖 and 𝐶𝑖 are the
Chapter IV
Results and discussion
Part of this chapter has been published in:
ECS Transaction,
“Effect of Bismuth Oxide as Sintering Aid for Gadolinia-doped Ceria at 1050°C”,
Volume 68, issue 1 (2015), 413-420
Ceramic Engineering and Science Proceeding,
“Production and co-sintering at 950°C of planar half-cells with CuO-GDC cermet
supporting anode and Li2O-doped GDC electrolyte”,
Volume 37, Issue 3 (2016), 31-38, The American Ceramic Society
Journal of Power Sources
“Production of planar copper-based anode supported intermediate temperature solid oxide fuel cells cosintered at 950°C”
vol. 328, pp. 235-240, 2016.
Journal of the Ceramic Society of Japan
“Performance and evolution of planar copper-based anode-supported solid oxide fuel cells”
Volume 125 [4] 313-316 2017
International Journal of Hydrogen Energy
“Effect of anode thickness and Cu content on consolidation and performance of planar copper-based anode-supported SOFC”
To be published doi: 10.1016/j.ijhydene.2017.03.221
Fuel Cells
“Influence of copper-based anode composition on intermediate temperature solid oxide fuel cells performance”
4.1 Production of Gadolinia-doped Ceria dense electrolyte 4.1.1 Analysis of viscosity
As described in chapter 3, the dispersant amount was optimized by using the viscosimetric tests47. It was examined by measuring the viscosity in an Active Part
(AP) range between 0 and 1.25 mg m-2. The viscosity for AP=0 has not been
evaluated, since the slurry does not presented as a viscous fluid but as powder agglomerated and thickened, similar to a dough. The starting Solid Load (SL) was chosen based on the lab experience, this suggesting a SL between 16 and 20 vol%, in order to provide a suspension more viscous than water but not too dense. General results are shown in Figure IV – 1.
Figure IV – 1. Slurry viscosity as a function of dispersant content (AP) and solid load (SL)
As one can observe in Figure IV – 1, the minimum viscosity, for GDC powders with particle size and SSA equal to those used in the laboratory, is obtained in an AP range particularly low, equal to 0.1 – 0.3 mg m-2, for each SL value. The absolute minimum
4.1.2 Additives optimization
The amount of additives in the suspension was properly fixed, due to the onset of two main problems:
1. cracking of the green
2. instability of the suspension during mixing
To improve the first aspect many tests at increasing the active part of the additives were performed. Through various analyses, it was verified that the optimum ratio between the active parts of binder and plasticizer should be about 1:1. If the ratio of the two additives changes, the tape presents a high risk of cracking for the high stiffness, when the ratio is in favor of the binder, or poor mechanical strength, when it was in favor of the plasticizer. Once optimized the ratio between the additives AP, the minimum quantity to be introduced within the suspension to obtain a green with the desired properties was defined. A minimum value of additives to be included in the slurry was identified, in order to eliminate the cracks in the drying step, for AP of both binder and plasticizer variables in the range between 5 - 6.
4.1.3 Tape casting process
manually but carefully fractured along the thickness. The additives amount was optimized in the GDC slurry production. The optimization of the dispersant and of the others additives allows to achieve a gas tight microstructure, as shown in Figure IV - 4 and Figure IV - 5.
Figure IV – 2. Cracked green material because of an incorrect drying process
Figure IV – 3. Defect free green surface
10 cm
Figure IV – 4. Cross surface of a GDC sample sintered for 3h at 1550 °C
Figure IV – 5. Fracture surface (produced by manual fracture) of a GDC sample sintered for 3h
4.2 Effect of Bismuth Oxide as Sintering Aid for Gadolinia-doped Ceria at 1050°C
The effect of the bismuth oxide as sintering aid on shrinkage (ε) and shrinkage rate (dε/dt) of GDC10 is shown in Figure IV - 6 and Figure IV - 7.
Figure IV - 6. Effect of Bi2O3 on the GDC10 sintering behaviour, measured at 10°C/min in air.
Figure IV - 7. Shrinkage rate curves for three different Bi2O3 loads.
shrinkage rate changes substantially in the presence of Bi2O3, especially for loads in
excess to 6 mol%: for lower content, the minimum shrinkage rate (i.e maximum sintering rate) is recorded at about 1100-1200°C; conversely, for dopant concentration of 6 and 8 mol% two additional minima for (dε/dt) are shown at ≈730°C and ≈880°C. This points out that additional mechanisms for sintering are activated, probably correlated with phase changes in the GDC-Bi2O3 system occurring at such
temperatures when Bi2O3 concentration is sufficiently high.
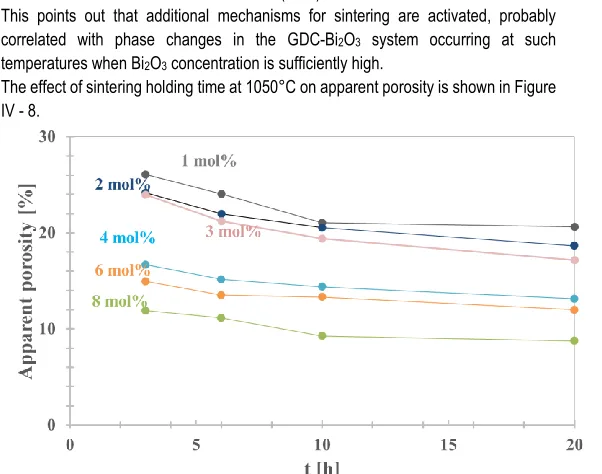
The effect of sintering holding time at 1050°C on apparent porosity is shown in Figure IV - 8.
Figure IV - 8. Effect of different holding time and Bi2O3 load on GDC10 apparent porosity for
sintering at 1050°C.
As expected, the apparent (“open”) porosity decreases monotonically as the holding time is increased. This accounts for denser samples and more limited closed porosity. The sum of the apparent porosity and relative density is always in excess to 95% after 20 h sintering, thus leading to closed porosity values lower than 5%. On this basis, the open porosity represents the key parameter to detect how the Bi2O3 content affects
the GDC10 sinterability. From Figure IV - 8, one can observe that samples containing 6 mol% Bi2O3 show the lowest apparent porosity for any holding time at 1050°C.
Figure IV - 9. Relative density as a function of Bi2O3 content after sintering at 1050°C for different
holding time.
One can observe that the relative density increases with Bi2O3 load up to 6 mol% and
then decreases. The same is true for the radial shrinkage (Figure IV-10), which is maximum at 6 mol% Bi2O3 content.
Figure IV – 10. Radial shrinkage as a function of Bi2O3 content after sintering at 1050°C for
different holding time.
performed under constant heating rate condition and, therefore, the holding at 1050°C appears to have a more important effect on final density and porosity.
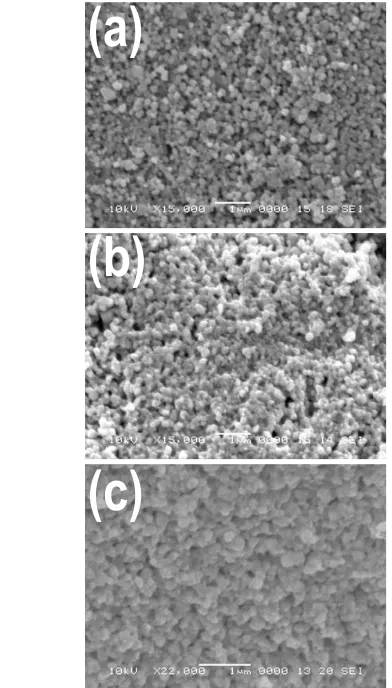
The observation of the fracture surfaces allows to point out the improved densification caused by the addition of 6 mol% Bi2O3. It has to be stated that, although 8 mol%
showed a densification equal or not significantly higher than 6 mol%, it is preferable to keep the doping at a lower value, in order to affect as less as possible the ionic conductivity property of the compound, the aim being the production of a GDC-based electrolyte. From the observations of the fracture surfaces, the improved sintering caused by both different doping and different holding time is clear (Fig. 11). Figure IV-11 (a) shows the effect of 2 mol% Bi2O3 doping after 3 h at 1050°C. It is easy to
observe how the structure corresponds to the starting sintering stage and almost no flat contacts among particles or grain boundaries are present. The situation improves after 10 h (Figure IV - 11(b)) for the same doping concentration while sintering is in an advanced stage in Figure IV - 11(c), where the structure of 6 mol% Bi2O3-containing
sample after 10 h is shown; here, the porosity is isolated and sintering is moving towards the final stage.
Figure IV - 11. Fracture surface of (a) 2 mol% Bi2O3-containing sample sintered for 3 h, (b) 2
mol% Bi2O3-containing sample sintered for 10 h and (c) 6 mol% Bi2O3-containing sample sintered
for 10 h (sintering temperature = 1050°C).
(b)
(c)
(a)
(a)
(b)
4.3 Effect of Lithium Oxide as Sintering Aid for Gadolinia-doped Ceria
The effect of Li2O on GDC10 pellets sintering behavior is shown in Figure IV-12
Figure IV - 12. Effect of Li2O on GDC10 sintering behavior (deformation, ε, as a function of
temperature).
An evident decrease of the onset temperature can be pointed out, this decreasing from about 1100°C for pure GDC10 to ≈ 600°C when 5 mol% Li2O is added. Samples
containing 2 mol% and 5 mol% Li2O-doping show a full densification at ≈ 950°C and
at ≈ 850°C, respectively. Therefore, with regard to the fundamental requirement related to the aim of the present work, i.e. reduce the GDC sintering temperature below the CuO melting point, Li2O-content equal to 2 mol% could be sufficient to achieve
sintering at 900°C. The promising results allowed to produce Li-GDC based electrolyte through water-based tape casting. Nevertheless, the doping effect needs to be amplified as much as possible; as a matter of fact, the dilatometric curves in Fig. IV-12 are referred to cylindrical pellets contain only powder while tape casting suspension, has a much lower solid content, not reaching 20 vol%. Thus, the complete densification is partially inhibited (probably due to the distance between powder particles). Consequently, in order to obtain similar densification, larger amount of sintering aid is required. Moreover, in previous works20, 48, 2 mol% Li2O doping resulted
The powder chosen for producing the electrolyte is the 5 mol% Li2O-doped GDC. The
limited SL lower than 20% makes the reaching of fully dense monolithic electrolyte at the desired temperatures (950°C) not possible, as shown in Figure IV - 13.
Figure IV - 13. Cross section (produced by manual fracture) of 5 mol% Li2O -doped stand-alone
tape cast sample sintered at 950°C.
Therefore, samples obtained by tape casting need an additional sintering aid to achieve densification at the desired temperature. Such aim was identified in the mechanical effect of the supporting anode. In fact, when a Cu-containing supporting anode is coupled with the electrolytic layer, gas tight microstructure can be achieved, this being accounted for by the different shrinkage rate (dε/dt) between the two layers that develops compressive stresses upon sintering in the thinner (electrolyte) one. Such stresses can be expressed as49:
𝑑𝜎 𝑑𝑡⁄ = 𝐸 (𝑑𝜀 𝑑𝑡𝑒𝑙−
𝑑𝜀
𝑑𝑡𝑎𝑛) (4.1)
where E is the electrolyte Young’s Modulus, dε/dtel eland dε/dtan the shrinkage rate of
the electrolyte and of the anode, respectively. When the anode is the faster shrinking layer (i.e., when 𝑑𝜀
𝑑𝑡𝑒𝑙− 𝑑𝜀
𝑑𝑡𝑎𝑛>0), the stress state described by Eq. (4.1) is
compressive and activates the densification. The behaviour of different CuO-GDC cermet anode-supporting half-cells both in the heating and in the cooling stage of sintering was compared. Such half-cells were produced by coupling the 2 mol% Li2
O-doped GDC10 electrolyte with the anodes, whose composition is summarized in Table IV-1.
Figure IV - 14. Anode and electrolyte shrinkage rate upon sintering.
Such cermets are characterized by the same relative amount of metallic and ceramic oxides, but in Anode “A” the ceramic part is 2 mol% Li2O-doped GDC10, while in
Anode “B” undoped GDC10 is used. As one can observe, in the former case it is possible to achieve an earlier sintering and, consequently, a larger shrinkage rate (i.e., lower 𝑑𝜀
𝑑𝑡𝑎𝑛) at the same temperature. Therefore, according to Eq. 4.1, if anode “A” is
considered, the electrolyte starts being in a compressive tensile state at a temperature ≈20°C below (at ≈850°C instead of ≈870°C), this allowing to obtain the desired sintering before. This suggested to use Li-doped GDC10 for the ceramic part of the anode.
The Thermal Expansion Coefficient (TEC) is the parameter that has to be considered to fix the amount of metallic oxide in the anode. A TEC mismatch between two coupled layers gives rise to thermal strain (εres) upon cooling, which result in residual stresses.
At a first approximation, the strain is equal to50:
𝜀
𝑟𝑒𝑠= ∫
(𝛼
𝑎𝑛− 𝛼
𝑒𝑙) 𝑑𝑇
𝑇𝑠𝑡𝑟𝑒𝑠𝑠 𝑓𝑟𝑒𝑒
𝑇𝑟𝑜𝑜𝑚
(4.2)
where Troom is the room temperature, Tstress free the stress free temperature (always
lower than sintering temperature)51-53, αan and αel are the anode and electrolyte TEC,
the TEC mismatch is strongly minimized and the strain is limited and a defect free electrolyte can be obtained (Figure IV-16). Figures IV - 17 shows how an almost fully dense electrolytic microstructure (with closed porosity) was obtained by coupling and sintering the anode “A” with the electrolyte; Figure IV – 18 shows a cross section of the entire half-cell.
As a general conclusion, it is possible to state that, to achieve the GDC densification at a temperature compatible with che CuO melting point, a 5 mol% Li2O-doping is
needed in the electrolyte tape casting recipe and the additional aid of the supporting anode is also required. Moreover, a certain amount of Li-doping is necessary in the Cu/GDC anodic cermet to further enhance the electrolyte densification.
Table IV – 1 Composition of the electrolyte and of the tested anodes.
Relative amount [vol%]
5 mol%
Li2O-doped
GDC10
Undoped
GDC10
CuO
Electrolyte
100
0
0
Anode A
70
0
30
Anode B
0
70
30
Anode C
60
0
40
Figure IV - 16. Electrolyte surface after cosintering with anode A for 3 h at 950°C.
Figure IV - 17. Cross section (produced by manual fracture) of the electrolyte after cosintering
Figure IV - 18. Cross section (produced by manual fracture) of the half-cell cosintered for 3 h at
950°C.
4.4 CuO and GDC reduction by TPR
Fig IV – 19 reports the TPR profiles of 45 and 50 vol% CuO containing cermet.
Figure IV – 19. H2-TPR profiles of 50 and 45 vol% CuO containing cermet).
![Table IV – 1 Composition of the electrolyte and of the tested anodes. Relative amount [vol%]](https://thumb-us.123doks.com/thumbv2/123dok_us/529673.2052896/51.420.70.350.190.525/table-iv-composition-electrolyte-tested-anodes-relative-vol.webp)