Int. J. Electrochem. Sci., 8 (2013) 11814 - 11822
International Journal of
ELECTROCHEMICAL
SCIENCE
www.electrochemsci.org
Short Communication
Impact on Fuel Transport Efficiency in Anode of Planar Solid
Oxide Fuel Cells
Fuxing Miao*
School of Mechanical Engineering and Mechanics, Ningbo University, 818 Fenghua Road, Ningbo, 315211, China
*
E-mail: [email protected]
Received: 2 July 2013 / Accepted: 29 July 2013 / Published: 10 September 2013
This work establishes a mathematical model of fuel transport efficiency in anode that permeates from the surface to the triple phase boundaries through the porous electrode of solid oxide fuel cells. And the relationship between the fuel transport efficiency and the parameters of the porous anode and gas channel is verified with the reported experimental results. The result shows that the fuel transport efficiency in anode is proportional to the porosity of the supported-anode and the length of the gas channel on interconnects. The fuel transport efficiency is also inversely proportional to the porosity and height of the gas channel on interconnect and the thickness of the porous supported-anode. When the porosity of the supported- anode is fixed, the fuel transport efficiency can be improved by reducing the porosity or extending the gas channel length, or reducing the gas channel height on the interconnect, or reducing the thickness of the porous-anode. When the porosity, height, and length of the gas channel on the interconnect are fixed, the fuel transport efficiency in anode can be improved by increasing the porosity or reducing the thickness of the porous anode.
Keywords: Porosity; Gas transport; Transport efficiency; Fuel utilization; Solid oxide fuel cell
1. INTRODUCTION
anode-supported cell with extensive prospects due to its special requirements on working temperature, environment, and interaction between components [4]. Single cells, due to limited energy, are well known to combine in series or in parallel to a SOFC stack to obtain necessary energy [5]. Hence, the stack is a core component in a SOFC power generation system, and its performance directly determines whether the SOFC power generation system can be commercialized.
To meet the demand for commercialization, specific requirements are imposed on the performance of a SOFC stack. For example, the power density should exceed 0.4 Wcm-2 under the working voltage of 0.7 V, the fuel utilization must be ≥70%, and the lifetime should reach 40,000 h [6]. To achieve these targets, researchers have studied the factors affecting the density of output power and the lifetime of a SOFC stack. The result shows that the interface contact between the cell cathode and the metal interconnect is the key factor affecting the density and lifetime of output power [7-9]. Hence, the power density and lifetime of a SOFC stack can be remarkably increased by improving the interface contact between the cathode and the interconnect. However, researchers have found that despite the remarkably improved electrical performance and lifetime of a SOFC stack, its fuel utilization is far less than the requirement of above 70% in most situations. For example, L. Blum et al. [10] reported that the fuel utilization of a stack under the working condition was about 40%, showing a huge gap from the requirements for commercialization.
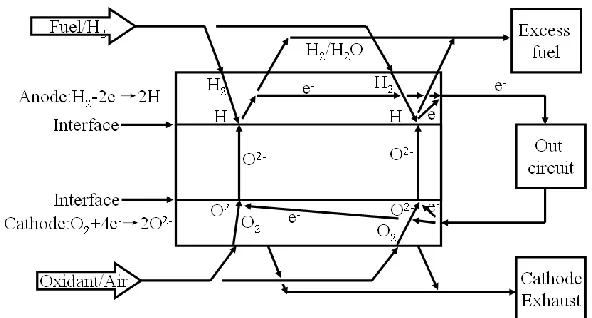
Figure 1. Schematic illustration of the working principle for SOFC
[image:2.596.149.445.381.540.2]
Generally, fuel utilization can be increased to a certain degree along with the increasing electric performance by improving the interface contact to boost the effect of electron collection. However, such means still can’t enable fuel utilization to reach the efficiency required for commercialization, which has a direct correlation to the impact on the fuel transport efficiency in supported-anode. As to the Ni-YSZ/YSZ/LSMYSZ type cell, the cell supported material was initially NiO-YSZ with various thickness. For example, Mukhopadhyay et al. [12] reported a thickness of 1.2 mm to 1.5 mm, and Bora et al. [13] reported a thickness of 0.4 mm to 0.6 mm. The structure of SOFC stack is also different. For example, Schuler et al. [14] and Herle et al. [15 ] adopted a co- flow structure, where the cell active area was 50 cm2 and the thickness of supported-anode was 0.4 ~ 0.6 mm, Huang et al. [16] adopted a cross-flow structure, where the thickness of supported-anode was 0.55 mm with various cell area, Yokoo et al. [17] adopted an internal flow structure, where the cell active area was 60 cm2 and the thickness of supported-anode was 1.1 mm. Hence, the flow rate of fuel from the gas channel and the fuel permeating into the triple phase boundaries through the porous supported-anode are various among them, resulting in different fuel utilization and electrical efficiency.
As to the supported-anode planar SOFCs, researchers became aware of the importance of the anode structure on cell performance, and began to improve the electrical performance by adjusting the cell structure, which subsequently improved fuel utilization as well [18-19]. In addition, the fuel utilization, in turn, has a significant influence on cell performance [20]. Hence, researchers conducted numerous simulation studies on fuel gas transport inside the anode, and established a transport model of fuel gas to obtain the mole fraction of gas transport inside the anode under fixed porosity, cell size, and other parameters [21-25]. In addition, they analyzed the fuel gas transport and distribution inside the cell electrode. However, the research on fuel transport efficiency in the porous anode was generally ignored, which imposes limits on the SOFC stack to improve its electrical performance and its actual fuel utilization. Hence, the aim of this work is to establish a mathematical model of the fuel transport efficiency that permeates to the triple phase boundaries from the anode side through the porous electrode, and analyze the factors on fuel transport efficiency on the anode side by comparing it with the published experimental result to further verify the model, which are helpful to provide a reference for adopting measures to improve the electrical performance of SOFCs and its actual fuel utilization.
2. THORETICAL ANALYSIS AND MODELING
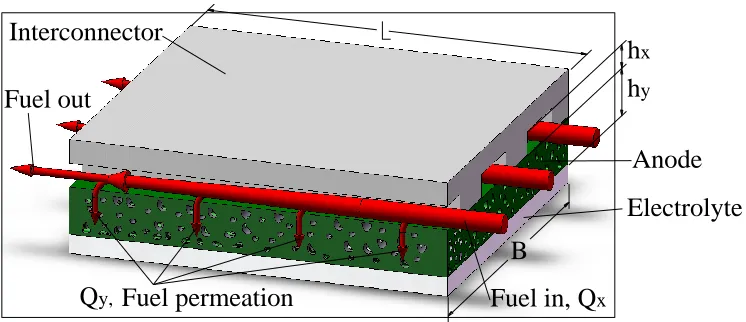
Fig. 2 shows the gas transport in a working SOFC. When the gas is fed from the entrance, part of fuel gas is transmitted to the exit through the gas channel of the metal interconnector. During this process, part of gas is permeated to the triple phase boundaries through the porous support-anode and reacts with the oxidant gas. Assuming the Qx as the flow rate of fuel through the gas channel of the metal interconnect, it can be written as the following based on the literature [26]
x x effx x x
A D C
Q
L
(1)
m2s−1, Ax is the total area of diffusion along the cross-section of the metal interconnector's gas channel, m2,εx is the porosity of gas flowing along the gas channel of the metal interconnector, ΔCx is the concentration difference between two ends of gas channels on the metal interconnector, L is the gas channel length on the interconnect surface, m.
Fuel in, Qx
Interconnector
Electrolyte Anode
Fuel permeation Fuel out
Qy,
hx
hy
B
Figure 2. Schematic illustration of the gas transport process
According to the reference reported [27-28], the effective diffusion coefficient in Formula (1) can be expressed as
1 1 1
eff b k
D D D (2)
where Db is the self-bulk diffusion coefficient of gas, m2 s−1, Dk is the Knudsen coefficient. The size of gas channel on the metal interconnector is normally quite large. Therefore, gas diffuses in the gas channel of metal interconnect are mainly determined by the flow of viscous gas and molecular diffusion, and the Knudsen diffusion may be disregarded [29]. The diffusion coefficient for this work can thus be expressed as
eff y b
D D (3)
As illustrated in Fig. 2, the cross-section area in Formula (1) can be expressed as
x
=B h
x
A (4)
where B is the width as shown in Fig.2, m, hx is the gas channel width on the interconnector, m. Formulas (3) and (4) are substituted into Formula (1), then the gas flow on the gas channel of the metal interconnect can be expressed as
x
Q =D B h x
x b x
C L
(5)
As illustrated in Fig. 2, when gas transports through the gas channel of metal interconnect, part of gas permeates to the triple phase boundaries through the pores. The flow rate that permeates to the triple phase boundaries can be expressed by the formula below [30]
y y
y
y
A P
Q
h
[image:4.596.112.485.166.327.2]
where Qy is the flow rate of fuel that permeates to the triple phase boundaries through the porous electrode, m3s-1, Ay is the total area of diffusion along the cross-section of the porous support-anode, m2, εy is the porosity of the porous anode, ΔPy is the pressure drop from entrance to exit of the micropores of the porous anode, Pa, hy is the thickness of the porous anode, m, d is the pore diameter inside the porous anode, m, μ is the permeation coefficient of gas inside the porous electrode, m2, η is the dynamic viscosity of the gas fluid, Pa s.
The gas permeation parameter can be obtained through the formula below [30]
2
32 y
d
(7)
As illustrated in Fig. 2, the cross-section area in Formula (6) can be expressed as
y=B L
A (8)
By substituting Formulas (7) and (8) into Formula (6), the flow rate of fuel gas through the porous anode can be expressed as
2
32
y y
y
y
d B L P
Q h
(9)
Assuming the the flow rate of Qx is the total flow, based on the above description, the transport efficiency Fu of fuel gas from the porous supported-anode to the triple phase boundaries is
y u
x
Q F =
Q (10)
Hence, the Formula (10), which refers to the fuel transport efficiency, can be expressed as
2 2
u
x
F =
32 D h
y y
b x y x
P d L C h
(11) Assume 2 32 D y b x P d C
(12) Hence, Formula (11) can be simplified as
2 u x F = h y y x L h
(13)
3. RESULTS AND DISSCUSSION
remain unchanged, fuel transport efficiency can be increased by extending the length L of the gas channel on the metal interconnect or by reducing its porosity εx.
To verify the theoretical model, the experimental result reported in literature was applied by F. Zhao et al. [31], in which the work investigated the effect of the parameters of the supported-anode on cell performance.
30 40 50 60 70 80
0 10 20 30 40 50 60 70 80 90 100
Experimental Theoritical
F
u
e
l
u
ti
li
z
a
it
o
n
/%
Porosity/%
a)
0.5 1.0 1.5 2.0 2.5 8
16 24 32 40 48 56 64
72 Experimental Theoritical
F
u
e
l
u
ti
li
z
a
it
o
n
/%
Anode thickness/mm
b)
Figure 3. Comparison of the theoretical calculation result and the calculated result in literature
[image:6.596.148.422.185.590.2]
output power density of the cell under 0.7 V is in the sequence of 0.58, 0.71, 0.90, and 1.06 W cm-2 when the thickness of the cell anode drops from 2.45 mm to 1.45, 1.0, and 0.5 mm, respectively. The formula reported by W. Winkler [32] is applied to calculate the fuel utilization, the value of fuel utilization in the experiment is in the sequence of 27.9%, 46.5%, 58.1%, and 69.8%.
Fig. 3 shows the experimental estimation reported in literature and the theoretical estimation by means of Formula (13). Fig. 3(a) compares the theoretical calculation of the fuel transport efficiency under different porosities of the supported-anode and the actual fuel utilization that resulted from the experiment. The calculation assumes that the theoretical transport efficiency Fu is consistent with the fuel utilization that resulted from the experiment when the porosity is 32%. Since the fuel transport efficiency Fu is linearly proportional to the porosity, the theoretical calculation of Fu is in the sequence of 39.5%, 59.3%, 70.4%, and 93.8% as the porosity increases. The theoretical calculation result of Fu is quite close to the actual fuel utilization when the porosity is 32%, 48%, and 57%, respectively. When the porosity is 76%, the theoretical calculation of Fu deviates more from the actual fuel utilization that resulted from the experiment. Fu in this work indicates the transport efficiency of fuel that permeates from the surface to the triple phase boundaries through the porous electrode. The actual fuel utilization that resulted from the experiment is the efficiency of gas that permeates to the triple phase boundaries as it takes part in the chemical reaction. When the porosity of the support-anode is 76%, the transport efficiency of fuel is much greater than the actual utilization, i.e., the flow rate of fuel gas that permeates to the triple phase boundaries is far more than the flow being utilized in a timely manner. The actual fuel utilization can’t be improved further even the fuel transport efficiency is higher due to the limited cell performance. The result also shows that it is unnecessary to increase the porosity further when the fuel utilization has reached its maximum.
Fig. 3(b) compares the theoretical calculation of the fuel transport efficiency under different anode thicknesses and the actual calculation of fuel utilization that resulted from the experiment. Assuming that the fuel transport efficiency Fu is consistent with the actual fuel utilization when the thickness is 0.5 mm, as the thickness increases, the fuel transport efficiency reduces accordingly and becomes smaller than the actual utilization by 23.2%, 22.4%, and 13.7%, respectively, indicating that the big difference between them. It can be deduced that the difference perhaps results from the results that the actual fuel transport efficiency Fu is much higher than the actual fuel utilization when the thickness of anode is 0.5 mm. Assuming that the fuel transport efficiency Fu is consistent with the actual fuel utilization when the thickness is 0.5 mm, the fuel transport efficiency will naturally be lower than the actual fuel utilization with the increasing thickness. However, as the thickness increases, declining trends of the fuel transport efficiency Fu is consistent with that of the actual fuel utilization. Based on Fig. 3(b), when the anode gets thicker, the fuel transport efficiency gets closer to the actual fuel utilization when the porosity is 48%, verifying the theoretical model.
4. CONCLUSIONS
This work built a mathematical model of the fuel transport efficiency of SOFCs that permeates from the cell surface to triple phase boundaries through the porous anode:
2
u
x
F = h
y
y x
L h
of this mathematical model indicates that the fuel transport efficiency that permeates to the triple phase boundaries through the porous supported electrode is proportional to the porosity of the support electrode and the length of the interconnector’s gas channel, and inversely proportional to the porosity and height of the interconnector’s gas channel and the thickness of the porous supported electrode. The actual utilization of SOFC is quite consistent with the trend of the theoretical calculated fuel transport efficiency, which verifies the theoretical model. Hence, the fuel transport efficiency can be increased by reducing the porosity or extending the gas channel length, or reducing the gas channel height on the metal interconnect, or by decreasing the size or increasing the porosity of the porous electrode, which will result in the higher actual fuel utilization.
ACKNOWLEDGEMENT
This work is supported by the opening project of State Key Laboratory of Explosion Science and Technology (Beijing Institute of Technology) with the opening project number of KFJJ13-7M, and the Impact and Safety of Coastal Engineering Initiative, a COE Program of Zhejiang Provincial Government at Ningbo University (Grant No.zj1204 and No.zj1221).
References
1. S.C Singhal, Solid State Ionics, 135(2000)305. 2. N.Q. Minh, Solid State Ionics, 174(2004)271.
3. W.Z. Zhu, S.C. Deevi, Mater. Sci. and Eng. A,362(2003)228. 4. T. Tsai, S.A. Barnett, Solid State Ionics, 93(1997) 207.
5. T.L Wen, D. Wang, H.Y. Tu, M. Chen, Z. Lu, Z. Zhang, H. Nie, W. Huang, Solid State Ionics, 152-153(2002)399.
6. J.P.P. Huijsmans, F.P.F. van Berkel, G.M. Christie, J. Power Sources, 71 (1998) 107. 7. S.P. Jiang, J.G. Love, L. Apateanu, Solid State Ionics, 160(2003)15.
8. W.B. Guan, H.J. Zhai, L. Jin, T.S. Li, W.G. Wang, Fuel Cells, 11(2011)445. 9. W.B. Guan, L. Jin, X. Ma, W.G. Wang, Fuel Cells, 12(2012)1085.
10. L. Blum, U. Packbier, I. C. Vinke, L.G. J. deHaart, Fuel Cells, 2012,DOI: 10.1002/fuce.201200151.
11. N.Q. Minh, J. Am. Ceram. Soc., 76(1993)563.
12. M. Mukhopadhyay, J. Mukhopadhyay, A.D. Sharma, R.N. Basu, Solid State Ionics, 233 (2013) 20.
13. B. Timurkutluk, C. Timurkutluk, M.D. Mat, Int. J. Energy Res., 36(2012)1383.
14. J. Andreas Schuler, Z. Wuillemin, A. Hessler-Wyser, C. Comminges, N.Y. Steiner, J. Van herle, J. Power Sources, 211 (2012) 177.
15. J. Van herle, D. Perednis, K. Nakamura, S. Diethelm, M. Zahid, A. Aslanides, T. Somekawa, Y. Baba, K. Horiuchi, Y. Matsuzaki, M. Yoshimoto, O. Bucheli, J. Power Sources, 182 (2008) 389. 16. C.M. Huang, S.S. Shya, C.H. Lee, J. Power Sources, 183 (2008) 205.
17. M. Yokoo, Y. Tabat, Y. Yoshid, K. Hayashi, Y. Nozaki, K. Nozaw, H. Arai, J. Power Sources, 178 (2008) 59.
18. Y. Patcharavorachot, A. Arpornwichanop, A. Chuachuensuk, J. Power Sources, 177 (2008) 254. 19. M. Mukhopadhyay, J. Mukhopadhyay, A. Das Sharma, R.N. Basu, Solid State Ionics, 233 (2013)
20.
21. W. Lehnert, J. Meusinger, F. Thom, J. Power Sources, 87(2000)57. 22. Y.X. Shi, N.S. Cai, C. Li, J. Power Sources, 164 (2007) 639.
23. A.S. Joshi, K.N. Grew, A.A. Peracchio, W.K.S. Chiu, J. Power Sources, 164 (2007) 631. 24. M. Garca-Camprub, A.Sa´ nchez-Insa, N. Fueyo, Chem. Eng. Sci., 65 (2010) 1668. 25. W. Kong, H.Y. Zhu, Z.Y. Fei, Z.J. Lin, J. Power Sources, 206 (2012) 171.
26. Q. Zheng, J. Xu, B. Yang, B.M. Yu, Physica A, 392 (2013) 1557. 27. W.G. Pollard, R.D. Present, Physical Review, 73(1948)762.
28. D.Q. Mu, Z.S. Liu, C. Huang, N. Djilali, Microfluid Nanofluid, 4(2008) 257. 29. W. Kast, C.R. Hohenthanner, Int. J. Heat Mass Transfer, 43 (2000) 807.
30. T. Isobe, Y. Kameshima, A. Nakajima, K. Okada, Y. Hotta, J. Eur. Ceram. Soc., 27 (2007) 53. 31. F. Zhao, A.V. Virkar, J. Power Sources, 141 (2005) 79.
32. W. Winkler, J. Power Sources, 86 (2000)449.