© 2017 AJAST All rights reserved. www.ajast.net
Improved Fuzzy C Means Algorithm Based on Robust Information Clustering for
Image Segmentation
P.Maheswari
1, K.Sankaragomathy
2, M.Ramya
3and B.AnishFathima
41UG Scholar, Department of Electronics and Communication Engineering, Sri Krishna College of Engineering and Technology, Coimbatore, India. 2UG Scholar, Department of Electronics and Communication Engineering, Sri Krishna College of Engineering and Technology, Coimbatore, India. 3UG Scholar, Department of Electronics and Communication Engineering, Sri Krishna College of Engineering and Technology, Coimbatore, India. 4Assistant Professor, Department of Electronics and Communication Engineering, Sri Krishna College of Engineering and Technology, Coimbatore, India.
Article Received: 22 March 2017 Article Accepted: 31 March 2017 Article Published: 03 April 2017
1.INTRODUCTION
In image processing is any form of signal processing for which the input is an image, such as a photography or video frame the output of image processing may be either an image or a set of characteristics or parameters related to the image. Most image processing technique involve treating the image as a two dimensional signal and applying standard signal-processing techniques to it.
Image processing usually refers to digital image processing, but optical and analog image processing also are possible. This article is about general techniques that apply to all of them. The acquisition of images (producing the input image in the first place) is referred to as imaging.
Closely related to image processing are computer graphics and computer vision. In computer graphics, images are manually made from physical models of objects, environments, and lighting, instead of being acquired (via imaging devices such as cameras) from natural scenes, as in most animated movies.
Computer vision, on the other hand, is often considered high-level image processing out of which a machine/computer/software intends to decipher the physical contents of an image or a sequence of images (e.g., videos or 3D full-body magnetic resonance scans).
In modern sciences and technologies, images also gain much broader scopes due to the ever growing importance of scientific visualization of often large-scale complex scientific/experimental data. Examples include microarray data in genetic research, or real-time multi-asset portfolio trading in finance.
2. IMAGE SEGMENTATION
In image segmentation is the process of partitioning a digital image into multiple segments (sets of pixels, also known as super pixels). The goal of segmentation is to simplify and/or change the representation of an image into something that is more meaningful and easier to analyze. Image segmentation is typically used to locate objects and boundaries (lines, curves, etc.) in images. More precisely, image segmentation is the process of assigning a label to every pixel in an image such that pixels with the same label share certain characteristics.
The result of image segmentation is a set of segments that collectively cover the entire image, or a set of contours extracted from the image (see edge detection). Each of the pixels in a region are similar with respect to some characteristic or computed property, such as color, intensity, or texture. Adjacent regions are significantly different with respect to the same characteristic(s). When applied to a stack of images, typical in medical imaging, the resulting contours after image segmentation can be used to create 3D reconstructions with the help of interpolation algorithms like Marching cubes.
3. CLUSTERING METHODS
The K-means algorithm is an iterative technique that is used to partition an image into K clusters. The basic algorithm is 1. Pick K cluster centers, either randomly or based on some heuristic.
2. Assign each pixel in the image to the cluster that minimizes the distance between the pixel and the cluster center 3. Re-compute the cluster centers by averaging all of the pixels in the cluster
4. Repeat steps 2 and 3 until convergence is attained (i.e. no pixels change clusters).
A B S T R A C T
The image segmentation is to simplify or change the representation of an image into something that is more meaningful and easier to analyze. Fuzzy C Means (FCM) is one of the most widely used methods for image segmentation, since it is able to retain more information from the original image without any prior information. Fuzzy C Means algorithm with spatial constraints have been proven effective of image segmentation, they have some disadvantage such as insensitiveness to noise to some extent. This work is considering the above said shortcomings to develop novel Fuzzy C Means algorithm based on robust information clustering (RIC) for segmenting medical images. Our aim is to develop a new automated segmentation algorithm based on effective Fuzzy C Means which incorporates spatial constrain term and modifying by robust information clustering techniques for medical image segmentation. The performance of proposed method is proven through the experimental work. The present work experiments the existing FCM algorithm and explores the segmentation of images through Fuzzy C Means.
© 2017 AJAST All rights reserved. www.ajast.net In this case, distance is the squared or absolute difference
between a pixel and a cluster center. The difference is typically based on pixel color, intensity, texture, and location, or a weighted combination of these factors. K can be selected manually, randomly, or by a heuristic. This algorithm is guaranteed to converge, but it may not return the optimal solution. The quality of the solution depends on the initial set of clusters and the value of K
4. FUZZY C MEANS
Fuzzy c means is a method of clustering which allows a piece of data to belong two or more clusters. Fuzzy C-means Clustering (FCM), is also known as Fuzzy ISODATA. The FCM employs fuzzy partitioning such that a data point can belong to all groups with different membership grades between 0 and 1.FCM is an iterative algorithm. The aim of FCM is to find cluster centers (centroids) that minimize a dissimilarity function. Data clustering is the process of dividing data elements into classes or clusters so that items in the same class are as similar as possible, and items in different classes are as dissimilar as possible. Depending on the nature of the data and the purpose for which clustering is being used, different measures of similarity may be used to place items into classes, where the similarity measure controls how the clusters are formed. Some examples of measures that can be used as in clustering include distance, connectivity, and intensity.
In hard clustering data is divided into distinct clusters, where each data element belongs to exactly one cluster. In fuzzy clustering (also referred to as soft clustering), data elements can belong to more than one cluster, and associated with each element is a set of membership levels. These indicate the strength of the association between that data element and a particular cluster. Fuzzy clustering is a process of assigning these membership levels, and then using them to assign data elements to one or more clusters.
One of the most widely used fuzzy clustering algorithms is the Fuzzy c means (FCM) Algorithm (Bezdek 1981). The FCM algorithm attempts to partition a finite collection of elements X={x1,…,xn} into a collection of c fuzzy clusters with respect to some given criterion. Given a finite set of data, the algorithm returns a list of cluster centers C={c1,….,cc} and a partition matrix W=ωi,j ϵ [0,1], i=1,…,n, j=1,…,c, where each element ωi,j tells the degree to which element xi belongs to cluster cj. Like the k-means algorithm, the FCM aims to minimize an objective function:
n c
𝑎𝑟𝑔𝑐𝑚𝑖𝑛 ∑ ∑ 𝑤𝑖𝑗𝑚 ||1𝑥𝑖 − 𝑐𝑗∥2 i=1 j=1
Where,
1
wij= --- c ∥𝑥𝑖−𝑐j∥2 2
∑ --- --- k=1 ∥𝑥𝑖−𝑐𝑘∥2 m-1
This differs from the k-means objective function by the addition of the membership values and the fuzzifier. The fuzzifier determines the level of cluster fuzziness. A large results in smaller memberships and hence, fuzzier clusters. In the limit, the memberships converge to 0 or 1, which implies a crisp partitioning. In the absence of experimentation or domain knowledge, is commonly set to 2.
In fuzzy clustering, every point has a degree of belonging to clusters as in fuzzy logic, rather than belonging completely to just one cluster. Thus, points on the edge of a cluster, may be in the cluster to a lesser degree than points in the center of cluster. An overview and comparison of different fuzzy clustering algorithms is available.
Any point x has a set of coefficients giving the degree of being in the kth cluster wk(x). With fuzzy c-means, the centroid of a cluster is the mean of all points, weighted by their degree of belonging to the cluster:
𝑐𝑘 = ∑ 𝑤𝑘(𝑥)𝑚𝑥
--- ∑ 𝑤𝑘(𝑥)𝑚
The degree of belonging, wk(x), is related inversely to the
distance from x to the cluster center as calculated on the previous pass. It also depends on a parameter m that controls how much weight is given to the closest center. The fuzzy c-means algorithm is very similar to the k-means algorithm
Assign randomly to each point coefficients for being in the clusters. Repeat until the algorithm has converged (that is, the coefficients' change between two iterations is no more than, the given sensitivity threshold) Compute the centroid for each cluster, using the formula above. For each point, compute its coefficients of being in the clusters, using the formula above. The algorithm minimizes intra-cluster variance as well, but has the same problems as k-means; the minimum is a local minimum, and the results depend on the initial choice of weights. Using a mixture of Gaussians along with the expectation maximization algorithm is a more statistically formalized method which includes some of these ideas: partial membership in classes. Another algorithm closely related to Fuzzy C-Means is soft K- means. Fuzzy c-means has been a very important tool for image processing in clustering objects in an image. In the 70's, mathematicians introduced the spatial term into the FCM algorithm to improve the accuracy of clustering under noise.
4.1 Fuzzy C Means Algorithm
© 2017 AJAST All rights reserved. www.ajast.net fuzzy partitioning such that a data point can belong to all
groups with different membership grades between 0 and 1. At K-step: calculate the centre vectors C(k)=[cj] with U(k) n m
∑ 𝑢ij 𝑥𝑗 j=1
Ci= --- n m ∑ 𝑢ij j=1
Update U(K), U(k+1)
1 uij = --- n
∑ ( )
k=1
If II u(k+1)-u(k)II< ϵSTOP; otherwise return to step 2. Here m is any real number greater than 1,
uijis the degree of membership of xi in the cluster j, xiis the ith of d-dimensional measured data,
cjis the d-dimension center of the cluster.
5. FAST GENERALISED FUZZY C MEANS
FCM have yielded effective segmentation for images, but still have some disadvantages: (1) although the local spatial information enhances their insensitiveness to noise to some extent, FCM still lack enough robustness to noise and outliers, especially in absence of prior knowledge of the noise; (2) in their objective functions, there exists a crucial parameter α used to balance between robustness to noise and effectiveness of preserving the details of the image, and (3) the time of segmenting an image is heavily dependent on the image size, the larger the size, the more the time-consuming.
EnFCM speeds up the FCM and significantly reduces the execution time by clustering on gray-level histogram rather than on pixels, however, it also lacks enough robustness to noise, especially mixed noises and has to select empirically the tradeoff parameter α in the FCM algorithms.
5.1 A Novel Local (Spatial and Gray) Similarity Measure Sij
(1) The spatial or location relationship of pixels within the neighbor window, for example, when the window size is expanded from 3 × 3 to 5 × 5, α should be set to different value for different spatial distance from the center of the window, otherwise some blur is unavoidably introduced for given image.
(2) The gray level or intensity relationship of the pixels within the same window, such a relationship can reflect the local neighborhood inhomogeneity of the window and thus setting the different values of α for different pixels within the window cannot only suppress the influence of the outlier but also avoid blur for given image to some extent.
To remedy the above two shortcomings of adopting a Common α, we introduce a novel factor Sij incorporating both the local spatial relationship (called Ss_ij) and the local gray-level relationship (called Sg_ij ) to replace the parameter
α and make it play a more important role in clustering. Its definition is presented as below:
𝑠𝑖𝑗 = { 𝑆𝑠𝑖𝑗 ×𝑆𝑔𝑖𝑗 𝑗 ≠ 𝑖, 0 𝑗 = 𝑖
5.2 FGFCM Algorithm
Step 1: (1) Set the number c of the cluster prototypes change from 2 to cmax (predefined or set by some validity criterion or a priori knowledge). (2) Initialize randomly those prototypes and set ϵ>0 to a very small value.
Step 2: Compute the local similarity measures Sij using for all neighbor windows over the image.
Step 3: Compute linearly-weighted summed image 𝜉 Step 4: Update the partition matrix.
Step 5: Update the prototypes
Repeat Steps 4 and 5 until the following termination criterion is satisfied:
|Vnew − Vold |<_ϵ,
Where V = [v1, v2, . . . , vc] are the vectors of cluster
prototypes.
5.3 Major Characteristics of FGFCM are summarized 1. Using a new factor Sij as a local (spatial and gray)similarity measure with aiming to guarantee both noise immunity and detail-preserving for image, and at the same time remove the empirically-adjusted parameter α. 2.Fast clustering or segmentation for given image, the segmenting time is only dependent on the number of the gray-levels q rather than the size N (q) of the image, and consequently its computational complexity is reduced from O(NcI 1) to O(qcI 2).
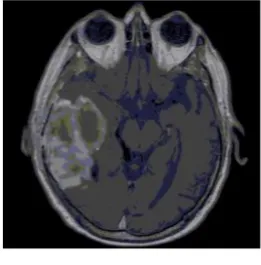
Fig. 6.1 Input image
6. ROBUST INFORMATION CLUSTERING
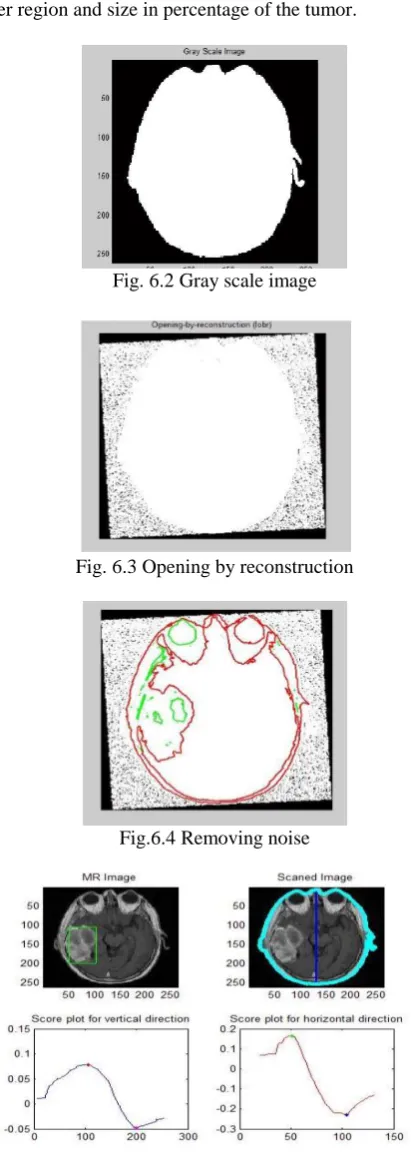
© 2017 AJAST All rights reserved. www.ajast.net to 75%.Hence using robust information clustering as shown in
fig. Using RIC skull value, size and position of tumor is determine. The result of the tumor location, tumor condition and tumor position is shown in figure. It is able to obtain the image of the tumor with information containing inner region, outer region and size in percentage of the tumor.
Fig. 6.2 Gray scale image
Fig. 6.3 Opening by reconstruction
Fig.6.4 Removing noise
Fig. 6.5 Score plot for vertical and horizontal position
7. CONCLUSION
The autonomous brain tumour detection not only detects the location of tumour but also reveals the size of tumour. In this paper, the tumor detection is performed using the clustered
genetic approach. The performance of brain tumor segmentation is evaluated based on clustering algorithm. The pre-processing is done by filtering and the segmentation is done by fuzzy c means algorithm. This method scans the RGB or grayscale, converts the image into binary image by binarization technique and detects the edge of tumor pixels in the binary image. Also, it calculates the size of the tumor by calculating the number of white pixels (digit 0) in binary image.
REFERENCES
[1] Aize Cao, et al, “Robust information clustering algorithm incorporating spatial information for breast mass detection in digitized mammograms" School of Electrical Engineering, Nanyang Technical University, Science direct September 2007.
[2] Alan Jose, et al, “Brain Tumor Segmentation Using K-Means Clustering And Fuzzy C-Means Algorithms And Its Area Calculation, International Journal of Innovative Research in Computer and Communication Engineering,
Vol. 2, Issue 3, March 2014.
[3] Ali.S.M, Loay Kadom Abood, and Rabab Saadoon Abdoon, “Brain Tumor Extraction in MRI images using Clustering and Morphological Operations Techniques”,
International Journal of Geographical Information System Applications and Remote Sensing, vol.4, no.1, 2013.
[4] Amanpreet Kaur, et al, “Overview of Tumor Detection using Genetic Algorithm”, International Journal of Innovation in Engineering and Technology, Vol 2 issue 2 April 2013.
[5] Chih Hung Wu, et al, “A new fuzzy clustering validity index with a media factor for centroid based clustering”
Member IEEE, IEEE transaction on fuzzy system, 2013.
[6] Deliang Xiang, et al, “A Kernel Clustering Algorithm With Fuzzy Factor: Application to SAR Image Segmentation,
IEEE geoscience and remote sensing letters, vol. 11, no. 7, July 2014.
[7] Djamal Boukerroui, et al, “Multiresolution texture based adaptive clustering algorithm for breast lesion segmentation”
European journal of ultrasound 8, June 1998.
[8] Elnomery Allam Zanaty, et al, “An adaptive fuzzy c means algorithm for improving MRI segments”, Mathematics Department, sohag university, scientific research December
2013.
[9] Hamed Shamsi, et al, ”A modified fuzzy c means clustering with spatial information for image segmentation”
International journal of computer theory and engineering, IACSIT, October 2012.
© 2017 AJAST All rights reserved. www.ajast.net Segmentation Application, IEEE signal processing letters,
vol. 20, no. 2, February 2013.
[11] Jiayin Kang, et al, “Novel modified fuzzy c means algorithm with application” school of Information Engineering, University of science and Technology Beijing, science direct December 2007.
[12] Mahesh Yambal, et al, “Image segmentation using fuzzy c means clustering Patel college of science and technology,
IJARCCE, July 2013.
[13] Miin-Shen Yang, et al, “A Gaussian kernel-based fuzzy c-means algorithm with a spatial bias correction” National Taiwan University of Science and Technology, May 2008.
[14] Neha Bharill, et al, “Enhanced cluster validity index for the evaluation of optimal number of clusters for fuzzy c means algorithm”, Department of computer science and engineering, IEEE international conference fuzzy system,
July 2014.