Figure 1. The flow diagram of algorithm
Color Edge Detection by Using the Centerline
Extraction Method
Li ZhangSchool of Information Science and Engineering, Xinjiang University, Urumqi 830046, China Email: [email protected]
Liejun Wang, Senhai Zhong and Gang Zhao
School of Information Science and Engineering, Xinjiang University, Urumqi 830046, China ZTEsoft Technology Co.,LTD. Urumqi 830000, Xinjiang, China
Email: Email: [email protected] , [email protected], [email protected]
Abstract—In order to obtain more complete and continuous edge information of the image, the image enhancement methods and Hessian matrix are used in the process of edge detection. Based on the gradient information of color images, the pseudo-color edges can be got by using the multi-channel edge detection. Then, enhance the edge information and remove the correlation to obtain complete edge information. The Hessian matrix is used in the last place to remove edges with redundant background texture and coarse edges so that the edge information will be more continuous and smooth. Two experiments are conducted to verify the effectiveness of the proposed method. The software is developed by using MATLAB. Experiments have confirmed that the result of proposed detection is more continuous and clearer and more details are contained. Furthermore, a good balance between the integrity and accuracy of edge detection is achieved as well.
Index Terms—color edge detection; centerline extraction; hessian matrix
I. INTRODUCTION
Edge detection, which is used in many computer vision applications, is the first fundamental and crucial step in image processing, image analysis and image understanding. The main goal of edge detection is to locate the boundaries of targets in an image. Edge detection greatly reduces the amount of insignificant information and only retains the most important information to represents the content of an image. This information is used in the subsequent target detection and recognition [1].
Color image, which contains more detailed edge information, can provide more information than gray scale image. Color edge detection has two steps, including color preprocessing and edge detection. The ways of color processing is consisted of vector-based method and color component synthesis [2-5].
Edge detection method mainly includes classical edge detection operators[6-7], mathematical
morphology method[8], wavelet-based method[9], and
surface fitting method[10]. There is always a contradiction
between getting complete edge of the target and removing extra edge of the non-target in the traditional edge detection method.
In this case, for the purpose of obtain the complete edge information, the algorithm should not only take into account of the every component’s color information in RGB image, but also maintain the advantages of traditional edge detection methods. This paper presents a new color edge detection method. First, the pseudo-color edges of the image can be got by the gradient map of each component and combination of all the component information. The pseudo-color image should be intensified by high-frequency emphasize filter. By extracting the luminance information and converting it into a binary image is the next step. After that, de-noise and extract the four connectivity of the binary image should be done. Finally, the Hessian matrix[11, 12] will be
used to extract the centerline of the edge image to obtain complete and continuous edge information.
The flow chart of the proposed algorithm contains all the key steps in the detection process, which is shown in Fig 1.
Corresponding Author: Liejun.Wang, born in 1975, associate professor, Master supervisor. His research interest covers image processing and pattern recognition. E-mail: [email protected].
II. HELPFUL HINTS A. Preliminary Color Image Edge Extraction
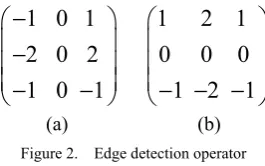
For color images, first use sobel gradient operator and the image of R, G, B components to make planar convolution to get the difference approximation of the different components under the horizontal and vertical direction. Use Fig 2 (a) to detect horizontal edges by applying the horizontal edge detection operator. Use Fig 2(b) to detect vertical edges by applying the vertical edge detection operator.
1 0 1
2 0 2
1 0 1
−
⎛
⎞
⎜
−
⎟
⎜
⎟
⎜
−
−
⎟
⎝
⎠
1
2 1
0 0 0
1 2 1
⎛
⎞
⎜
⎟
⎜
⎟
⎜
− − −
⎟
⎝
⎠
(a) (b) Figure 2. Edge detection operator
Compare the point differential value in horizontal and vertical direction after normalize the convolution result. Take each component with larger difference value as a new R, G, B value of the point, then the pseudo-color edge image is got.
Since the independence of color in ICbCr space can be exhibited better, RGB image can be transformed into ICbCr space by adopting (1).
0.2126 0.7152 0.0722 0.1146 0.3854 0.5
0.5 0.4542 0.0458
R I
G Cb
B Cr
⎛ ⎞⎛ ⎞ ⎛ ⎞
⎜− − ⎟⎜ ⎟ ⎜= ⎟
⎜ ⎟⎜ ⎟ ⎜ ⎟
⎜ − − ⎟⎜ ⎟ ⎜ ⎟
⎝ ⎠⎝ ⎠ ⎝ ⎠ (1)
Do high-frequency filtering to component I and make convolution operator with the component h and the component I. h operator is shown in (2):
1 1 1
1 8 1
1 1 1
h
− − −
⎛
⎞
⎜
⎟
= −
⎜
−
⎟
⎜
− − −
⎟
⎝
⎠
(2)
The result of convolution is a matrix with the same size as I. First, calculate the difference between each pixel and the point in its 8 regional connectivity. Through this difference, the adjustment coefficient of the center point could be got. Coefficient is used to adjust each corresponding point of the matrix. Then, the matrix basis is got. Regard the matrix basis, Cb, Cr as the parameters of the (1), rebuilds the RGB image. Transform the reconstructed RGB image into HSV space and extract the luminance component V as the gray image of the enhanced edge image.
The maximum between-cluster variance method (OTSU method) is not influenced by brightness and contrast. In this method, an image can be divided into two parts, including foreground and background according to the gray scale characteristics of the image. The larger the variance between background and target, the greater the difference between these two parts. If the target and background is misjudged, the variance between the two
classes will be smaller. So, when the variance between two classes reaches a maximum, the segmentation is optimal.
For the gray image, employ OTSU method to calculate the optimal threshold and transform the gray-scale edge image into binary image. There is a lot of small noise pixel in the binary image, but after remove the object, which occupies a very small area in the binary image, the binary image of the edge graph can be obtained.
B. Edge Optimization
There is no need to consider the degradation of picture quality when enhancing an image. It is a process to highlight the interesting information in the image, reduce the interference of information, which is not important, make characteristics of interest more remarkable. Image enhancement makes the subsequent image processing or machine analysis easier. According to the applied methods, it can be divided into frequency domain and spatial domain method. Frequency domain method has high and low pass filter and homomorphic filter, etc. Spatial domain method is divided into two categories, including point processing and template processing. Method for point processing includes gray scale transformation, histogram equalization and pseudo color processing technology while Method for template processing includes airspace sharpening and smoothing techniques, etc.
Edge is a place, where the color change is greater in an image. Therefore, the edge contains much high frequency information. To highlight the edge, highlight the high frequency information of the image is a must, which requires enhancing the high frequency information. After high-frequency emphasis, the overall gray level of images is centralized. Adopting histogram equalization method to increase the overall contrast of the image, making the brightness of the image better distributed on the histogram can help to enhance the local contrast, without influence on the overall contrast.
High-pass filter belongs to filter in frequency domain. It maintains the high frequency and suppresses the low-frequency, which is a way of sharpening image. High-pass filter includes the ideal high-High-pass filter, Butterworth high-pass filter and Gaussian high-pass filter.
Since the high-pass filter only permits the frequency, which is greater than a certain threshold go through and forbid to pass the DC, which makes the average value of the image reduces to zero. However, DC and low frequency information are corresponding to the image's background information. Lack of background information makes the image getting darker and the visual effects become worse.
One way to solve this problem is to add an offset to high-pass filter. Combining the offset and the filter multiplied by a constant larger than 1, the high-frequency emphasize filter[13] is formed. The constant multiplier
enhancement. The high-frequency emphasis filter transfer function is shown in (3):
Hhfe(u,v)=a+bHhp(u,v) (3) Wherein, the Hhp (u, v) is a high-pass filter transfer function with a is the increasing number of offset, b is a constant and b > a, a≥0.
Histogram equalization means to use a certain algorithm to make the image histogram smooth on the whole. For the original high-contrast image, equalization would make gray-scale harmonic, and contrast decreased. For gently and whitish image, equalization can merge some gray-scale pixels to make the contrast increases.
After high frequency emphasis, the contrast of edge image is decreased and the gray-scale is centralized. Using histogram equalization can improve the global contrast and the visual effect of image.
If the size of a gray-scale image is m*n, ni represents the times of gray-i occurs, then the probability of the pixel with gray-i appeared is:
P(i)= ni/m*n , i∈0,…… ,L-1; (4) L is the degree of gradations, m is the number of pixel rows of image, n is the number of pixel columns, P is the histogram of the image, normalized to [0, 1]. Regard C as a cumulative probability function corresponding to P, defined in (5):
0
( )
i( )
jc i
P j
=
=
∑
(5)C is the normalized cumulative histogram. Create a form for the transformation of Y = T (x), and produce a Y for each point in the original image, the linearization of the cumulative probability function Y can be carried out on all values within range. Its conversion formula as in (6) :
Yi=T(xi)=c(i) (6) Different levels are mapped to [0,1] by T. In order to make these values map to the original domain, the result need to be changed as in (7):
Yi’=Yi*(max-min)+min (7) Adjust the overall gray level of the image after equalization. Calculate the average value of its gray level and the original image gray level.
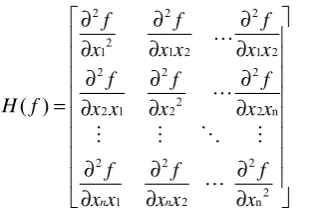
In mathematics, the Hessian matrix is the square matrix of second partial derivatives of a scalar-valued function. Given the real-valued function f (x1, x2,..., xn), if all partial second derivatives of f exist, then the Hessian matrix of ‘f’ is as in (8):
2
( )
( , )
( ) ( )
i jd
f
H i j
d x d x
=
(8)Where x = (x1, x2, ..., xn), Hessian matrix that is:
2 2 2
2
1 1 2 1 2
2 2 2
2
2 1 2 2 n
2 2 2
2
1 2 n
( )
n n
f f f
x x x x x
f f f
H f x x x x x
f f f
x x x x x
⎡∂ ∂ ∂ ⎤ ⎢∂ ∂ ∂ ⎥ ⎢ ⎥ ∂ ∂ ∂ ⎢ ⎥ ⎢ ⎥ = ∂⎢ ∂ ∂ ⎥ ⎢ ⎥ ⎢∂ ∂ ∂ ⎥ ⎢ ⎥ ∂ ∂ ∂ ⎣ ⎦ … (9) Actually, the Hessian matrix is the square matrix of second partial derivatives in the multi-variable case. It describes the change of gray level gradient in all directions.
There is a straight line on a two-dimensional plane, whose gray scale data matrix is shown in Fig. 3. Along the straight line direction on the right of the picture, which is the X direction, changes of brightness are very small so that the first order derivative and the second derivative is zero. In a direction perpendicular to the straight line on the right of the picture, which is the Y direction, the brightness changes from dark to bright, and then bright to dark., The first order derivative of such a pulse-like edge is zero and the second derivative is less than zero and reaches minimum in the straight line, where the brightness value is highest. According to the gray-scale data matrix, calculate the Hessian matrix directly, and then calculate the two eigenvalues of the matrix and look for a straight line from different directions. It can be judged by one eigenvalue is zero and the other a negative number.
Figure 3. The image and its first order derivative map
A two-dimensional Hessian matrix form as (10). 2 2 2 2 2 2
( )
f
f
x y
x
H f
f
f
y x
y
⎤
∂
⎡
∂
⎥
⎢
∂
∂ ∂
⎥
⎢
=
⎥
∂
⎢
∂
⎥
⎢
∂ ∂
∂
⎣
⎦
(10)Suppose the two eigenvalues of Hessian matrix are λ1 and λ2. If there is a linear structure in the picture, then the two eigenvalues are bound to have a negative one. Assumes that λ1 <0, then the two eigenvalues must satisfy | λ1 |> | λ2 |, in other words, if it is a linear structure, then the ratio of the absolute values of λ1 and λ2 should be great.
In the two eigenvalues of the Hessian matrix of 2 d images, the smaller one is corresponds to the maximum gradient of the image. Assume that the smaller eigenvalue is λ1, then respectively calculate the gradient of λ1 along the x, y direction to get ogx, ogy. Filter the gradient matrix with the filtering operator W and process it according to (11) to (13) to get the gx and gy.
1
0
0
1
6
1
6
6
1
1
1
0
6
6
6
0
1
1
1
4
1
6
6
6
6
1
1
1
0
0
6
6
6
1
1
1
6
0
6
0
6
W
−
⎡
−
−
⎤
⎢
⎥
−
−
−
⎢
⎥
⎢
⎥
−
−
= −
⎢
−
⎥
⎢
⎥
⎢
−
−
−
⎥
⎢
−
−
⎥
⎢
⎥
⎣
−
⎦
Figure 4. The operator W
2 2
1
FL
=
ogx
+
ogy
(11) FL1 still is a matrix. Calculate the average of all elements in FL1.2
1
FL
=
FL
(12)0.2
0.1*
2
*
1
FL
gx
ogx
FL
e
⎛
⎞
=
⎜
⎟
+
⎝
⎠
(13)0.2
0.1*
2
*
1
FL
gy
ogy
FL
e
⎛
⎞
=
⎜
⎟
+
⎝
⎠
(14)The gx and gy still is matrix. Reconstruct the edge image of gx and gy by employing the Poisson rebuilding method, adjust the brightness of image and get the gradient domain reconstruction image OUT3. Use the maximum variance between clusters to obtain an appropriate threshold T, and then use (15) to get the final edge image.
20
1
1
3
OUTIM
T
OUT
e
=
⎛
⎞
+
⎜
⎟
+
⎝
⎠
(15)
III. EXPERIMENTS &RESULTS
The two experiments conducted are used to verify the effectiveness of the proposed method. One is a comparison of detection result between the classical canny method, sobel method, the wavelet-based method and the propose method. The other is the comparison of the detection result between some latest detection methods in Ref.[14] to [18] and the proposed method.
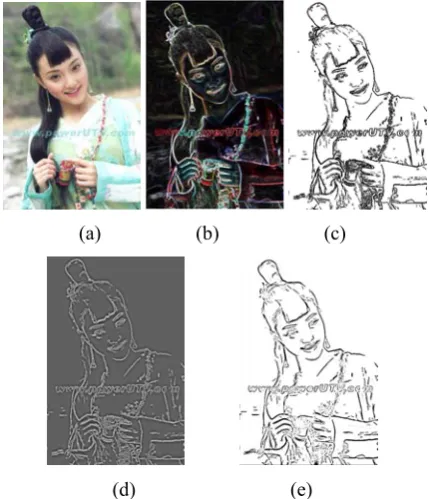
Fig. 5 shows the results of major steps in the process of the proposed method.
(a) (b) (c)
(d) (e)
Figure 5. the results of major steps(a)The original image(b)pseudo-color image (c)Preliminary result(d) the result of high-frequency emphasis
(e)the final result
For the same original image, a comparison was made between the results of the proposed algorithm, the canny, sobel edge detection method and the wavelet based method, which are shown in Fig. 6:
(a)
(b)
(c)
(d)
Figure 6. (a) results obtained by the Canny method.(b) results obtained by Sobel method.(c) results obtained by the wavelet-based
method.(d)results obtained by the proposed method.
not been detected. But the result of the proposed algorithm contains the complete information of letters and the detailed edges of the target can be detected correctly.
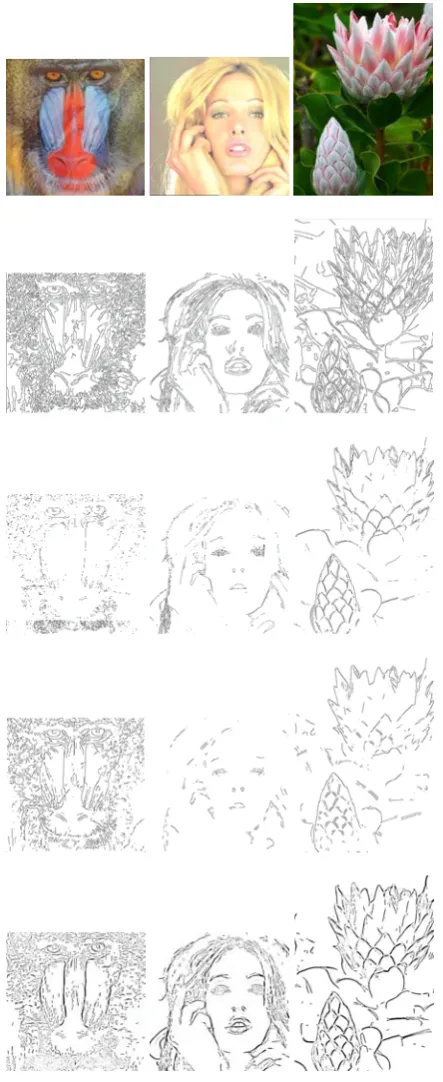
The comparison of the detection results between classical algorithms and the proposed method is shown in Fig. 7.
Figure 7. The first line: Original images. The second line: results obtained by Canny method. The third line: results obtained by Sobel method. The forth line: results obtained by the wavelet-based method.
The fifth line: results obtained by the proposed method
The comparison of the detection results between the proposed algorithm and methods in paper [14] to [18] is shown in Fig. 8:
Original image the result in the the result of the paper[14] proposed method
Original image the result in the the result of the paper[15] proposed method
Original image the result in the the result of the paper[16] proposed method
Original image the result in the the result of the paper[17] proposed method
Original image the result in the the result of the paper[18] proposed method
Figure 8. The comparison of the results between the proposed method and methods in paper [14] to [18]
To verify the effectiveness of the proposed method in this paper, the evaluation had been done from the two criteria.
For the subjective evaluation shown in Fig. 9, it is obvious that the result of the canny method is more complete, but it causes excessive test, whose result is complex and sensitive to the redundant information of background. The result of sobel method exist a relatively serious undetected phenomenon for the edge of the target is incomplete. The result of the wavelet based method is unstable and this method is only suitable for some images. Besides, most of the edge cannot be detected. The result of the method proposed in paper [14] has many redundancy information and background texture information. The result of the method in paper [15] has a coarse edge, which is not smooth enough. The result of the method in paper [16] shows many breakpoints and the continuity is poor. The result of the method in paper [17] exist undetected area and the edge is also not smooth enough. The result of the method in paper [18] is unclearly and the continuity is poor.
For the subjective evaluation, it is easily to confirm that the result of the proposed method is more complete, continuous and smooth, and insensitive to background redundancy, the effect is stable based on the comparison.
For the objective evaluation, the evaluation criteria put forwarded by paper [19] is used in this paper. This criteria means to use the number of the points along the edge, the number of 4-connectivity and 8-connectivity, and the connected component ratio as standards to objectively compare the detection result of different methods. The result was shown in table 1:
TABLE I.
DETECTION RESULT OF THE VARIOUS METHODS
Baboon
Canny Sobel Wavelet-based Proposed method
X 31878 7430 15606 4739175
Y 4676 2514 2542 2561
Z 728 1712 1102 2037
Y/X 0.147 0.334 0.163 0.0005 Z/X 0.023 0.231 0.071 0.0004 Flower
Canny Sobel Wavelet-based Proposed method
X 29738 9371 7833 5947110
Y 4267 4449 947 1096 Z 640 595 266 703 Y/X 0.144 0.475 0.121 0.0002 Z/X 0.022 0.064 0.034 0.0001 Tiffiny
Canny Sobel Wavelet-based Proposed method
X 20502 7206 11038 5371065
Y 8735 3009 2832 1553 Z 610 734 693 954 Y/X 0.426 0.418 0.257 0.0002 Z/X 0.030 0.102 0.063 0.0001 Orange
Canny Sobel Wavelet-based Proposed method
X 22782 7492 6854 5679870
Y 10263 3134 3252 2173
Z 867 1182 819 1535
Y/X 0.451 0.418 0.474 0.0004 Z/X 0.038 0.158 0.119 0.0003
Penguin
paper[14] This paper
X 4956 4639470
Y 591 930
Z 98 660
Y/X 0.120 0.0002
Z/X 0.020 0.0001
The Oriental pearl tower Paper [15] This paper
X 3495230 5082110
Y 2314 1524
Z 1168 608
Y/X 0.0007 0.0003
Z/X 0.0003 0.0001
Vegetables Paper [16] This paper
X 8471 4658595
Y 2412 1018
Z 517 723
Y/X 0.2847 0.0002
Z/X 0.0610 0.0001
Trees Paper [17] This paper
X 2253587 2938620
Y 2784 974
Z 720 653
Y/X 0.0012 0.0003
Z/X 0.0003 0.0002
Wadham college
Paper [18] This paper
X 4221566 5037270
Z 1184 1324
Y/X 0.0006 0.0003
Z/X 0.0003 0.0003
In table 1, X stand for the number of the point along the edge, Y and Z respectively stand for the number of 4-connected and 8-4-connected region. Y / X and Z / X, respectively represent the percentage of the number of 4-connectivity and 8-4-connectivity in total edge points. The smaller the percentage, the better the continuity.
Under the same evaluation criteria,the detection results of the proposed method and eight other methods were shown in table 1. Through the data in table, it is easy to find that the two indicators Y/X and Z/X in proposed method are always the minimum. It shows that the continuity of the detection result of the proposed method is better than the others. So a conclusion can be reached that both from the subjective and objective criteria to evaluate, the result of the proposed edge detection is more complete, smooth, and continuous.
IV. CONCLUSIONS
This article improved the algorithm based on the color space and proposed a new method for edge detection with the combination of edge optimization. Experimental results have confirmed that this proposed color edge detection method can provide more reasonable results compared with several other algorithms. It can improve integrity and continuity, lower down undetected rate and possess good adaptability.
ACKNOWLEDGMENT
The authors wish to thank Ding Liang and Tang Jun for their useful discussions. We thank every reviewer for their helpful comments and advices, which greatly improved this paper. The work was jointly supported by the National Natural Science Foundation of China under the project "Research on methods of mobile-based face recognition in Xin Jiang Uyghur people" with grant No. 61261036.
REFERENCES
[1] Saket Bhardwaj, Ajay Mittal, “A Survey on Various Edge Detector Techniques,” Procedia Technology,2012(4),pp.220-226.
[2] Liang L, Yang M, Tong Q, et al, “Fast Algorithm and Application of Wavelet Multiple-scale Edge Detection Filter,” Physics Procedia, 2012, 25,pp.1743-1750.
[3] Dirami A, Hammouche K, Diaf M, et al, “Fast multilevel thresholding for image segmentation through a multiphase level set method,”Signal Processing, 2012.
[4] Yang Xian,Li Bo,Ding Wen,ect, “Local Adaptive Perceptual Color Difference for Color Image Edge Detection,” Journal of Electronics & Information Technology,2012, 34(9), pp.2058-2063.
[5] Lopez-Molina C, De Baets B, Bustince H, et al, “Multiscale edge detection based on Gaussian smoothing and edge tracking,” Knowledge-Based Systems, 2013.
[6] McIlhagga W, “The Canny edge detector revisited,”
International Journal of Computer Vision, 2011,
91(3),pp.251-261.
[7] Vincent O R, Folorunso O, “A descriptive algorithm for sobel image edge detection,” Proceedings of Informing Science & IT Education Conference (InSITE).
2009,pp.97-107.
[8] Liu Qing,Lin Tu-sheng, “Image edge detection algorithm based on mathematical morphology,” Journal of South China University of Technology(Natural Science Edition) ,2008,36(9),pp.113-116,121.
[9] Jiang W, Lam K M, Shen T Z, “Efficient edge detection using simplified Gabor wavelets,” Systems, Man, and Cybernetics, Part B: Cybernetics, IEEE Transactions on,
2009, 39(4),pp.1036-1047.
[10]Du Ya-qin,Hong Bo,Guo Lei,Yang Ning, “Novel curve fitting edge feature extraction algorithm,” Journal of
Xidian University(Natural Science Edition) ,2011,38(3),pp.164-168,188.
[11]Li Guang-Ming, Tian Jie, Zhao Ming-chang, He Hui-guang, “Centerline extraction based on hessian matrix,”Journal of software, 2003, 14(12),pp.2074-2081.
[12]Frangi A F, Niessen W J, Vincken K L, et al “Multiscale vessel enhancement filtering,” Medical Image Computing and Computer-Assisted Interventation—MICCAI’98. Springer Berlin Heidelberg, 1998,pp.130-137.
[13]Duan Qun,Liu Xiao-yu,Wu Fen-xia, “An approach for image enhancement based on high frequency emphasize filter and histogram equalization,” Computer technology and automation, 2009,28(2),pp.95-97,110.
[14]Xiao F, Zhou M, Geng G, “Detail enhancement and noise reduction with true color image edge detection based on wavelet multi-scale,” Artificial Intelligence, Management Science and Electronic Commerce (AIMSEC), 2011 2nd International Conference on. IEEE, 2011, pp.1061-1064.
[15]Zhou P, Ye W, Xia Y, et al, “An Improved Canny Algorithm for Edge Detection,” Journal of Computational Information Systems, 2011, 7(5), pp.1516-1523.
[16]Jiang W, Lam K M, Shen T Z, “Efficient edge detection using simplified Gabor wavelets,” Systems, Man, and Cybernetics, Part B: Cybernetics, IEEE Transactions on,
2009, 39(4),pp.1036-1047.
[17]Verma O P, Hanmandlu M, Kumar P, et al, “A novel bacterial foraging technique for edge detection,” Pattern recognition letters, 2011, 32(8),pp.1187-1196.
[18]Zhang X, Zhang Y, Zheng R, “Image edge detection method of combining wavelet lift with Canny operator,”
Procedia Engineering, 2011, 15,pp.1335-1339.
[19]Lin Hui,Zhao Chang-sheng,Shu Ning, “Edge detection based on Canny operator and evaluation,” Journal of Heilongjiang Institute of Technology, 2003, 17(2),pp.3-6.
[20]Díaz-Pernil D, Berciano A, Peña-Cantillana F, et al,
“Segmenting images with gradient-based edge detection using Membrane Computing,” Pattern Recognition Letters,
2012.
[21]Zareizadeh Z, Hasanzadeh R P R, Baghersalimi G, “A recursive color image edge detection method using Green's function approach,” Optik-International Journal for Light and Electron Optics, 2013.
[22]Medina-Carnicer R, Muñoz-Salinas R, Carmona-Poyato A, et al, “A novel histogram transformation to improve the performance of thresholding methods in edge detection,”
Li Zhang, born in Shihezi City, Xinjiang
Province in 1988. A post graduate of the School of Information Science and Engineering, Xinjiang University, Urumqi , China, major in information processing. The research interests include image processing and image segmentation.
Liejun Wang, born in 1975, associate
professor, Master supervisor. Ph. D. graduated from Xi'an University of Posts and Telecommunications,and he is now a teacher of the Information Science and Engineering, Xinjiang University. His research interest covers image processing and pattern recognition.
Senhai Zhong, born in 1988,
postgraduate, His research interest covers image processing and feature extraction.
Gang Zhao, born in 1986, graduated of