DOI : https://doi.org/10.32628/CSEIT1952309
Energy-Aware Virtual Machine Clustering for Consolidation in Multi-tenant
IaaS Public Clouds
Kenga Mosoti Derdus*1, Vincent Oteke Omwenga2, Patrick Job Ogao3 1,2Faculty of Information Technology, Strathmore University, Nairobi, Kenya
3Faculty of Engineering Science and Technology, Technical University of Kenya, Nairobi, Kenya
ABSTRACT
Cloud computing has gained a lot of interest from both small and big academic and commercial organizations because of its success in delivering service on a pay-as-you-go basis. Moreover, many users (organizations) can share server computing resources, which is made possible by virtualization. However, the amount of energy consumed by cloud data centres is a major concern. One of the major causes of energy wastage is the inefficient utilization of resources. For instance, in IaaS public clouds, users select Virtual Machine (VM) sizes set beforehand by the Cloud Service Providers (CSPs) without the knowledge of the kind of workloads to be executed in the VM. More often, the users overprovision the resources, which go to waste. Additionally, the CSPs do not have control over the types of applications that are executed and thus VM consolidation is performed blindly. There have been efforts to address the problem of energy consumption by efficient resource utilization through VM allocation and migration. However, these techniques lack collection and analysis of active real cloud traces from the IaaS cloud. This paper proposes an architecture for VM consolidation through VM profiling and analysis of VM resource usage and resource usage patterns, and a VM allocation policy. We have implemented our policy on CloudSim Plus cloud simulator and results show that it outperforms Worst Fit, Best Fit and First Fit VM allocation algorithms. Energy consumption is reduced through efficient consolidation that is informed by VM resource consumption.
Keywords : Cloud computing, Virtualization, VM allocation algorithm, Energy efficiency, IaaS cloud.
I. INTRODUCTION
Cloud computing has gained a lot of interest from
both small and big academic and commercial
organizations because of its success in delivering
service on a pay-as-you-go basis. To address this need,
CSPs are hosting many servers in public cloud
datacenters to provide the levels of computing power
that is demanded. Additionally, organizations are
putting up private cloud data centres to be able to
control their own computing needs [1]. However, the
amount of energy consumed by the data centres is a
worrying concern. Currently, data centres are
responsible for consuming 3% of global electrical
energy consumption [2]. Enormous energy
consumption has negative effects such as increasing
operating costs of CSPs and release of carbon dioxide
to the environment [3]. According to a report by [4],
power bills dominate the operating costs of a data
The reason for energy wastage in the data centre is
inefficient workload consolidation [5] [1]. Moreover,
inefficient resource utilization and wastage of idle
power cause overall server energy wastage [6] [7].
Inefficient consolidation may be as a result of how
VMs are mapped to physical servers. For instance,
experiments carried out in [8] have shown that
co-scheduling VMs with similar profiles in terms of
resource demands is not beneficial from energy
consumption and performance point of view. If VMs
with similar profiles are co-located, there is increased
workload interference. As a result, workload tasks
run longer and more energy is consumed.
One of the technologies used in cloud computing is
virtualization and is poised to be a solution to the
problem of energy consumption [8]. This technology
enables efficient utilization of resources because
many users can use the same physical server to run
their applications with secure isolation. This type of
sharing is what is termed as multi-tenancy in the
cloud. Load balancing can also be achieved through
live VM migration, which guarantees zero downtime
during migration.
Cloud services are divided into three models:
Infrastructure as a Services (IaaS), Platform as a
Service (PaaS) and Software as a Service (SaaS) [9].
SaaS model provides service as a complete
functioning software over the internet via the
browser. PaaS provides a platform with a set of tools,
which businesses can use to develop and deploy
applications. IaaS model provides virtual computing
resources and the users have to set their environment
for them to run any applications they choose. For
small organizations, IaaS cloud is the most promising
service model and thus it is popular [10], [11]. As
such, many international CSPs such as Google,
Amazon, HP, IBM, Citrix, Rackspace, Microsoft,
DigitalOcean, Linode and Vultr are already providing
IaaS service [7]. In the IaaS cloud model, users are
allowed to pick VM sizes from CSPs’ list of available
VM types without the knowledge of the type of
applications they will execute in them [8]. Besides,
the CSPs do not have control or knowledge of the
types of applications users execute in the VMs. From
the CSP point of view, applications are a black box
host in a VM. Nevertheless, the VMs have to be
mapped to physical servers immediately. This is
dangerous if VMs meant to have similar profiles are
mapped to the same physical server according to the
conclusion made in [8]. VMs consolidated this way
need to be analyzed via their trace logs after they
start operating.
The most common method of gaining knowledge of
the application host in a VM is to monitor the VM
hosting the application [12]. Gaining this knowledge
is important for VM deployment and migration.
Deployment needs to consider application resource
usage, resource usage patterns and interference with
other applications that share tenancy in a server. This
is known as VM profiling. Trace logs collected from
techniques. These techniques include VM clustering
using k-means, basic statistics such as mean and
correlations [13]. K-means has achieved a lot of
success VM clustering for consolidation. For instance,
in [14], k-means has been used to group jobs
submitted in Google cluster trace for purposes of
understanding the relationship between task
characteristics and associated resource consumption.
Research in the area of VM profiling and trace log
analysis is made by use of publicly available workload
traces such Google cluster trace (GCT), GWA-T-12
Bitbrain dataset, GWA-T-13 Materna dataset,
WorldCup trace 98, Facebook Hadoop workloads,
OpenCloud Hadoop, Yahoo cluster traces and
Eucalyptus IaaS cluster traces [15] [16] [17]. This
because it may be time-consuming to collect such
traces from production data centres. The outcome
from workload trace analysis and characterization
can be used to achieve efficient workload
consolidation, which in turn reduce energy
consumption while maintaining the required level of
performance.
In this paper, we propose an architecture for profiling
VMs, which are consolidated without the knowledge
of the applications to be hosted from a CSP’s
perspective. This is common in the IaaS cloud service
model. Our architecture collects VM logs and the
clusters VMs based on resource usage and resource
usage patterns for purposes of re-consolidation.
Dissimilar VMs are co-located to reduce interference.
By achieving this, tasks run faster and consequently,
less energy is consumed, which is the objective of this
work.
In order to apply our architecture using real
workload traces, we have utilized GWA-T-13
Materna dataset, which contains information about
VMs hosted in a data centre that supports
business-critical workloads in Germany [16]. This dataset is
explained in section III. Further, our approach is
evaluated by simulating it using a cloud simulator
known as CloudSim Plus [18] , which is a fork of
CloudSim [19]. This simulator is written in Java
language. CloudSim and CloudSim Plus are almost
similar cloud simulator except that CloudSim Plus has
been re-engineered to remove code duplication and
to ensure code compliance to software engineering
standards. Besides, CloudSim Plus has more features
than CloudSim and is easier to use. CloudSim Plus
components are a Datacenter, a Host, a Broker, a VM
and a Cloudlet. A datacenter represents the core
infrastructure, which is hardware and software. It
holds hosts, which are computing nodes with a
specific set of computing resources (CPU core,
memory, hard disk and network bandwidth). With
virtualization, a host holds VMs, which are rented by
customers to run user applications. A cloudlet in
CloudSim Plus is synonymous to user applications,
which consume computing resources. A broker is
used to submit user applications for processing.
CloudSim provides a base or abstract classes, which
can be extended and interfaces, which can be
managed in a cloud computing environment. For
instance, VmAllocationPolicy is an abstract class, one
can use to implement own algorithm for deciding on
the host that runs a particular VM. In section VI, we
have shown the specific items that have been used or
modified to implement our algorithm. To this end,
the main contributions of this work are:
• We propose an architecture for VM resource
usage clustering for the purpose of VM allocation
with the aim of reducing energy consumption in
a centre.
• We propose an approach of clustering VM trace
logs using K-means.
• We provide early insights towards understanding
Grid Workload Archive Trace 13 (GWA-T-13)
Materna cloud dataset.
• We provide an approach for creating VMs and
cloudlets in CloudSim Plus for cloud trace log
files.
The rest of the paper is structured as follows. Section
II discusses related work. Section III elaborates the
workload dataset we have used in this paper. In
section IV, we explain the target cloud model for this
work as well as our proposed system architecture. In
section V, we explain the use of k-means for VM
clustering. In section VI and VII, we explain our
experimental setup and experiment and evaluation
results. Finally, in section VIII, we conclude the
paper as our planned future work.
II. RELATED WORK
In recent years, there has been a growth of literature
on the techniques used to efficiently manage power
usage in data centres [20] [21] [22] [23] [3] [24].
However, most of the approaches do not provide an
end-to-end approach VM characterization from
gaining access to active VM logs, through analysis to
VM consolidation based on this analysis. This is more
pronounced in IaaS cloud where applications are run
in a black box from a CSP perspective.
In [8], the authors have proposed an architecture for
mapping tasks to VMs by classifying tasks based on
average CPU, memory and disk usage together with
task priority, length and rate of submission. In order
to apply the architecture using real workload traces,
the authors have used GCT. This approach is used to
map tasks to the right sizes of VMs through the
analysis of actual resources usage. The authors
conclude that by use of their technique achieve 73%
improvement in energy consumption compared to
when VM sizes are estimated by users. The cloud
service model targeted for this work is Container as a
Service (CaaS).
An analysis in [25] shows that clustering is a
necessary analysis tool used to gain behavioural
knowledge of VMs and cloud users for prediction
purpose. This is because it is difficult to predict each
type of resource separately for two reason - VMs
create a prediction technique and different cloud
users may request different amounts of a similar
resource. So, it makes sense to cluster VMs and then
create prediction models for clusters. Thus, the
authors have proposed the use of k-means for this
purpose.
In [26], the authors have used k-means to group
cloudlets (task to be mapped to a VM) using
instruction size, execution deadline and cost paid by
the customer as a clustering feature set. The
Euclidean distance is computed using the three
clustering feature set. As such, the priority of an
incoming cloudlet is determined by the three
parameters. Authors have reported that when their
technique is compared to base techniques (existing
work), there is an improvement in power
consumption, total turnaround time, wait time,
processing time and processing cost. Moreover, the
work in [27] has reported an improvement in
performance while using a similar approach.
In [20], the authors presents a technique for
consolidation where jobs to be processed are
classified based on their resource usage. Thus, any
incoming job’s resource usage can be determined
based on the group to which it belongs. Moreover, it
is easy to map an incoming job to the right VM size
because its resource consumption is already known.
In addition, this clustering ensures that VMs running
similar jobs are not placed in similar physical servers.
The objective of this work is to better utilize the
involved physical server resource, which minimizes
energy consumption. Although the authors have not
disclosed the algorithm used to cluster the jobs,
clustering has been done anyway.
In [28], the authors propose an algorithm based on
dynamic programming that takes advantage of
scheduling dissimilar workloads in the same server.
This approach is meant to reduce server energy
consumption by consolidating workload in fewer
servers. The authors observe that co-locating highly
correlated workloads lead to VM migrations, which
decreases performance. Lowly correlated workload
ensures that severs are well parked and idle power
well utilized. The approach used in this work is
creating copies of VMs in different physical servers
and then distributing the incoming requests to these
VMs. This reduces the chance of running a similar
workload in the same server. The most applicable
cloud service model for this approach is SaaS.
Finally, the work in [1] presents an analytical model
for predicting the level of interference and impact on
the performance of co-located VMs. With this
approach, workloads are mapped to a VM, which will
lead to low interference with co-tenant VMs. The
authors have used micro benchmark applications to
generate workloads – sysbench for CPU intensive
workloads and fio for disk-intensive workloads [29].
Although the author does not mention how energy
that the increase in interference among co-residence
VM decreases energy efficiency.
III. GRID WORKLOAD ARCHIVE TRACE 13
(GWA-T-13) MATERNA
The main goal of the Grid Workload Archive (GWA)
is to provide a platform where researchers and
practitioners can share grid workloads [16]. Any
person wishing to share their grid workload can do so
as long as they are in a database format (SQLite) or
text format (CSV). GWA has collected around 13
workloads shown on their website, Materna being
the latest. Materna consists of three traces from a
distributed datacenter, namely Materna-trace-1,
Materna-trace-2 and Materna-trace-3 with 520 VMs,
527 VMs and 547 VMs respectively. Materna
provides service to different organizations featuring
different business lines such as government, digital
enterprises, IT factory and SAP business consultancy.
Materna trace is obtained from a VMware ESX
environment. The data’s format is csv with the
following information (columns) about a VM.
• Timestamp – this is the epoch timestamp in milliseconds.
• CPU cores – this is the number of vCPUs provisioned to the VM.
• CPU capacity – this is the vCPU capacity in MHZ. It is given as the product of number of cores and the speed per core.
• CPU usage (MHZ) – CPU capacity that is actually used by workloads in MHZ.
• CPU usage (%) - CPU capacity that is actually used by workloads in percentage (%).
• Memory provisioned - this is the memory capacity for the VM in KB.
• Memory usage (KB) – this is the actively used memory in KB.
• Memory usage (%) – this is the actively used memory in percentage (%).
• Disk write performance – this is the disk throughput in KB/s
• Disk size – this is the size of the HDD in GB • Network throughput (received) - this is the
network performance in terms of KB/s
• Network throughput (transmitted) - this is the network performance in terms of KB/s
The VMs running in the 3 traces are mostly the same.
The traces were collected for a period of 3 months
and each of the 3 traces contains information
representing one month. For this reason, we choose
to work with the first trace. The trace would have
een merged but this will be inaccurate because the
different number of VMs in the 3 traces makes it
difficult to identify the same VM in the three traces.
IV.CLOUD MODEL AND SYSTEM
ARCHITECTURE
In this section, we explain the cloud service model
chosen and the system components of our proposed
solution.
A. Cloud Model
In this work, the proposed cloud model is large scale
public IaaS owned by an organization, that provides
services to individuals and small organizations. In
this model, users choose VM size then sends a request
for their creation as shown in Fig 1. The requested
(VMM), and placed in a physical server. User
applications run on their specific VM and not any
other. The user has control of the VM and can
configure and execute any type of application. From
the CSP point of view, applications are a black box
host in a VM. However, in public clouds, users do not
have access to VMM, only the CSPs do [31]. To
understand the resource usage of the application
running in the cloud, the CSPs has to profile VMs.
We assume that the CSP has in place an effective
method of monitoring VM resource usage. The
dataset we have chosen to use shows the resources
actively used by the VM, which makes it sufficient
for this work [16].
Figure 1: Overview of Cloud Model
B. System Architecture
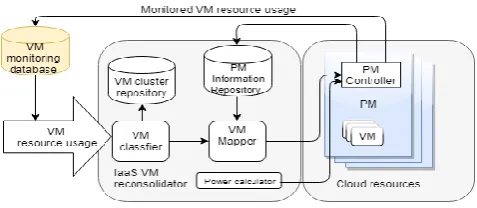
Figure 2: Proposed Architecture
Our proposed architecture is shown in Fig 2 and its
components are explained in this section. The first
part is called IaaS VM reconsolidator because the
process of consolidating a VM starts again after A VM
has been profiled.
1) VM Classifier: this component is used to classify
VMs based on their historical resource usage. It is
trained using historical data harvested from VMs.
It receives VM resource usage from the VM
monitoring database and then classifies it based
on CPU usage, memory usage and disk usage. The
complete process of clustering is discussed in
Section V. After a VM has been classified, the
classification results are stored in a VM cluster
repository and forwarded to the VM mapper.
2) VM Mapper: this component receives
classification results from the VM classifier and
determines the new host for the classified VM.
This is our modified form of VM allocation policy,
which we refer to as First Fit Increasing
Similarity (FFIS). From the host list, we find all
hosts, we call them candidate hosts
(candidateHostList), which have enough
resources to accommodate the classified VM. The
candidate hosts are then sorted in order of
increasing similarity of VMs in running hosts
with classified VM. Similarity Index, I, of a host
machine with classified VM is computed as
shown in Equation 1. The first host in the sorted
candidate host becomes the new host. The
complete operation of VM mapper is shown in
Algorithm 1.
𝐼𝑖 = 𝑘𝑖 𝑛𝑖
where k is the number of VMs in the ith host machine
that shares a group with classified VM and n is the
total number of VMs in the ith host machine.
Algorithm 1: VM Mapper Operation
Input: hostList, classfiedVm, VmClass, oldHost
Output: newHost, classfiedVm, migrationVerdict
1. for host in hostList do
2. if host has enough resources to accommodate
classfiedVm then
3. candidateHostList.add(host)
4. end if
5. end for
6. candidateHostList.sort(VmClass, candidateHostList)
7. newHost equal to candidateHostList.get(0)
8. migrationVerdict equals to ‘do nothing’
9. if newHost is not same as oldHost then
10. migrationVerdict equals ‘migrate’
11. end if
12. return newHost, classfiedVm, migrationVerdict
_____________________________________________
___
3) PM Controller: this component runs in the
Physical Machine (PM). It periodically checks
resource utilization in the PM caused by VM
utilization and sends it to the PM information
repository. Since the IaaS CSP cannot install
monitors in the rented VM, the PM controller
also monitors resource usage of the VMs via
virtualization layer and stores it in the VM
monitoring database.
4) PM Information Repository: this component
stores information regarding data centre hosts.
For instance, it is the source of host list input in
Algorithm 1.
5) Power calculator: this is a simple component that
estimates the power consumed by all active hosts
at any given time t during the execution of the
application. Total power is given by a model
shown in Equation 2.
𝑃𝑡𝑜𝑡𝑎𝑙 = ∑((𝑃𝑖′− 𝑃𝑖) 𝑘
𝑖=1
∗ ( 𝑛𝑖
100) + 𝑃𝑖 (2)
where k is the number of active hosts at time t, Pmax is
the maximum power consumption of the host, Pidle is
the power consumed host when completely idle and
nis the percentage CPU utilization of the host. We
specifically focus on the power consumption by the
CPU because of it the only server component that
shows the highest variance as regards to its utilization.
Energy, E, can be calculated as shown in Equation 3.
E = PT (3)
where P is average power consumption (in watts) and
T is a time (in seconds) interval.
V. VIRTUAL MACHINE CLUSTERING USING
K-MEANS
In order to group the pool of VMs (520 in number in
Materna-Trace-3) k-means clustering algorithm has
been used. The basic k-means algorithm is shown in
Algorithm 2. Closeness is computed using Euclidian
feature set, we have used the following features for
each VM:
1) VM CPU usage: the average CPU actually used by
the VM for the entire profiling period
2) VM memory usage: the average memory actually
used by the VM for the entire profiling period
Algorithm 2: Basic k-means algorithm
Input: Historical VM resource usage (CPU and
Memory), Number of the cluster, K
Output: Centers of cluster
1: Select K points as initial centroids
2: repeat
3:From K clusters by assigning each to its closest
centroid
4: Recalculate centroids for each cluster
5: until Centroids do not change
_____________________________________________
𝑑 = √(𝐶𝑃𝑈1− 𝐶𝑃𝑈2)2 + (𝑅𝐴𝑀1− 𝑅𝐴𝑀2)2 (4)
We have considered VM CPU and memory usage in
this case because their shortages during a short period
impact QoS negatively.
VI.EXPERIMENT SET UP
In this section, we explain how we have conducted
our experiments. We have explained VM clustering
and evaluation procedures
A. VM clustering
The dataset used in this paper is Grid Workload
Archive Trace 13 (GWA-T-13) Materna as described
in (see Section 3 of this paper). There are a total of
520 VMs in trace 1. Each VM has data collected for a
period of 1 month at 5 minutes interval. Our choice
of clustering of the feature set is explained in Section
V and the k-means algorithm has been used to group
the VMs. We have used Scikit-learn [32], a python
machine learning open source library, which includes
k-means clustering. The input to the k-means
algorithm, k, is determined using the elbow method.
We have computed the average CPU and memory
usage for all the 520 VM and used it to group the
VMs. Each VM has collected over 8300 resource
usage pints.
B. Evaluation procedure
We have evaluated our technique on Cloudsim Plus
[18] cloud simulator with a datacenter configuration
shown in Table 1. The datacenter, hosts, VMs and
cloudlets configurations are based on workload traces
described in section 3.
TABLE 1. CLOUDSIM PLUS DATACENTER
CONFIGURATIONS USED FOR EVALUATION
No. of hosts 49
No. of VMs 520
No. of CPUs 69 (454 cores) Memory size (in GB) 6780
Hypervisor VMware ESX
No. of cores allocated per VM
Varying (1,2,4,6 and 8)
Memory size allocated per host (in GB)
Varying (2,4,8 and 16)
In our evaluation, we have compared our technique
(FFIS) with the default VM selection algorithms
retained in CloudSim Plus from CloudSim [33]. For
instance, we have compared our modified VM
placement technique with well-known First Fit (FF),
Worst Fit (WF) and Best Fit (BF) VM placement
algorithms [24]. FF algorithm searches through the
running machines to host a VM in the first host that
can provide the resources demanded by a VM.
If no suitable host if found, a new one is activated. BF
picks a PM with the least residual resources while
WF picks a PM with the most residual resources. Our
evaluation follows the IaaS cloud multi-tenant cloud
model, which we have explained in section IV. For
this reason, each application runs in a specific VM.
To ensure correctness, all the algorithms are tested on
a similar data centre with similar configurations such
as power monitoring intervals, same power model,
same VM scheduling intervals. Additionally, all
algorithms do not attempt any optimization using
VM migration. Our performance metrics are total
power consumption and execution time. A summary
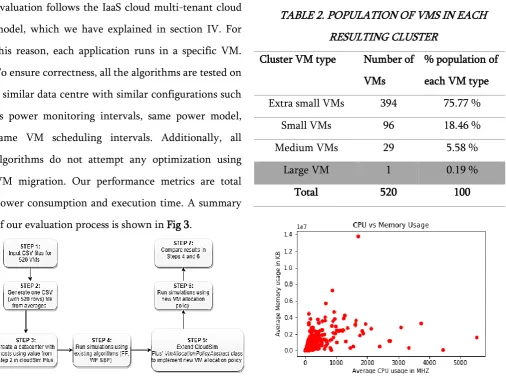
of our evaluation process is shown in Fig 3.
Figure 3: Process of evaluation
VII. EXPERIMENT RESULTS
A. VM clustering results
In this section, we go through the results of the
k-means clustering of VMs. The elbow method used to
determine k as an input to k-means has revealed that
the optimal value for k is 4. The population of VMs in
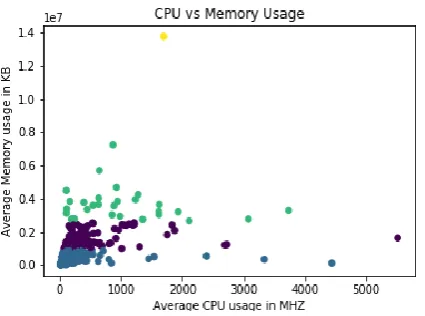
each cluster is summarized in Table 2. Fig 4 (a) and (b)
shows scatter plots before and after k-means
clustering. From Table 2 or Figure 4 (b), it can be
observed that Large VM has only one member and is
considered an outliers. Next, we describe the four
resultant VM groups.
TABLE 2. POPULATION OF VMS IN EACH
RESULTING CLUSTER
Cluster VM type Number of
VMs
% population of
each VM type
Extra small VMs 394 75.77 %
Small VMs 96 18.46 %
Medium VMs 29 5.58 %
Large VM 1 0.19 %
Total 520 100
b) Scatter plot after clustering
Figure 4: Appearance of a scatter plot before and after
k-means clustering. Notice the yellow point VM,
which we have treated as an outlier.
1) Extra small VMs: this group has a population for
394 VMs out of a total of 520 VMs, which
represents 75.77%. Most of the VMs in this group
have generally used a very small amount of both
memory and CPU except some, around 3, whose
CPU demand was high.
2) Small VMs: this group has a population of 96
VMs of a total of 520 VMs, which represents
18.46 %. The amount of memory used by these
VMs is low but is greater than that of extra small
VMs. Generally, the amount of CPU used in this
group seems to have not changed significantly
when compared with the extra small VMs group.
3) Medium VMs: this group has a population for 29
VMs out of a total of 520 VMs, which represents
5.58 %. The amount of memory used by VMs in
the group is higher than VMs in extra small and
small VMs group. Similarly, the amount of CPU
used in this group seems to have not changed
significantly.
4) Large VM: this group has only 1 VM out of a total
of 520 VMs, which represents 0.19 %. We have
considered as an outlier because of its position as
compared to the other groups. This VM has a
high memory consumption with a moderate CPU
consumption.
From our observation, we can conclude that memory
usage was very important in putting the VMs in their
respective groups. Moreover, CPU usage was
generally low. Next, we describe the evaluation
results.
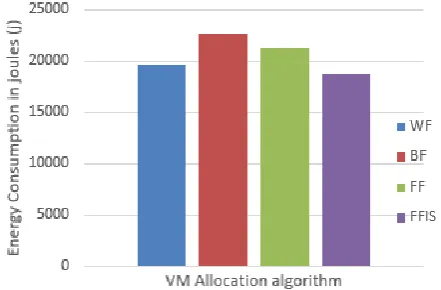
B. Evaluation results
The results of our evaluation are shown in Figure 5
and 6. The figures show the total amount of energy
consumed by all the 46 hosts and the total time of
execution respectively when executing dataset
workload using different algorithms.
We have compared our new VM allocation algorithm,
FFSI with WF, BF and FF. The first noticeable thing
is that FFSI consumes the least amount of energy,
18767 joules, compared to the other algorithms. BF
consumes the highest among of energy, 22673 joules.
FFSI is efficient because it places a VM in a host with
least similar VMs in terms of resource demands,
which, reduces the interference caused by resource
contention, thus making good use of idle power of all
the involved computing resources. It is also observed
that WF beats FF and BF in terms of energy usage.
residual resources, hence it does not lead to more
aggressive utilization and may end using not more
than the host’s idle power. VMs using WF allocation
policy have plenty of resources and it is the reason
why it uses the least time for processing as shown in
Fig 6. Although the total execution time of FFIS is
not any better than the other algorithm, the fact that
it consumes the least energy shows that its power
usage is low over time as compared to the other
algorithm. None of these algorithms have attempted
to improve performance by use of my migration.
Therefore, it is possible that that FFIS’ execution time
can be reduced by optimizing its execution through
VM migration.
Figure 5: Total amount of energy consumed by all the 46 hosts for different VM allocation algorithm
Figure 6: Total execution time for different VM allocation algorithm
VIII. CONCLUSION
In this paper we have presented a new VM allocation policy, FFIS that can be used in multi-tenant public cloud. FFIS is motivated by the fact that it is detrimental to schedule VMs running similar workloads in the same server. We have used k-means clustering to identify dissimilar VMs. Our policy has been applied on real cloud workloads and we have implemented and evaluated our policy on CloudSim Plus, which is a highly extensive cloud simulator. We have compared our policy with WF, BF and FF and results show that our policy outperforms them all in energy consumption without a significant increase in execution time. We conclude that there is a big potential for energy savings when scheduling VMs based on their resource consumption. As future work, we plan to apply our VM allocation policy to a wide range of real cloud workloads and to consider other VM resources such as disk usage and network. We also plan to enhance our algorithm through VM migration.
IX. REFERENCES
[1]. X. Chen, L. Rupprecht, R. Osman, P. Pietzuch, F. Franciosi and W. Knottenbelt, "CloudScope: Diagnosing and Managing Performance Interference in Multi-tenant Clouds," in 2015 IEEE 23rd International Symposium on Modeling, Analysis, and Simulation of Computer and Telecommunication Systems, 2015.
[2]. Industry Outlook, "Industry Outlook Data Center Energy Efficiency," 2014. [Online]. Available:
http://www.datacenterjournal.com/industry-outlook-data-center-energy-efficiency/. [Accessed 10 October 2018].
[4]. G. Albert, H. James, A. M. David and P. Parveen, "The cost of a cloud: research problems in data center networks," The ACM Digital Library is published by the Association for Computing Machinery, vol. 39, no. 1, 2009. [5]. S. Mohsen, S. Hadi and N. Mahsa, "Power-efficient distributed scheduling of virtual machines using workload-aware consolidation techniques," The Journal of Supercomputing , 2011.
[6]. F. P. Sareh, "Energy-Efficient Management of Resources in Enterprise and Container-based Clouds," The University of Melbourne , 2016. [7]. J. Patel, V. Jindal, I.-L. Yen, F. Bastani, J. Xu
and P. Garraghan, "Workload Estimation for Improving Resource Management Decisions in the Cloud," in 2015 IEEE Twelfth International Symposium on Autonomous Decentralized Systems, Taichung, Taiwan, 2015.
[8]. F. P. Sareh, R. N. Calheiros, J. Chan, A. V. Dastjerdi and R. Buyya, "Virtual Machine Customization and Task Mapping Architecture for Efficient Allocation of Cloud Data Center Resources," The Computer Journal, 2015. [9]. B. Adrian and L. Heryawan, "Analysis of
K-means Algorithm For VM Allocation in Cloud Computing," in 2015 International Conference on Data and Software Engineering (ICoDSE), Yogyakarta, Indonesia, 2015.
[10]. R. Neha and J. Rishabh, "Cloud Computing: Architecture and Concept of Virtualization," International Journal of Science, Technology & Management, vol. 4, no. 1, 2015.
[11]. B. Carmody, "Infrastructure On Demand Is Giving Small Businesses An Edge," Inc, 2018. [Online]. Available: https://www.inc.com/bill- carmody/infrastructure-on-demand-is-giving-small-businesses-an-edge.html. [Accessed 01 OCtober 2018].
[12]. P. Xuesong, P. Barbara and V. Monica, "Virtual Machine Profiling for Analyzing Resource Usage of Applications," in International
Conference on Services Computing, Milano, Italy, 2018.
[13]. S. Shen, V. v. Beek and A. Iosup, "Statistical Characterization of Business-Critical Workloads Hosted in Cloud Datacenters," in 2015 15th IEEE/ACM International Symposium on Cluster, Cloud and Grid Computing, Shenzhen, China, 2015.
[14]. M. Alam, A. S. Kashish and S. Shuchi, "Analysis and Clustering of Workload in Google Cluster Trace Based on Resource Usage," in 2016 IEEE Intl Conference on Computational Science and Engineering (CSE) and IEEE Intl Conference on Embedded and Ubiquitous Computing (EUC) and 15th Intl Symposium on Distributed Computing and Applications for Business Engineering (DCABES), Paris, France, 2016. [15]. G. D. Costa, L. Grange and I. D. Courchelle,
"Modeling and Generating large-scale Google-like Workload," in The Seventh International Green and Sustainable Computing Conference , Hangzhou, China , 2016.
[16]. Delf University, "The Grid Workloads Datasets," Delf University, 2018. [Online]. Available: http://gwa.ewi.tudelft.nl/datasets/. [Accessed October 2 2018].
[17]. C. Reiss and J. Wilkes, "Google cluster-usage traces: format + schema," Google , 2011.
[18]. F. Manoel, R. Oliveira, C. Monteiro, P. Inácio and M. Freire, "CloudSim Plus: A cloud computing simulation framework pursuing software engineering principles for improved modularity, extensibility and correctness," in 2017 IFIP/IEEE Symposium on Integrated Network and Service Management (IM), Lisbon, Portugal, 2017.
Practise and Experience , vol. 4, no. 1, pp. 23-50, 2011.
[20]. A. Al-Dulaimy, R. Zantout, W. Itani and A. Zekri, "Job Submission in the Cloud: Energy Aware Approaches," in Proceedings of the World Congress on Engineering and Computer Science , San Francisco, USA, 2016.
[21]. D. Kalyan, D. Satyabrata, K. D. Rabi and M. Ananya, "Survey of Energy-Efficient Techniques for the Cloud-Integrated Sensor Network," Hidawi - Journal of Sensors, vol. 2018, 2018.
[22]. K. Tarandeep and C. Inderveer, "Energy Efficiency Techniques in Cloud Computing- A Survey and Taxonomy," ACM Computing Surveys, vol. 48, no. 2, 2015.
[23]. S. Sobinder, S. Abhishek and K. Ajay, "A survey on techniques to achive energy efficiency in cloud computing," in 2016 International Conference on Computing, Communication and Automation (ICCCA), Noida, India, 2016. [24]. A. Khan, A. Paplinski, A. M. Khan, M. Murshed
and R. Buyya, "Dynamic Virtual Machine Consolidation Algorithms for Energy-Efficient Cloud Resource Management: A Review," in Sustainable Cloud and Energy Services, 2018. [25]. I. Salam, R. Karim and M. Ali, "Proactive
dynamic virtual-machine consolidation for energy conservation in cloud data centres," Journal of Cloud ComputingAdvances, Systems and Applications.
[26]. A. Sondhi, A. Gupta and A. Vivek, "Power Savings in Green Cloud Environment Using K-Means Clustering," International Journal of Scientific & Engineering Research, vol. 7, no. 10, pp. 1610 - 1614, 2016.
[27]. K. Sheenam and S. G. Navtej, "A NOVEL
APPROACH OF OPTIMIZING
PERFORMANCE USING K-MEANS
CLUSTERING IN CLOUD COMPUTING," International Journal of Computers & Technology, vol. 15, no. 14, 2016.
[28]. G. Hadi and P. Massoud, "Achieving Energy Efficiency in Datacenters by Virtual Machine Sizing, Replication, and Placement," in Energy Efficiency in Data Centers and Clouds, Elsevier Science, 2016.
[29]. S. Joel, "Cloud Benchmarking: Estimating Cloud Application Performance Based on Micro Benchmark Profiling," University of Zurich , 2017.
[30]. S. M. Ismael, Y. Renyu, X. Jie and W. Tianyu, "Improved Energy-Efficiency in Cloud Datacenters with Interference-Aware Virtual Machine Placement," in Autonomous Decentralized Systems (ISADS), 2013 IEEE Eleventh International Symposium, 2013. [31]. D. Jiaqing, S. Nipun and Z. Willy, "Performance
profiling in a virtualized environment," in HotCloud'10 Proceedings of the 2nd USENIX conference on Hot topics in cloud computing, Boston, USA, 2010.
[32]. Scikit-learn, "Scikit-learn : Machine Learning in Python," Scikit-learn, 2018. [Online].
Available:
https://scikit-learn.org/stable/index.html.
[33]. A. Sajitha and A. Subhajini, "Analysis of CloudSim Toolkit for Implementing Energy Efficient Green Cloud Data Centers," nternational Journal for Research in Applied Science & Engineering Technology, vol. 6, no. 6, pp. 4614-4623, 2018.
Cite this article as : Kenga Mosoti Derdus, Vincent Oteke
Omwenga, Patrick Job Ogao, "Energy-Aware Virtual
Machine Clustering for Consolidation in Multi-tenant IaaS
Public Clouds", International Journal of Scientific Research
in Computer Science, Engineering and Information
Technology (IJSRCSEIT), ISSN : 2456-3307, Volume 5
Issue 2, pp. 1123-1136, March-April 2019. Available at doi :
https://doi.org/10.32628/CSEIT1952309