ISSN(Online): 2320-9801
ISSN (Print): 2320-9798
International Journal of Innovative Research in Computer
and Communication Engineering
(An ISO 3297: 2007 Certified Organization)
Vol. 3, Issue 7, July 2015
Gene Selection and Classification Using
Linear Support Vector Machine Based On
Microarray Data
Dr. T.Karthikeyan
1, Dr. B.Ragavan
2, S.Sruthi
3*Associate Professor, Department of Computer Science, PSG College of Arts & Science, Coimbatore, India1
Associate Professor, Department of Biochemistry, PSG College of Arts & Science, Coimbatore, India2
Research Scholar, Department of Computer Science, PSG College of Arts & Science, Coimbatore, India3
ABSTRACT: Microarraydata play an important role in the development of efficient cancer diagnoses and classification System using Gene Expression Data. However, micro array expression data are usually redundant and noisy, and only a subset of them present distinct profiles for different classes of samples. Thus, selecting high discriminative genes from gene expression data has become increasingly interesting in the field of bioinformatics. In this paper, a multi-objective biogeography based optimization method is proposed to select the small subset of informative relevant to the classification. A typical microarray gene expression dataset is usually both extremely sparse and imbalanced. To select multiple highly informative gene subsets for cancer classification and diagnosis, a hybrid algorithm has been proposed of statistical learning, Principle component analysis, PSO clustering, and granular computing separately eliminates irrelevant, redundant, or noisy genes in different granules at different stages and selects highly informative genes with potentially different biological functions in balance. To show the effectiveness of the proposed approach, we compare the performance of this technique with the signal-to-noise ratio (SNR) and Fmeasure. Using gene microarray datasets dataset from the adult stem cell (including both binary and multi-class multi-classification problems), we demonstrate experimentally that our proposed scheme can achieve significant empirical success and is biologically relevant for cancer diagnosis and drug discovery in terms of performance factors like precision , recall and Fmeasure.
KEYWORDS:Cancer Classification, Microarray data, Fuzzy Preference, Particle Swarm Optimization, Principle Component Analysis Support Vector Machine
I. INTRODUCTION
Cancer is also known as a malignant tumour or malignant neoplasm, is a group of diseases involving abnormal cell growth with the potential to invade or spread to other parts of the body[1][2].Causes of cancer are dangerous which including genetic factors like lifestyle of the humans such as tobacco use, diet, and physical activity; certain types of infections; and environmental exposures to different types of chemicals and radiation[3]. Different types of cancer is bladder cancer , Brain tumouretc which can be have 60 and more types in cancer for both children’s and adults. Recent advances in microarrays technology allow scientists to measure the expression levels of thousands of genes simultaneously in biological organisms and have made it possible to create databases of cancerous tissues. It finally produces gene expression data that contain useful information of genomic, diagnostic, and prognostic to select informative genes that contribute to a cancerous state.
However, the gene selection process poses a major challenge because of the following characteristics of gene expression data[4]: the huge number of genes compared to the small number of samples (high-dimensional data), irrelevant genes, and noisy data. To overcome this challenge, a gene selection method is used to select a subset of informative genes that maximizes classifier’s ability to classify samples more accurately[5]. In computational intelligence domain, gene selection is called feature selection.
The gene selection has several advantages.
ISSN(Online): 2320-9801
ISSN (Print): 2320-9798
International Journal of Innovative Research in Computer
and Communication Engineering
(An ISO 3297: 2007 Certified Organization)
Vol. 3, Issue 7, July 2015
3) It can reduce computational time. 4) It can remove irrelevant and noisy genes. 5) It can reduce the cost in a clinical setting.
In classification of gene expression data, selecting a smaller subset of informative genes from thousands of genes is a critical step for accurate cancer classification. In the context of cancer classification, gene selection methods can be classified into two categories[6]. If a gene selection method is carried out independently from a classification procedure, it belongs to the filter method. Otherwise, it is said to follow a hybrid (wrapper) method. In the early era of microarrays analysis, most previous works have used the filter method to select genes since it is computationally more efficient than the hybrid method. Many filter methods are usually mentioned as individual gene-ranking methods such as t-test, signal-to-noise-ratio, information gain, etc. Cancer classification using gene expression data usually relieson traditional supervised learning techniques, in which onlylabeled data (i.e., data from a sample with clinical follow-up) canbe exploited for learning, while unlabeled data (i.e., data froma sample without clinical follow-up) are disregarded[7].
Recentresearch in the area of cancer diagnosis suggests that unlabeleddata, in addition to the small number of labeled data, can producesignificant improvement in accuracy[8], a technique calledsemi supervised learning [9]. They evaluate a gene based on its discriminative power for the target classes without considering its correlations with other genes. This mechanism may result in inclusion of irrelevant and noisy genes in a gene subset for the cancer classification. The irrelevant and nosy genes reduce the classification accuracy. Meanwhile, these genes also increase the dimensionality of the gene subset and, in turn, rise their computational time. At the moment, several hybrid methods, especially a combination between particle swarm optimization (PSO) and a classifier, have been implemented to select informative genes.
The hybrid methods usually provide greater accuracy than the filter methods since the genes are selected by considering and optimizing correlations among genes. Recently, several gene selection methods based on PSO have been proposed to select informative genes from gene expression data. PSO is a new population-based stochastic optimization technique. This approach produced 100% classification accuracy in many datasets, but it used a high number of selected genes (large gene subset) to achieve the high accuracy. It uses the high number because of the global best particle is reset to zero position when its fitness values do not change after three consecutive iterations.
A hybrid of PSO and PCA has best classification for the same purpose. Unfortunately, the accuracy result is still not high and many genes are selected for cancer classification since there are no direct probability relations between PCA and PSO. Generally, the PSO-based methods are intractable to efficiently produce a small (near-optimal) subset of informative genes for high classification accuracy. This is mainly because the total number of genes in gene expression data is too large (high-dimensional data).
Present work of the cancer Diagnosis is carried out using the fuzzy preference with transductive Support Vector machine which achieve the performance of the system to the good results in terms of detection accuracy and detection speed. The diagnostic goal is to develop a medical procedure based on the least number of possible genes that needed to detect diseases. The remainder of the Sections is organized as section 2 explains the related work and it is followed by proposed System in the section 3, finally the Section 4 proves the experimental part and it is concluded with section 5.
II. RELATED WORK A.Fuzzy Preference for feature classification:
In practice, fuzzy rough set models [1] address three key issues:
i)Inducing a granular structure on the universe based on an attribute or a criterion; ii) Aggregating the granular structures obtained from different attributes or criteria, and
ISSN(Online): 2320-9801
ISSN (Print): 2320-9798
International Journal of Innovative Research in Computer
and Communication Engineering
(An ISO 3297: 2007 Certified Organization)
Vol. 3, Issue 7, July 2015
The second technique is of a lexicographic character and consists of step-by-step introducing of fuzzy preference relations[12]. The third technique is based on aggregating membership functions of subsets of nondominated alternatives corresponding to each preference relation[13]. These techniques have served for developing a corresponding system for multiobjective decision making (MDMS).
B. Independent Component Analysis
Independent component analysis (ICA) is a statistical method for transforming an observed multidimensional
random vector into components that are statistically as independent from each other as possible. We use a combination of two different approaches for linear ICA: Common’s information theoretic approach and the
projection pursuit approach. Using maximum entropy approximations of differential entropy, we introduce a family of new contrast functions for ICA. The statistical properties of the estimators based on such contrast functions are analyzed under the assumption of the linear mixture model, and it is shown how to choose contrast functions that are robust and/or of minimum variance.
III.PROPOSED ALGORITHM
Principle Component Analysis is used for finding more relevant gene markers from microarray gene expression data. Fuzzy preference relations can reflect the degree of preference quantitatively making it more powerful in extracting information from microarray data than equivalence or dominance relations. Features is obtained by the equivalence relation between the two set obtained the component extraction. In classification analysis for features, the concepts obtained by condition attributes are used to approximately describe the decision.
This approach involves a modification of traditional mathematical programming methods associated with formulating and solving one and the same problem within the framework of mutually interrelated models. The use of the approach allows one to maximally cut off dominated alternatives. The subsequent contraction of the decision uncertainty region is based on reducing the problem to models of multiobjective choosing alternatives in a fuzzy environment with the use of PCA techniques for analyzing these models.
A. Deriving Knowledge based SVM classification through features
SVM is learning machine based on two key elements: a general purpose learning algorithm and a problem specific kernel that computes the inner product of input data points in a feature space. SVM was originally developed as two class pattern recognizationproblem [10] which has been extended to the multi-class problem. To alleviate the problem of small-size training set, transductive support vector machine (TSVM) was proposed. TSVMs seek largest separation in presence of both labeled and unlabeled data through regularization. At the initial iteration, the standard SVMs are used to obtain an initial discriminating hyper plane based on the labelled data alone. The pseudolabels are then assigned to the unlabeled samples.
ISSN(Online): 2320-9801
ISSN (Print): 2320-9798
International Journal of Innovative Research in Computer
and Communication Engineering
(An ISO 3297: 2007 Certified Organization)
Vol. 3, Issue 7, July 2015
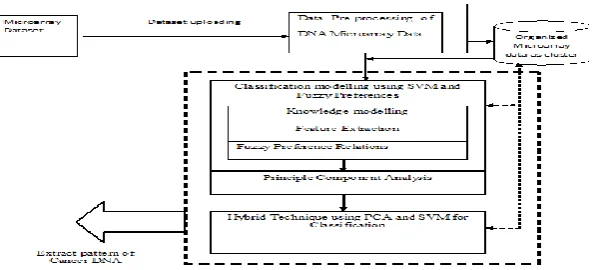
These are called semilabeled samples. Subsequently, transductive samples are selected from the semilabeled samples according to a given criterion. Fig 1 explains the overall process involved in the cancer classification from the micro array data.
Cancer classification is initially classified for features using SVM and results of the SVM is passed to Principle component analysis for the classification and clustering of the data based on dimensionality reduction, the possible maximum variance is estimated by the multivariate analysis.
A hybrid training set is thus obtained consisting of the original labeled set and transductive set. The resulting hybrid training set is used at the following iterations to find a more reliable separating hyper plane [11].
IV.PSEUDO CODE
Training the TSVM algorithm can be roughly outlined as the following steps:
Input: An initial training set and an unlabeled set .
Output: Transductive SVM classifier with initial training set and a transductive set [14].
Step 1: Specify and execute an initial inductive learning using all labelled samples, and obtain an initial SVM classifier.
Step 2: Compute the decision function values of all the unlabeled samples with the initial classifier. Obtain label vector of all the unlabeled examples. Select all the positive and negative semi labeled points within the margin band as transductive samples and add them to the initial training set to obtain a hybrid training set.
Step 3: Retrain the SVM using this hybrid training set. Compute the decision function values of all the unlabeled samples[16]. Obtain the label vector of the unlabeled samples. Select all the positive and negative semi labeled points within the margin band as transductive samples.
In cancer gene expression datasets, it is common that only some of the samples have sufficient clinical follow-up data and others are unlabeled with regard to the clinical questionof interest[15]. Therefore, we investigated whether integrating unlabeleddata from the same dataset could improve the prediction performance.
V. SIMULATION RESULTS
In this Section, we analyse the performance of the system using the microarray data, since classification is a typical and fundamental issue in diagnostic and prognostic prediction of cancer, we applied three feature selection methods to identify genes that have the discrimination capability to be used as gene markers.Fig 1 explains the overall process involved in the cancer classification from the micro array data.Our results demonstrated significantpotential of semisupervised learning in the domain of clinical problems with prevalent techniques like Particle swarm optimization for the optimization of the SVM for the cancer diagnosis
Feature selection is a useful technique in dealing with dimensionality reduction. In classification, it is used to find an optimal subset of relevant features so that the overall accuracy is increased while the datasize is reduced. When a classificationproblem is defined by features, the number of features can be quite large, many of which can be irrelevant. A relevant feature can increase the performance of a classifier while an irrelevant feature can deteriorate it. Therefore, in order to select the relevant features, it is necessary to measure the goodness of selected features using a feature selection criterion. The class separability is often used as one of the basic selection criteria. In this study, consistency measure is exploited as a selection criterion that does not attempt to maximize the class separability but aims to retain the discriminatory power of the original features.
ISSN(Online): 2320-9801
ISSN (Print): 2320-9798
International Journal of Innovative Research in Computer
and Communication Engineering
(An ISO 3297: 2007 Certified Organization)
Vol. 3, Issue 7, July 2015
Fig 2. Comparison of the Cancer Classification technique
In Fig 2, we explain the different Technique outcomes in the bar chart to depict its accuracy against the false positive rate and Signal to Noise ratio.
Signal to Noise ratio = =𝑇𝑖 +𝑇𝑃
To
Where Tiis the training data of the SVM and Tpis the training data of the PCA
To is the trained data of the Micro array data.
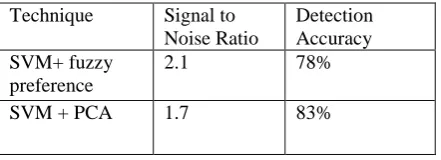
Technique Signal to Noise Ratio
Detection Accuracy SVM+ fuzzy
preference
2.1 78%
SVM + PCA 1.7 83%
Table 1. Performance of the Cancer Classification Technique
The above mentioned table 1 gives the results of classification of cancer techniques based on the signal to noise ratio and it also gives the detection accuracy on using SVM with fuzzy and PCA techniques. It is evident that the proposed method is significantly better than the homogenous Methods.Due to the fact that support vectors contain the richest information among the informative samples (i.e., the ones in the margin band), the unlabeled patterns closest to the margin bounds have the highest probability to be correctly classified. Therefore, in the proposed approach, we design a selection procedure (i.e., filtering process) to increase the acceptability of the samples with the expected correct labelling.
VI.CONCLUSION AND FUTURE WORK
We designed and implemented a Hybrid technique based on the Principle Component Analysis and Transduction SVM to address the problem of the cancer classification. In addition, we have compared the cross-validation accuracies among the various combinations of dimensionality reduction techniques.
REFERENCES
1. Q.H.Hu, D. R. Yu, and M.Guo, “Fuzzy preference based rough sets,” Inf. Sci., vol. 180, no. 10, pp. 2003–2022, 2010.
2. E. Herrera-Viedma, F. Herrera, F. Chiclana, and M. Luque, “Some issues on consistency of fuzzy preference relations,” Eur. J. Oper. Res., vol. 154, no. 1, pp. 98–109, 2004.
3. S. Bandyopadhyay, R. Mitra, and U.Maulik, “Development of the human cancer microRNA network,” BMC Silence, vol. 1, no. 6, 2010. 4. M. Belkin, P. Niyogi, and V. Sindhwani, “Manifold regularization: A geometric framework for learning from examples,” Univ. Chicago,
Chicago, IL, Tech. Rep. TR 2004–2006, 2004.
ISSN(Online): 2320-9801
ISSN (Print): 2320-9798
International Journal of Innovative Research in Computer
and Communication Engineering
(An ISO 3297: 2007 Certified Organization)
Vol. 3, Issue 7, July 2015
8. [Online].Available: http://www.biolab.si/supp/bi-cancer/projections/ index.htm
9. O. Chapelle, V. Sindhwani, and S. S. Keerthi, “Optimization techniques for semi-supervised support vectors,” J.Mach. Learn. Res., vol. 9, pp. 203– 233, 2008.
10. O. Chapelle and A. Zien, “Semi-supervised classification by low-density separation,” in Proc. 10th Int. Works. Artif. Intell. Stat., 2005, pp. 57– 64.
11. Y. Chen, G. Wang, and S. Dong, “Learning with progressive transductive support vectormachine,” Pattern Recognit. Lett., vol. 34, no. 12, pp. 1845– 1855, 2003.
12. S. Greco, B. Matarazzo, R. Slowinski, “The use of rough sets and fuzzy sets in MCDM”,Kluwer Academic Publishers, Boston, 1999, pp. 14.1– 14.59 (Chapter 14)
13. S. Greco, B. Matarazzo, R. Slowinski, “Rough approximation of a preference relation by dominance relations”, European Journal of Operational Research 117 (1999) 63–83.
14. S. Greco, B. Matarazzo, R. Slowinski, “Fuzzy dominance-based rough set approach”, Advances in Fuzzy Systems and Intelligent Technologies, Shaker Publishing, Maastricht, 2000, pp. 56–66.
15. S. Greco, B. Matarazzo, R. Slowinski, “A fuzzy extension of the rough set approach to multicriteria and multiattribute sorting”, Heidelberg, 2000, pp. 131–154.
16. S. Greco, B. Matarazzo, R. Slowinski, “Rough sets theory for multi-criteria decision analysis”, European Journal of operational research 129 (2001) 1–47.
BIOGRAPHY