Journal of Physics: Conference Series
PAPER • OPEN ACCESS
Comparison of EMD, VMD and EEMD Methods in Respiration Wave
Extraction Based on PPG Waves
To cite this article: S Hadiyoso et al 2020 J. Phys.: Conf. Ser. 1577 012040
View the article online for updates and enhancements.
2nd 2019 ICERA
Journal of Physics: Conference Series 1577 (2020) 012040
IOP Publishing doi:10.1088/1742-6596/1577/1/012040
Comparison of EMD, VMD and EEMD Methods in
Respiration Wave Extraction Based on PPG Waves
1School of Applied Science, Telkom University, Bandung, Indonesia 2Electronic Engineering, Bandung State Polytechnic, Bandung, Indonesia 3School of Electrical Engineering, Telkom University, Bandung, Indonesia
E-mail: a[email protected], b[email protected],
Abstract. Plethysmographic (PPG) wave analysis can provide interesting information including heart rate and oxygen saturation. Since PPG signals are modulated by breathing waves, further analysis can provide additional information that is the respiration rate (RR). This is a way to simplify sensor devices. This paper discusses a respiration wave extraction mechanism to calculate RR using the signal decomposition approach. Decomposition methods which are applied in this study include empirical mode decomposition (EMD), variational mode decomposition (VMD) and ensemble empirical mode decomposition (EEMD). This paper specifically addresses the performance of EEMD to EMD and VMD. This proposed method has been tested on an open PPG dataset (containing PPG and RR wave signals). Test results on 20 PPG signals, each of which had a duration of 1 minute showed that the EEMD was able to estimate the RR with an accuracy of more than 90% with an average error rate of 1 rate/minute.
1. INTRODUCTION
Vital parameters of the patient's body that are routinely or continuously monitored include heart rate (HR), body temperature, oxygen saturation and respiration rate. These parameters are measured by placing sensors in several parts of the body. For example a pulse oximeter sensor is used to measure HR and oxygen saturation. Temperature sensors are used to measure body temperature. This can cause patient discomfort if many sensors are placed on the body. One technique for the efficient use of sensors is the extraction of information for the measurement of other parameters. An example that can be done is the extraction of respiratory rate through a pulse oximeter by analyzing the PPG signal. Thus the number of sensors can be reduced.
Photoplethysmography or people know it as PPG is a traditional optical technique that long time ago has been used in the measurement of blood oxygen saturation and heart rate. Its working principle is to monitor changes in dynamics of blood flow [1]. This dynamic occurs because of changes in blood volume due to pumping by the heart. Observation of PPG waves in a certain duration shows the existence of respiratory modulation both in amplitude and frequency [2] (illustrated in Figure 1). This is a potential for developing methods or algorithms for extracting respiration waves so that they can be applied to conventional pulse
2nd 2019 ICERA
Journal of Physics: Conference Series 1577 (2020) 012040
IOP Publishing doi:10.1088/1742-6596/1577/1/012040
2
oximeters. Thus providing medical devices which are cheap, easy, simple and integrated can be realized.
The main challenge in developing methods for extracting RR from PPG is noise sensitive. PPG signals are very susceptible to noise contamination, especially low frequency noise due to motion artefacts so that it can obscure RR waves. Research continues to find the most optimal method in both complexity and accuracy. Some research on RR detection from PPG uses time, frequency, time-frequency or wavelet domain approaches. Time series analysis method based on signal decomposition has been reported in research [3]–[7]. Frequency analysis for RR extraction was reported in the study by Maldav et.al. [8]. Analysis of the time-frequency domain has also been applied to the RR estimation of the PPG signal [9]. Analysis of the wavelet domain can also be used for RR estimation as reported in the study [10]. Various methods have been proposed for the estimation or extraction of RR from PPG signals, however time series analysis-based methods will be more desirable because it will be easier if implemented in a system that has limited resources.
Figure 1 Respiratory modulation in PPG signal [11]
Time domain methods such as empirical mode decomposition (EMD), variational mode decomposition (VMD) and ensemble empirical mode decomposition (EEMD) are thought to be able to extract intrinsic respiratory modulation signals that are contained in PPG waves. Respiratory wave extraction studies from PPG using EMD, VMD or EEMD have been proposed several years ago, however a comparative study of these methods has not been conducted. This is important because to know the performance of each method so that the best method can be determined so that it can be implemented on a conventional pulse oximeter device. Therefore, this paper discusses the EMD, VMD and EEMD methods for the extraction of respiration waves from PPG. This study is a series of previous studies in which EMD and VMD have been compared [12].
2. MATERIAL AND METHOD
2.1 Dataset
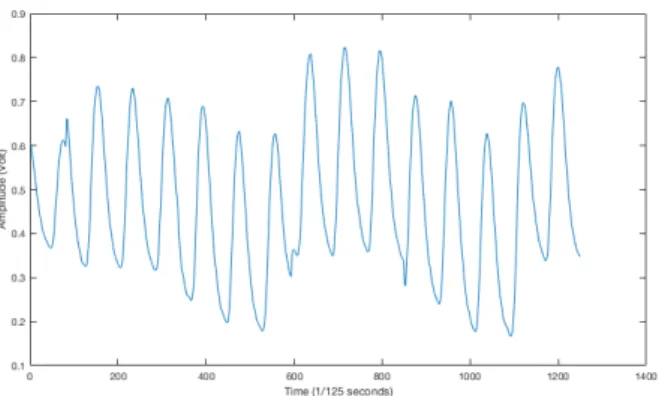
The dataset used in this study including PPG signal and respiration rate is sourced from an open dataset which can be accessed for free via https://physionet.org [13], [14].The duration of all recorded PPG signals is 8 minutes and the total number of records is 53 time series data. This PPG signal is digitized with 125 Hz sampling frequency. This dataset also includes respiration waves taken using impedance breathing techniques. In this work, the signal which is observed is the PPG signal and the signal used for performance testing is the respiratory impedance. Figure 2 below is one of the series PPG signal which is analyzed in this study. In this preliminary research, 20 series PPG signals with a duration of 60 seconds were analyzed.
2nd 2019 ICERA
Journal of Physics: Conference Series 1577 (2020) 012040
IOP Publishing doi:10.1088/1742-6596/1577/1/012040
Figure 2 Typical of PPG signal (10 seconds duration)
2.2 Ensemble Empirical Mode Decomposition (EEMD)
The EMD method has a disadvantage when oscillations with the same time scale are stored in several IMF or vice versa in one IMF storing oscillations with different time scales. This results in ineffectiveness of the EMD method due to the effect of mixing modes. The EEMD method is used to overcome the weaknesses of EMD [15]. This method has the ability to scale better as evidenced by trials with the addition of white noise to the signal, the resulting IMF does not show links with other IMF. The effectiveness of the EEMD depends on the noise amplitude (𝐴) and the choice of ensamble number (𝑁) which is seen from the final standard deviation (𝜀) value between the original signal and the resulting IMF.
𝜀 = 𝐴 √𝑁
(1)
The steps of the EEMD algorithm are as follows:
1. 𝑌'(𝑡) = 𝑋(𝑡) + 𝑢'(𝑡), 𝑓𝑜𝑟 𝑛 = 1,2, … , 𝑁
Where the original signal 𝑋(𝑡) is added with white noise 𝑢'(𝑡) so that it produces a signal with white noise according to the ensemble number (𝑁).
2. 𝑌'(𝑡) = ∑<=>;?>𝐼𝑀𝐹;(')(𝑡) + 𝑟<(')(𝑡)
Signals that have been contaminated with white noise 𝑌'(𝑡)are decomposed into several IMF with the residue. 𝑀 − 1 is the total amount of IMF decomposed from
𝑌'(𝑡), 𝐼𝑀𝐹;(') is the 𝑚th IMF and 𝑟<(') is the remainder obtained in the 𝑛th experiment.
3. Repeating the first and second steps using different white noise added to the original signal. 4. 𝐼𝑀𝐹;BCD(𝑡) = > E∑ 𝐼𝑀𝐹; (')(𝑡) E '=>
The final step is to calculate the average 𝐼𝑀𝐹;BCD of several ensembles (𝑁).
2.4 Fast Fourier Transform
A time domain signal 𝑥(𝑡) can be translated into a frequency domain 𝑋(𝜔) by using Fourier transform. The transformation is expressed in equation (2).
2nd 2019 ICERA
Journal of Physics: Conference Series 1577 (2020) 012040
IOP Publishing doi:10.1088/1742-6596/1577/1/012040 4 𝑋(𝜔) = H 𝑥(𝑡)𝑒N =JKL𝑑𝑡 =N (2)
With 𝑖 = √−1 and 𝑒JP = cos 𝜃 − 𝑖 sin 𝜃. 𝑋(𝜔) is the spectrum of the signals [16].
The fast Fourier transform (FFT) is a fast-computational algorithm for a discrete Fourier transform (DFT). For a discrete and periodic signal 𝑎' for 𝑛 = 0,1, … , 𝑁 − 1, the DFT can be
calculated using equation (3).
𝐴Y = Z 𝑒=J[\]Y'𝑎' E=>
'?^
(3)
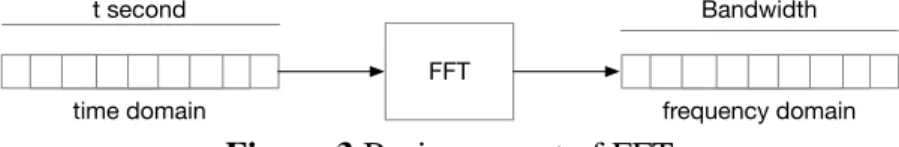
FFT can be said as the fast algorithm for computing DFT. The FFT process has to do with taking an array of time-domain wave form samples processing those to produce an array of frequency-domain spectrum samples [17].
Figure 3 Basic concept of FFT
Figure 3 showed the basic concept of FFT. The N samples of input array in the time domain with t seconds has the same size with the output samples (bidirectional bandwidth). Note that N must be a power of 2 for FFT algorithm to be truly “fast”. On the input side, we have real valued samples, while in the output side we have complex valued samples. For this reason, we typically work with magnitude and phase representation of the complex values. To compute DFT with N point sequence, DFT needs a 𝑁_ multiplications while FFT only needs 𝑁 log_𝑁. This multiplications affect the processing time for evaluating the signal. In
this study, FFT was used for the analysis of decomposition signal in frequency domain.
2.5 Proposed RR Extraction Method
In this section, the proposed method in the purpose of respiratory wave extraction is explained. Figure 4 shows the proposed method for this study. This method refers to previous research, so EMD and VMD are not discussed in this paper. Pre-processing aims to reject DC noise and signal normalization. Then the signal is decomposed using EEMD. Fourier transform was applied to each decomposition signal for the analysis of respiration wave candidates. Criteria for respiratory wave candidates are signals with dominant spectral power at frequencies below 1 Hz. Signals with a frequency of 1 Hz or more are considered heart rate information or noise signals. The proposed method validation is by comparing the estimated RR with the actual RR.
Figure 4 Proposed method
FFT
time domain frequency domain
2nd 2019 ICERA
Journal of Physics: Conference Series 1577 (2020) 012040
IOP Publishing doi:10.1088/1742-6596/1577/1/012040
3. RESULT AND DISCUSSION
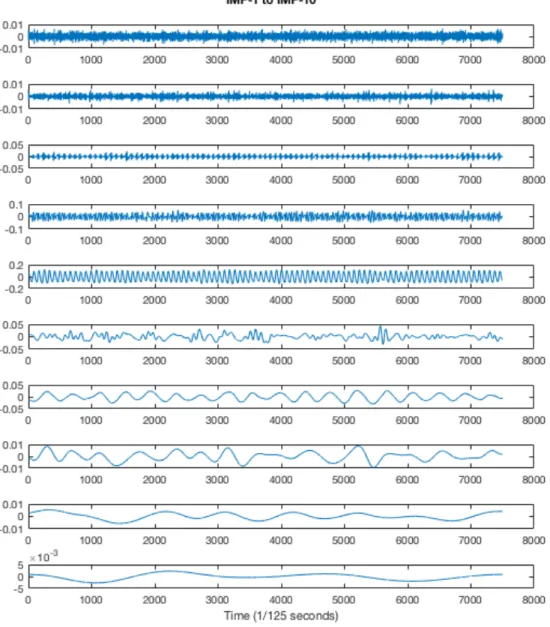
In methods are not discussed in detail, but only as a comparison to the proposed method in this paper.Since the observed PPG signal contains very little noise, we set the parameter noise standard deviation EEMD is 0.1. The decomposition results which is called IMF of a 60-second PPG signal are presented in Figure 5.
Figure 5 Decomposition signals
(sequentially from top to bottom represents IMF-1 to IMF-10)
The next process is identification of respiration wave candidates by conducting spectral power analysis for each IMF. IMF signals in the frequency domain are presented in Figure 6.
2nd 2019 ICERA
Journal of Physics: Conference Series 1577 (2020) 012040
IOP Publishing doi:10.1088/1742-6596/1577/1/012040
6
Figure 6 IMF signals in the frequency domain
Referring to the typical respiration frequency criteria, IMF-7 is the most powerful candidate which represents RR. The power spectrum of IMF-7 shows one of the most
2nd 2019 ICERA
Journal of Physics: Conference Series 1577 (2020) 012040
IOP Publishing doi:10.1088/1742-6596/1577/1/012040
dominant frequencies, that frequency is close to 0.4 Hz. Validation was done visually by comparing IMF-7 signals with reference respiration waves as shown in Figure 7. Figure 7 contains the IMF-7 signal (red-line) as an estimate of a breathing wave and the other one is a reference signal (blue-line). The whole process was also carried out on nineteen other PPG signals and then a performance test was performed with the RR estimate as a parameter. The results of this test are presented in Table 1.
Figure 7 IMF-7 signals and reference breathing waves Table 1 Estimated and actual respiration rate
Signal RR Actual/min.
Estimated RR/min. Delta error (RR/min.)
EMD VMD EEMD EMD VMD EEMD
PPG1 23 23 24 24 0 1 1 PPG2 16 17 20 17 1 4 1 PPG3 17 21 20 20 4 3 3 PPG4 17 20 19 16 3 2 1 PPG5 14 14 14 14 0 0 0 PPG6 19 18 19 19 1 0 0 PPG7 20 21 20 19 1 0 1 PPG8 21 21 21 20 0 0 1 PPG9 20 24 19 24 4 1 4 PPG10 18 17 18 18 1 0 0 PPG11 14 16 12 14 2 2 0 PPG12 18 19 18 18 1 0 0 PPG13 18 15 18 18 3 0 0 PPG14 16 20 16 16 4 0 0 PPG15 19 16 18 21 3 1 2 PPG16 23 17 23 23 6 0 0 PPG17 18 18 18 19 0 1 3 PPG18 18 15 18 18 3 0 0 PPG19 19 14 18 18 5 1 1 PPG20 25 26 23 23 1 2 2 Mean Mean Error 2.1 0.9 1
2nd 2019 ICERA
Journal of Physics: Conference Series 1577 (2020) 012040
IOP Publishing doi:10.1088/1742-6596/1577/1/012040
8
Table 1 presents the EMD, VMD and EEMD results in estimating the RR of the PPG wave. The number of PPG data which was tested in this paper differs from previous studies. In this paper the proposed method was tested on a larger number of PPG data in order to get a better generalization of results. From Table 1, it is known that VMD performance is better than EMD, this is consistent with previous study [12]. An encouraging and interesting result is that EEMD has a competitive performance against the VMD method. The average errors of VMD and EEMD are 0.9 and 1 rate/min. respectively. This error is much less compared to EMD.
From the simulations that have been carried out, the proposed method has better performance compared to EMD. However, it is not better than VMD. But the EEMD method was becoming a competitive method because the breath waves are more easily identified at a fixed IMF. In observing a total of 20 PPG data series with a duration of 60 seconds, the EEMD always estimates breath waves in IMF-7. EEMD was able to provide better accuracy compared to EMD, this is because EEMD has better performance for noise compensation compared to EMD. With these characteristics, EEMD has great potential to be implemented in conventional PPG devices by considering memory resources.
4. CONCLUSION
This study has successfully simulated a method for the extraction of respiration waves from PPG signals. Specifically discuss the EEMD method for estimating RR. Performance and validation tests have been carried out on 20 PPG data series with a duration of 60 seconds. The performance parameter of the proposed method is the estimated number of RR. This research report is used to complement the analysis of previous research [12], the EMD and VMD methods have been compared. The test results show that EEMD has better performance compared to EMD and is also competitive to the VMD method. The average error detection in EEMD, EMD and VMD is 1, 2.1 and 0.9 rate/minute, respectively. The EEMD has the advantage of being able to estimate breath waves at a fixed IMF. In the future, the EEMD method has great potential and opportunity to be applied in low-cost PPG devices.
photoplethysmographic signal by recursive bayesian tracking of intrinsic modes in time-frequency spectra. Sensors (Switzerland) 18(6) pp. 1–16. https://doi.org/10.3390/s18061693.
[2] Jarchi, D., Salvi, D., Tarassenko, L., & Clifton, D. A. 2018 Validation of Instantaneous Respiratory Rate Using Reflectance PPG from Different Body Positions. Sensors (Basel, Switzerland)18(11). https://doi.org/10.3390/s18113705.
[3] Fusco, A., Locatelli, D., Onorati, F., Durelli, G. C., & Santambrogio, M. D. 2015 On how to extract breathing rate from PPG signal using wearable devices. IEEE Biomedical Circuits and Systems Conference: Engineering for Healthy Minds and Able Bodies,
BioCAS 2015 - Proceedings (December).
https://doi.org/10.1109/BioCAS.2015.7348369.
[4] Garde, A., Karlen, W., Dehkordi, P., Ansermino, J. M., & Dumont, G. A. 2013 Empirical mode decomposition for respiratory and heart rate estimation from the photoplethysmogram. Computing in Cardiology40 pp. 799–802.
[5] Motin, M. A., Karmakar, C. K., & Palaniswami, M. 2019 Selection of empirical mode decomposition techniques for extracting breathing rate from PPG IEEE Signal
5. REFERENCES
2nd 2019 ICERA
Journal of Physics: Conference Series 1577 (2020) 012040
IOP Publishing doi:10.1088/1742-6596/1577/1/012040
Processing Letters26(4), 592–596. https://doi.org/10.1109/LSP.2019.2900923.
[6] Prathyusha, B., Rao, T. S., & Asha, D. 2012 Extraction of Respiratory Rate From Ppg Signals Using Pca and Emd. International Journal of Research in Engineering and Technology01(02), pp. 164–184. https://doi.org/10.15623/ijret.2012.0102016.
[7] Ye, H., Zhu, J., Cheng, Y., Xue, D., Wang, B., & Peng, Y. 2018 PPG based Respiration Signal Estimation using VMD-PCA. In 24th International Conference on Automation and Computing (ICAC) (pp. 1–5). https://doi.org/10.23919/iconac.2018.8748954.
[8] Madhav, K. V., Krishna, E. H., & Reddy, K. A. 2017 Extraction of respiratory activity from PPG signals using an adaptive fourier coefficient estimator. In 2016 International Conference on Control Instrumentation Communication and Computational
Technologies, ICCICCT 2016 (pp. 446–451).
https://doi.org/10.1109/ICCICCT.2016.7987991.
[9] Dehkordi, P., Garde, A., Molavi, B., Ansermino, J. M., & Dumont, G. A. 2018 Extracting instantaneous respiratory rate from multiple photoplethysmogram respiratory-induced variations Frontiers in Physiology, 9(JUL), pp. 1–10. https://doi.org/10.3389/fphys.2018.00948.
[10] Jaafar, R., & Rozali, M. A. A. 2018 Estimation of breathing rate and heart rate from photoplethysmogram Proceedings of the 2017 6th International Conference on Electrical Engineering and Informatics: Sustainable Society Through Digital Innovation, ICEEI 2017, pp. 1–4. https://doi.org/10.1109/ICEEI.2017.8312414.
[11] Addison, P. S., Watson, J. N., Mestek, M. L., & Mecca, R. S. 2012 Developing an algorithm for pulse oximetry derived respiratory rate (RRoxi): A healthy volunteer study Journal of Clinical Monitoring and Computing 26(1), pp. 45–51. https://doi.org/10.1007/s10877-011-9332-y.
[12] Hadiyoso, S., Dewi, E. M., & Mengko, T. L. E. R. 2019 Respiratory Rate Extraction Based on Plethysmographic Wave Analysis In The 1st Bandung Applied Biomedical and Technology in Health Conference (BABTECH) pp. 1–11.
[13] Goldberger AL, Amaral LAN, Glass L, Hausdorff JM, Ivanov PCh, Mark RG, … Stanley HE. 2003 PhysioBank, PhysioToolkit, and PhysioNet: Components of a New Research Resource for Complex Physiologic Signals (2003). 101(23):e215-e220.
Circulation, 101(23), e215–e220.
[14] Pimentel, M. A. F., Johnson, A. E. W., Charlton, P. H., Birrenkott, D., Watkinson, P. J., Tarassenko, L., & Clifton, D. A. 2017 Toward a robust estimation of respiratory rate from pulse oximeters IEEE Transactions on Biomedical Engineering 64(8), pp. 1914– 1923. https://doi.org/10.1109/TBME.2016.2613124.
[15] WU, Z., & HUANG, N. E. 2009 Ensemble Empirical Mode Decomposition: a Noise-Assisted Data Analysis Method Advances in Adaptive Data Analysis 01(01), pp. 1–41. https://doi.org/10.1142/s1793536909000047.
[16] Heckbert P 1995 Fourier Transforms and the Fast Fourier Transform (FFT) Algorithm Notes Comput. Graph 3 pp. 15–463.
![Figure 1 Respiratory modulation in PPG signal [11]](https://thumb-us.123doks.com/thumbv2/123dok_us/10303913.2938774/3.892.284.612.467.620/figure-respiratory-modulation-ppg-signal.webp)