Dynamic Agent Classification and Tracking Using
an Ad Hoc Mobile Acoustic Sensor Network
David Friedlander
Applied Research Laboratory, The Pennsylvania State University, P.O. Box 30, State College, PA 16801-0030, USA Email:[email protected]
Christopher Griffin
Applied Research Laboratory, The Pennsylvania State University, P.O. Box 30, State College, PA 16801-0030, USA Email:cgriffi[email protected]
Noah Jacobson
Applied Research Laboratory, The Pennsylvania State University, P.O. Box 30, State College, PA 16801-0030, USA Email:[email protected]
Shashi Phoha
Applied Research Laboratory, The Pennsylvania State University, P.O. Box 30, State College, PA 16801-0030, USA Email:[email protected]
Richard R. Brooks
Applied Research Laboratory, The Pennsylvania State University, P.O. Box 30, State College, PA 16801-0030, USA Email:[email protected]
Received 12 December 2001 and in revised form 5 October 2002
Autonomous networks of sensor platforms can be designed to interact in dynamic and noisy environments to determine the oc-currence of specified transient events that define the dynamic process of interest. For example, a sensor network may be used for battlefield surveillance with the purpose of detecting, identifying, and tracking enemy activity. When the number of nodes is large, human oversight and control of low-level operations is not feasible. Coordination and self-organization of multiple autonomous nodes is necessary to maintain connectivity and sensor coverage and to combine information for better understanding the dy-namics of the environment. Resource conservation requires adaptive clustering in the vicinity of the event. This paper presents methods for dynamic distributed signal processing using an ad hoc mobile network of microsensors to detect, identify, and track targets in noisy environments. They seamlessly integrate data from fixed and mobile platforms and dynamically organize plat-forms into clusters to process local data along the trajectory of the targets. Local analysis of sensor data is used to determine a set of target attribute values and classify the target. Sensor data from a field test in the Marine base at Twentynine Palms, Calif, was analyzed using the techniques described in this paper. The results were compared to “ground truth” data obtained from GPS receivers on the vehicles.
Keywords and phrases:sensor networks, distributed computing, target tracking, target identification, self-organizing systems.
1. INTRODUCTION
Distributed sensing systems combine observations from a large area network of sensors, creating the need for platform self-organization and the sharing of sensor information be-tween platforms. It is difficult to integrate the data from each sensor into a single context for the entire network. Instead, groups of sensors in local areas collaborate to produce useful information to the end user.
Our objective is to create a distributed wireless network of sensors covering large areas to obtain an accurate repre-sentation of dynamic processes occurring within the region. Such networks are subject to severe bandwidth limitations and power constrains. Additionally, we need to integrate data from heterogeneous sensors.
and exchange target information within neighborhoods to determine target class and track characteristics. This differs from other methods of decentralized detection such as [1,2] where the dimensionality of the sensor data vectors is re-duced to the distinct number of target attributes. Once or-ganized into clusters, sensors can combine their local knowl-edge to construct a representation of the world around them. This information can be used to construct a history of the dynamic process as it occurs in the sensor field [3].
Our analysis is based on the concepts of a space-time neighborhood, adynamic window, and anevent. A space-time neighborhood centered on the space-time point (x0, t0) is the set of space-time points
N(x, t)≡(x, t) :x−x0≤∆x, t−t0≤∆t. (1)
The quantities ∆x and∆tdefine the size of the neighbor-hood. The space-time window contains all the data that was measured within a distance∆xaroundx0and within the time intervalt0±∆t.
We can define a dynamic window around a moving point g(t) as
ω(t)=(x, t) :x−gt0≤∆x, t−t0≤∆t. (2)
Ideally, ifg(t) were the trajectory of the target, we would an-alyze time-series data from sensors in the windowNe=ω(te)
to determine information about the target at timete.
The target trajectoryg(t) is unknown. It is, in fact, what we want to determine. We therefore look at closest-point-of-approach(CPA) events that occur within a single space-time neighborhood. A CPA eventeij is defined for platformi
oc-curring at the CPA time tj. The space-time coordinates of
the event are (xi(tj), tj), wherexi(t) is the trajectory of
plat-formi.
We make the assumption that sensor energy increases as distance from the source decreases. This is a reasonable as-sumption for acoustic and seismic sensors. The CPA event is therefore assumed to occur when there is a peak in sen-sor energy. The amplitude of the eventaij is defined as the amplitude of the corresponding peak. In order to filter out noise, reflection, or other spurious features, we count only peaks above a threshold and do not allow two events on a single platform within the same space-time window. If data from multiple sensors are available, they must be integrated to determine a single peak time for the event.
For an eventeij, we analyze data from platforms in the
neighborhood N(xi(tj), tj). We define the set of platforms
that contain events in this space-time neighborhood as the cluster of platforms associated with eventeij. These
defini-tions apply to both stationary and moving platforms and seamlessly integrate both types. They can be used to deter-mine target velocity as long as the platform trajectories are known and the platform speed is small compared to the propagation speed of the energy field measured by the sen-sors. Platform locations can be determined by GPS and, for stationary platforms, additional accuracy can be achieved by integrating GPS signals over time.
Local CPA
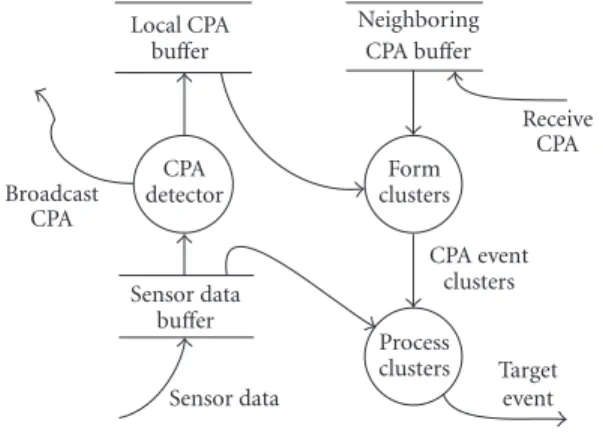
Figure1: System overview.
The sets of parameters needed to identify targets are calledtarget events. They includexi: the target position, ti:
the time,vi: the target velocity, and{a1· · ·an}: a set of
tar-get attributes for tartar-get classification, which can be deter-mined from the sensor data in a region around the space-time point (xi, ti). A CPA event is detected by a platform when the target reaches its CPA to the platform. Each CPA will correspond a peak in the readings of our acoustic sen-sors. We have developed an algorithm that limits data pro-cessing to the platforms closest to the trajectory of the tar-get rather than processing each CPA event. It evenly spreads the processing out over the space-time range of the target trajectory. All the platforms within the neighborhood of an event are assumed to be capable of communicating with each other.
The remainder of this paper is divided as follows.
Section 2 discusses the algorithm for platform clustering.
Section 3discusses our velocity and position estimation
al-gorithm.Section 4discusses our approach to target identi-fication. Section 5 provides both simulated and real-world experimental data that show that our approach produces promising results for velocity approximation and target recognition. Finally,Section 6discusses our conclusions.
2. ALGORITHM FOR EVENT CLUSTERING
Nodes located within a given space-time window can form a cluster. Both the time and spatial extent of the window are currently held constant. The maximum possible spatial size of the window is constrained by the transmission range of the sensors. Each node contains a buffer for its own CPA events, and a buffer for CPA events transmitted by its neigh-bors.Figure 1shows a simple diagram depicting the system running in parallel on each platform.
For each local CPA eventkij=k(xi, tj)
Algorithm1:Form clusterspseudocode.
clustersroutine determines the target position and velocity as described inSection 3and the target attributes as described inSection 4.
3. VELOCITY AND POSITION ESTIMATION ALGORITHM
Models of human perception of motion may be based on the spatio-temporal distribution of energy detected through vi-sion [4,5]. Similarly, the network detects motion through the spatio-temporal distribution of sensor energy.
We extend techniques found in [6] and adapt them to find accurate vehicle velocity estimates from acoustic sensor signals. The definitions shown below are for time and two spatial dimensions x = (x, y); however, their extension to three spatial dimensions is straightforward.
The platform location data from the CPA event cluster can be organized into the following sets of observations:
x0,0,x1, t1· · ·xn, tn,
y0,0,y1, t1· · ·yn, tn, (3)
where (x0, y0) is the location of eventkij(seeFigure 1), which
contains the largest amplitude CPA peak in the cluster. We redefine the times in the observations, sot0 =0 wheret0is the time of CPA eventkij.
We weighted the observations based on the CPA peak amplitudes on the assumption that CPA times are more ac-curate when the target passes closer to the sensor to give
x0, t0, w0,x1, t1, w1· · ·xn, tnwn,
y0, t0, w0,y1, t1, w1· · ·yn, tn, wn, (4)
where wi is the weight of theith event in the cluster. This
greatly improved the quality of the predicted velocities. We defined the spatial extent of the neighborhoods, so nodes do not span more than a few square meters and vehicle veloc-ities are approximately linear [6]. Under these assumptions, we can apply least square linear regression to obtain the fol-lowing equations [7]:
x(t)=vxt+c1, y(t)=vyt+c2, (5)
Input: Time-sorted event clusterFof CPA values. Output: Estimated velocity componentsvxandvy. While|F| ≥5{
Computevxandvyusing event clusterF;
Computerxandry; thevxandvyvelocity
; correlation coefficients forF Ifrx> Rxry> Ry
and the positionx(t0)=(c1, c2). The space-time coordinates of the target for this event are (x(t0), t0).
This simple technique can be augmented to ensure that changes in the vehicle trajectory do not degrade the quality of the estimated track. The correlation coefficients for the ve-locities in each spatial dimension (rx, ry) can be used to iden-tify large changes in vehicle direction and thus limit the CPA event cluster to include only those nodes that will best esti-mate local velocity. Assume that the observations are sorted as follows:
Oi< Oj−→ti−t0<tj−t0, (7)
whereOiis an observation containing a time, location, and weight and t0 is the time of the eventkij. The velocity
el-ements are computed once with the entire event set. After this, the final elements of the list are removed and the veloc-ity is recomputed. This process is repeated while at least five CPAs are present in the set and subsequently the event sub-set with the highest velocity correlation is used to determine velocity. Fewer than five CPA points could severely bias the computed velocity and thus render our approximation use-less.Algorithm 2summarizes our technique.
4. TARGET CLASSIFICATION
0 2 4 6 8 10 12 14 16 18 ×104 −1.5
−1 −0.5 0 0.5 1 1.5 ×10
4
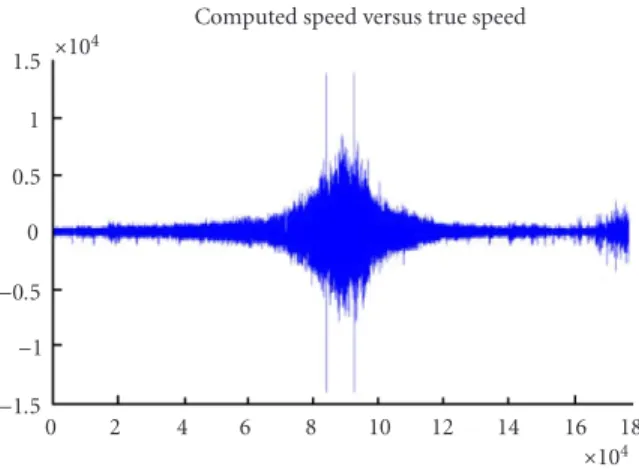
Figure2: Time series window.
determined, it is combined with velocity and position data and broadcast over the network as a target event. This re-quires much less bandwidth than transmitting the original time series data.
The singular value decomposition (SVD) [8] is a ma-trix decomposition that can be used to find relationships within sets of data. When used to construct relationships be-tween words and documents, this technique is called latent semantic analysis (LSA). There is significant evidence that LSA can be used to allow machines to learn words at a rate comparable to that of school children [9]. LSA accomplishes this by using SVD to infer relationships among members of a data set. We believe that this concept can be applied to vehicle identification.
Our identification algorithm combines Latent Semantic Analysis [9] with Principal Component Analysis [10,11] to fuse semantic attributes and sensor data for target classifica-tion. There are two algorithms:data processinganddata clas-sification. CPA event data are divided intotraining andtest sets. The training data are used with the data processing al-gorithm and the test data are used with the data classification algorithm to evaluate the accuracy of the method.
The training set is further divided into databases for each possible value of each target attribute being used in the classi-fication. Target attribute values can be used to construct fea-ture vectors for use in pattern classification. Alternatively, we can define “vehicle type” as a single attribute and identify the target directly.
A 4- to 5-second window is selected around the peak of each sample. All data outside the window is discarded. This ensures that noise bias is reduced. The two long vertical lines
inFigure 2show what the boundaries of the window would
be on a typical sample.
The window corresponds to the period of time when a vehicle was closest to the platform. The data are divided into consecutive frames. A frame is 512 data points sampled at 5 kHz (0.5 seconds in length) and has a 12.5% overlap (0.07 second) with each of its neighbors. The power spectral den-sity of each frame is found and stored as a column vector of 513 data points (grouped by originating sample) with data
Unknown
Database feature spanned subspace
Residual
Figure3: Isolating qualities in the feature space.
Table1: Quality of estimation.
Computed versus true velocity Percent
Percent within 1 m/s 81%
Percent within 2 m/s 91%
Percent within 5 degrees 64% Percent within 11 degrees 80% Percent within 17 degrees 86%
points corresponding to frequencies from 0 to 512 Hz. Target identification combines techniques from [11] and makes use of an eigenvalue analysis to give an indication of the distance that an unknown sample vector is from the feature space of each database. This indication is called a residual. These residuals can be interpreted as “a measure-ment of the likelihood” that the frame being tested belongs to the class of vehicles represented by the database [11]. The databases are grouped by attribute and the residuals of each frame within each group are compared. The attribute value corresponding to the smallest total of the residuals within each group is assigned to the frame.Figure 3illustrates this process.
5. EXPERIMENTAL RESULTS
We present two sets of results. Each demonstrates the qual-ity of our techniques for estimating vehicle velocqual-ity in a dis-tributed sensor field and identifying target characteristics. The result set comes from data collected at Twentynine Palms Marine Base during a field test and also from ideal data con-structed in the lab for testing the velocity estimation algo-rithm.
5.1. Velocity estimation
We present a verification of our clustering and velocity esti-mation algorithms using data gathered at Twentynine Palms Marine base located in California. A sensor grid was tested there in August 2000.
We have analyzed the quality of our velocity estimation algorithm using our field data and these results appear in
Table2: Classification.
Actual vehicle Classified numbers Percent correctly classified
AAV DW HV
AAV 117 4 7 94%
DW 0 106 2 98%
HV 0 7 117 94%
0 1 2 3 4 5 6 7 8 9 10 11 12 13 14 15 16 17 18 Real speed values (m/s)
0
Figure4: Computed speed versus true speed (field test).
Figures4and5show plots displaying the quality of the estimations.
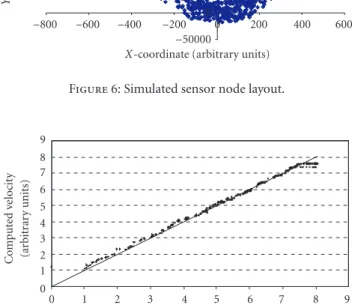
We have also generated a simulated data set for testing our velocity algorithm. The data set was generated using a parabolic vehicle motion.Figure 6shows activated sensors as the simulated vehicle passed through a dense grid of pseu-dorandomly distributed sensor platforms.Figures 7displays the results of our algorithm for vehicle speed.
The calculated vehicle speeds yielded a correlation of 0.99 against a line of y = 0.99x, where yis the calculated speed and x is the simulated speed. The angle match is also ex-tremely close.
5.2. Target identification verification
ARL evaluated its classification algorithms against the data collected during the field test. Data are shown for three types of military vehicles labeled AAV, DW, and HV. The CPA peaks were selected by hand rather than automatically detected by the software and there was only a single vehicle present in the network at a time. Environmental noise due to wind was sig-nificant. The data show that classification of military vehicles in the field can be accurate under noisy conditions, as shown inTable 2.
6. CONCLUSIONS
We have derived algorithms for target analysis that can iden-tify target attributes using time-series data from platform sensors.
We have described an effective algorithm for computing target velocity. This velocity is critical for track formation
Measured angle (radians)
89% correct within 7 degrees
0 1 2 3 4 5 6 7
7 degrees −7 degrees
Figure5: Computed angle versus true angle (field test).
−50000
X-coordinate (arbitrary units)
Figure6: Simulated sensor node layout.
0 1 2 3 4 5 6 7 8 9
True velocity (arbitrary units) 0
Figure7: Computed speed versus true speed (simulation).
algorithms like those proposed in [3]. We have described an algorithm for accurate classification of military vehicles in the field.
We have also provided experimental verification of our procedures against field data using military vehicles and acoustic sensors. We have determined quantitative measures of the accuracy of the procedures.
in bandwidth and power consumption at individual nodes. Forming dynamic clusters around events of interest allows processing multiple events in parallel over different local ge-ographic areas. We have shown how networks can coordi-nate platforms around tracks and provide relevant process-ing with a minimum of bandwidth and power consump-tion related to interplatform communicaconsump-tions. This proce-dure is scalable and takes full advantage of the parallelism in the network. The same algorithms run in parallel on each platform, making the procedure robust with respect to the loss of individual platforms. In addition, our method al-lows seamless integration of fixed and mobile heterogeneous platforms.
ACKNOWLEDGMENTS
This material is based upon work supported by the US Army Robert Morris Acquisition under Award No. DAAD19-01-1-0504. Any opinions, findings, and conclusions or recommen-dations expressed in this paper are those of the authors and do not necessarily reflect the views of the Army.
REFERENCES
[1] B. Picinbono and M. P. Boyer, “A new approach of decen-tralized detection,” inInternational Conference on Acoustics, Speech, and Signal Processing, vol. 2, pp. 1329–1332, 1991. [2] R. R. Tenney and N. R. Sandell Jr, “Detection with distributed
sensors,”IEEE Trans. on Aerospace and Electronics Systems, vol. 17, pp. 501–510, July 1981.
[3] R. Brooks, C. Griffin, and D. S. Friedlander, “Self-organized distributed sensor network entity tracking,” International Journal of High Performance Computing Applications, vol. 16, no. 3, pp. 207–219, 2002, Special Issue on Sensor Networks. [4] E. H. Adelson and J. R. Bergan, “Spatiotemporal energy
mod-els for the perception of motion,”Journal of the Optical Society of America{A}, vol. 2, no. 2, pp. 284–299, 1985.
[5] E. H. Adelson, “Mechanisms for motion perception,” Optics and Photonics News, vol. 2, no. 8, pp. 24–30, 1991.
[6] M. Hellebrant, R. Mathar, and M. Scheibenbogen, “Estimat-ing position and velocity of mobiles in a cellular radio net-work,” IEEE Trans. Vehicular Technology, vol. 46, no. 1, pp. 65–71, 1997.
[7] W. H. Press, S. Teukolsky, W. Vetterling, and B. Flannery, Nu-merical Recipes in C, Cambridge University Press, Cambridge, UK, 1992.
[8] I. T. Jolliffe, Principal Component Analysis, Springer-Verlag, New York, NY, 1986.
[9] T. K. Landauer and S. T. Dumais, “A solution to Platos prob-lem: the latent semantic analysis theory of acquisition, induc-tion, and representation of knowledge,”Psychological Review, vol. 104, no. 2, pp. 211–240, 1997.
[10] V. Bhatnagar, A. Shaw, and R. Williams, “Improved automatic target recognition using singular value decomposition,” in IEEE Trans. Acoustics, Speech, and Signal Processing, Seattle, Wash, USA, 1998.
[11] H. Wu, M. Siegel, and P. Khosla, “Vehicle sound signature recognition by frequency vector principal component anal-ysis,” inIEEE Trans. Instrumentation and Measurement, St. Paul, Minn, USA, May 1998.
gineer and Head of the Informatics Depart-ment of the Information Science and Tech-nology Division of the Applied Research Laboratory at the Pennsylvania State Uni-versity. His research includes formal lan-guages, discrete-event control applied to command and control of military opera-tions, and logistics for major industrial op-erations. He played a key role in developing
and analyzing discrete-event control systems for the command and control of air campaigns. This includes the development of meth-ods for analyzing the formal languages associated with finite state machines. He coauthoredThe Scheduling of Rail at Union Pacific Railroad, which won the Innovative Applications in Artificial In-telligence Award at the American Association for Artificial Intelli-gence in 1997. He researched methods for automating the develop-ment of Lexical Knowledge Bases. This included the use of latent se-mantic indexing (LSI) for automatically indexing an email corpus, and the use of hierarchical clustering of LSI indices for conceptual relationship discovery of the relationship between the intents of the email messages. He received the B.A. degree in physics and mathe-matics from New York University and received the M.A. degree in physics from Harvard University.
Christopher Griffin graduated with high
distinction from the Pennsylvania State University in December of 2000 with a B.S. degree in mathematics. He is currently em-ployed as an Assistant Research Engineer at the Pennsylvania State Applied Research Laboratory where his areas of research in-clude high-level logical control, automated control systems, and systems modeling. Mr. Griffin is currently pursuing his master’s
de-gree in mathematics at the Pennsylvania State University.
Noah Jacobsonis an undergraduate at the
Pennsylvania State University, working to-wards majors in mathematics and computer engineering. He is doing research on acous-tic sensor networks for vehicle tracking at the Information Science and Technology Division of Pennsylvania State Applied Re-search Laboratory. After receiving his B.S. degree, Mr. Jacobson is planning on to grad-uate school where he intends to earn a Ph.D. in computer vision.
Shashi Phohais Professor of electrical
en-gineering and Director of the Information Science and Technology Division of the Ap-plied Research Laboratory at the Pennsyl-vania State University. She has led multi-organizational advanced research programs and laboratories in major US industrial and academic institutions. She pioneered the use of formal methods for the scien-tific analysis of distributed information for
in situ analysis of correlated time-series data collected by a self-organizing sensor network of undersea robotic vehicles. She is the Principal Investigator for the Surveillance Sensor Networks MURI funded by DARPA, and the Project Director of the Complex Sys-tems Failures MURI funded by the ARO. Dr. Phoha received her M.S. degree in 1973 from Cornell University and Ph.D. degree in 1976 from Michigan State. She is an Associate Editor of IEEE Trans-action on Systems, Man, and Cybernetics. Dr. Phoha chaired the Springer-Verlag Technical Advisory Board for theDictionary of In-ternet Security, published in May 2002.
Richard R. Brooksis the Head of the
Dis-tributed Systems Department of the Ap-plied Research Laboratory, the Pennsylva-nia State University. His areas of research expertise include sensor networks, critical infrastructure protection, mobile code, and emergent behaviors. He has his B.A. degree in mathematical sciences from the Johns Hopkins University, and performed gradu-ate studies in computer science and